Facebook
 X
X
 Pinterest
 Copy Link
March 2024 Week 9
Matthew Litzenberger a third generation Realtor with Coldwell Banker Realty helps buyers and sellers understand Chicago Real Estate Market metrics. Follow along for weekly updates on all things Chicago Real Estate by clicking here.
Introduction
Hello and welcome back to the 9th installment in our weekly series aimed to help understand current Chicago Real Estate Market Metrics. While there are many metrics to talk about in the world of real estate, today we are going to look at only four: speed, demand, supply and negotiations. Let’s get started!
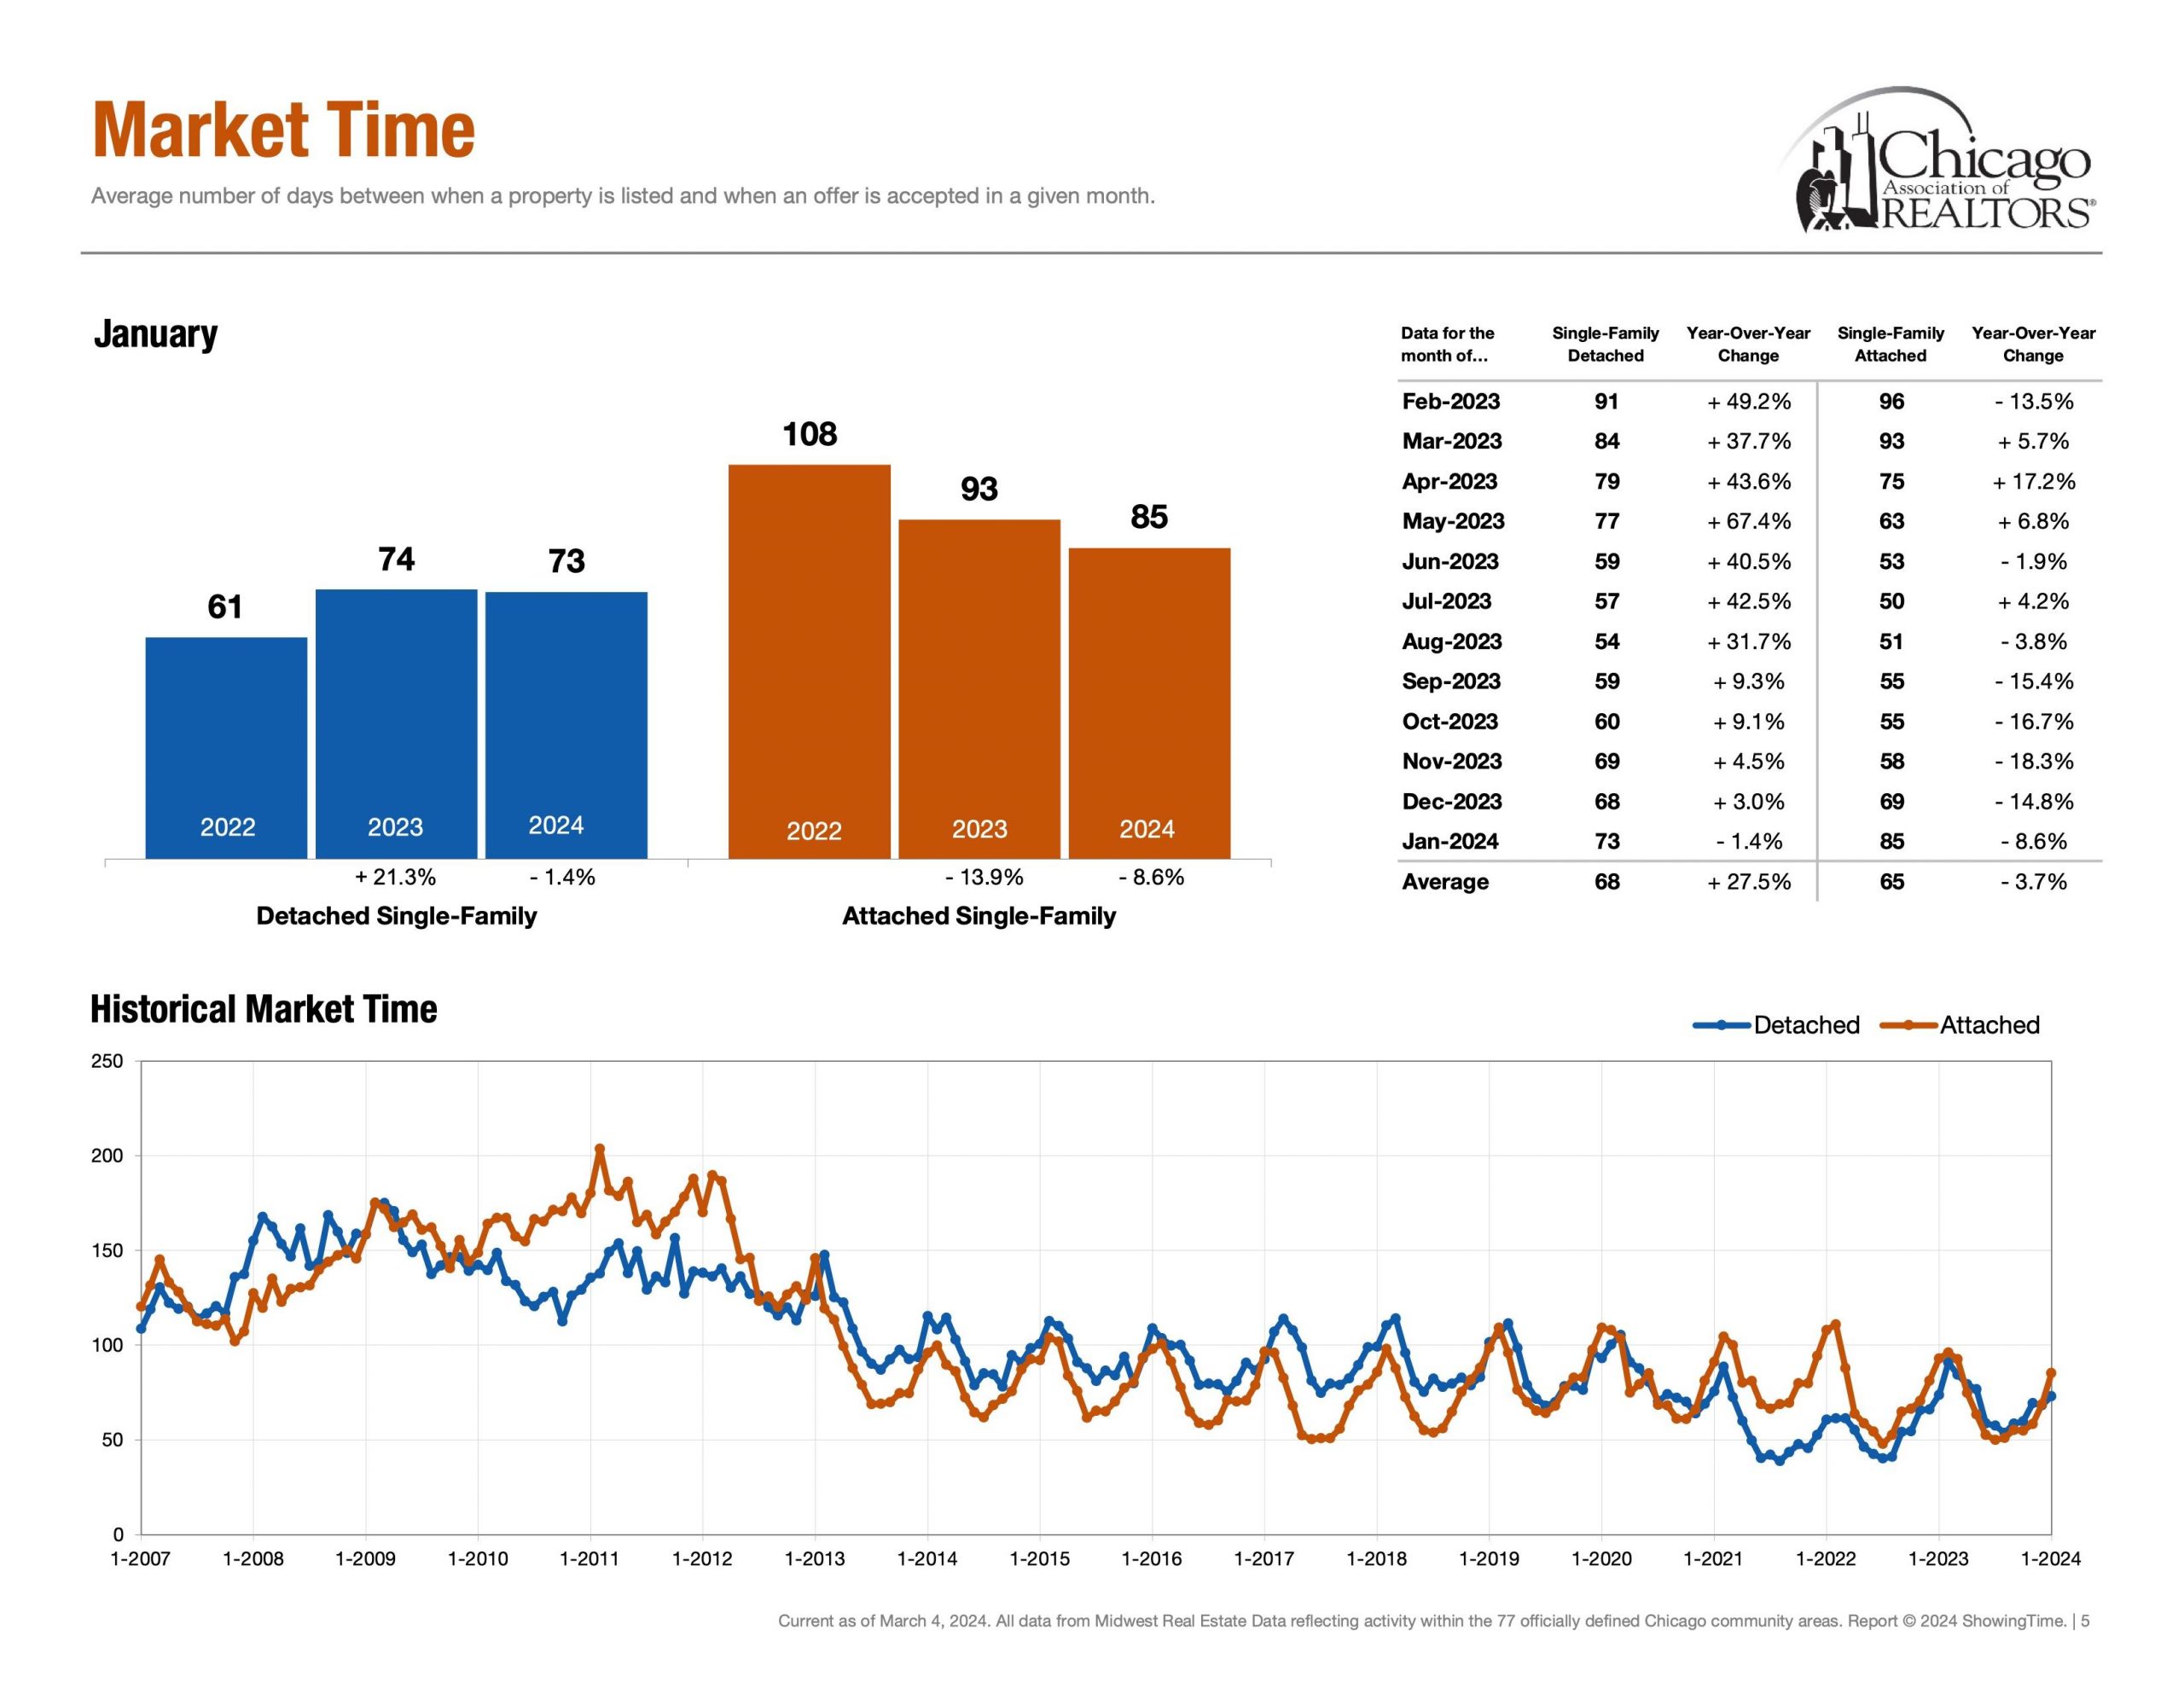
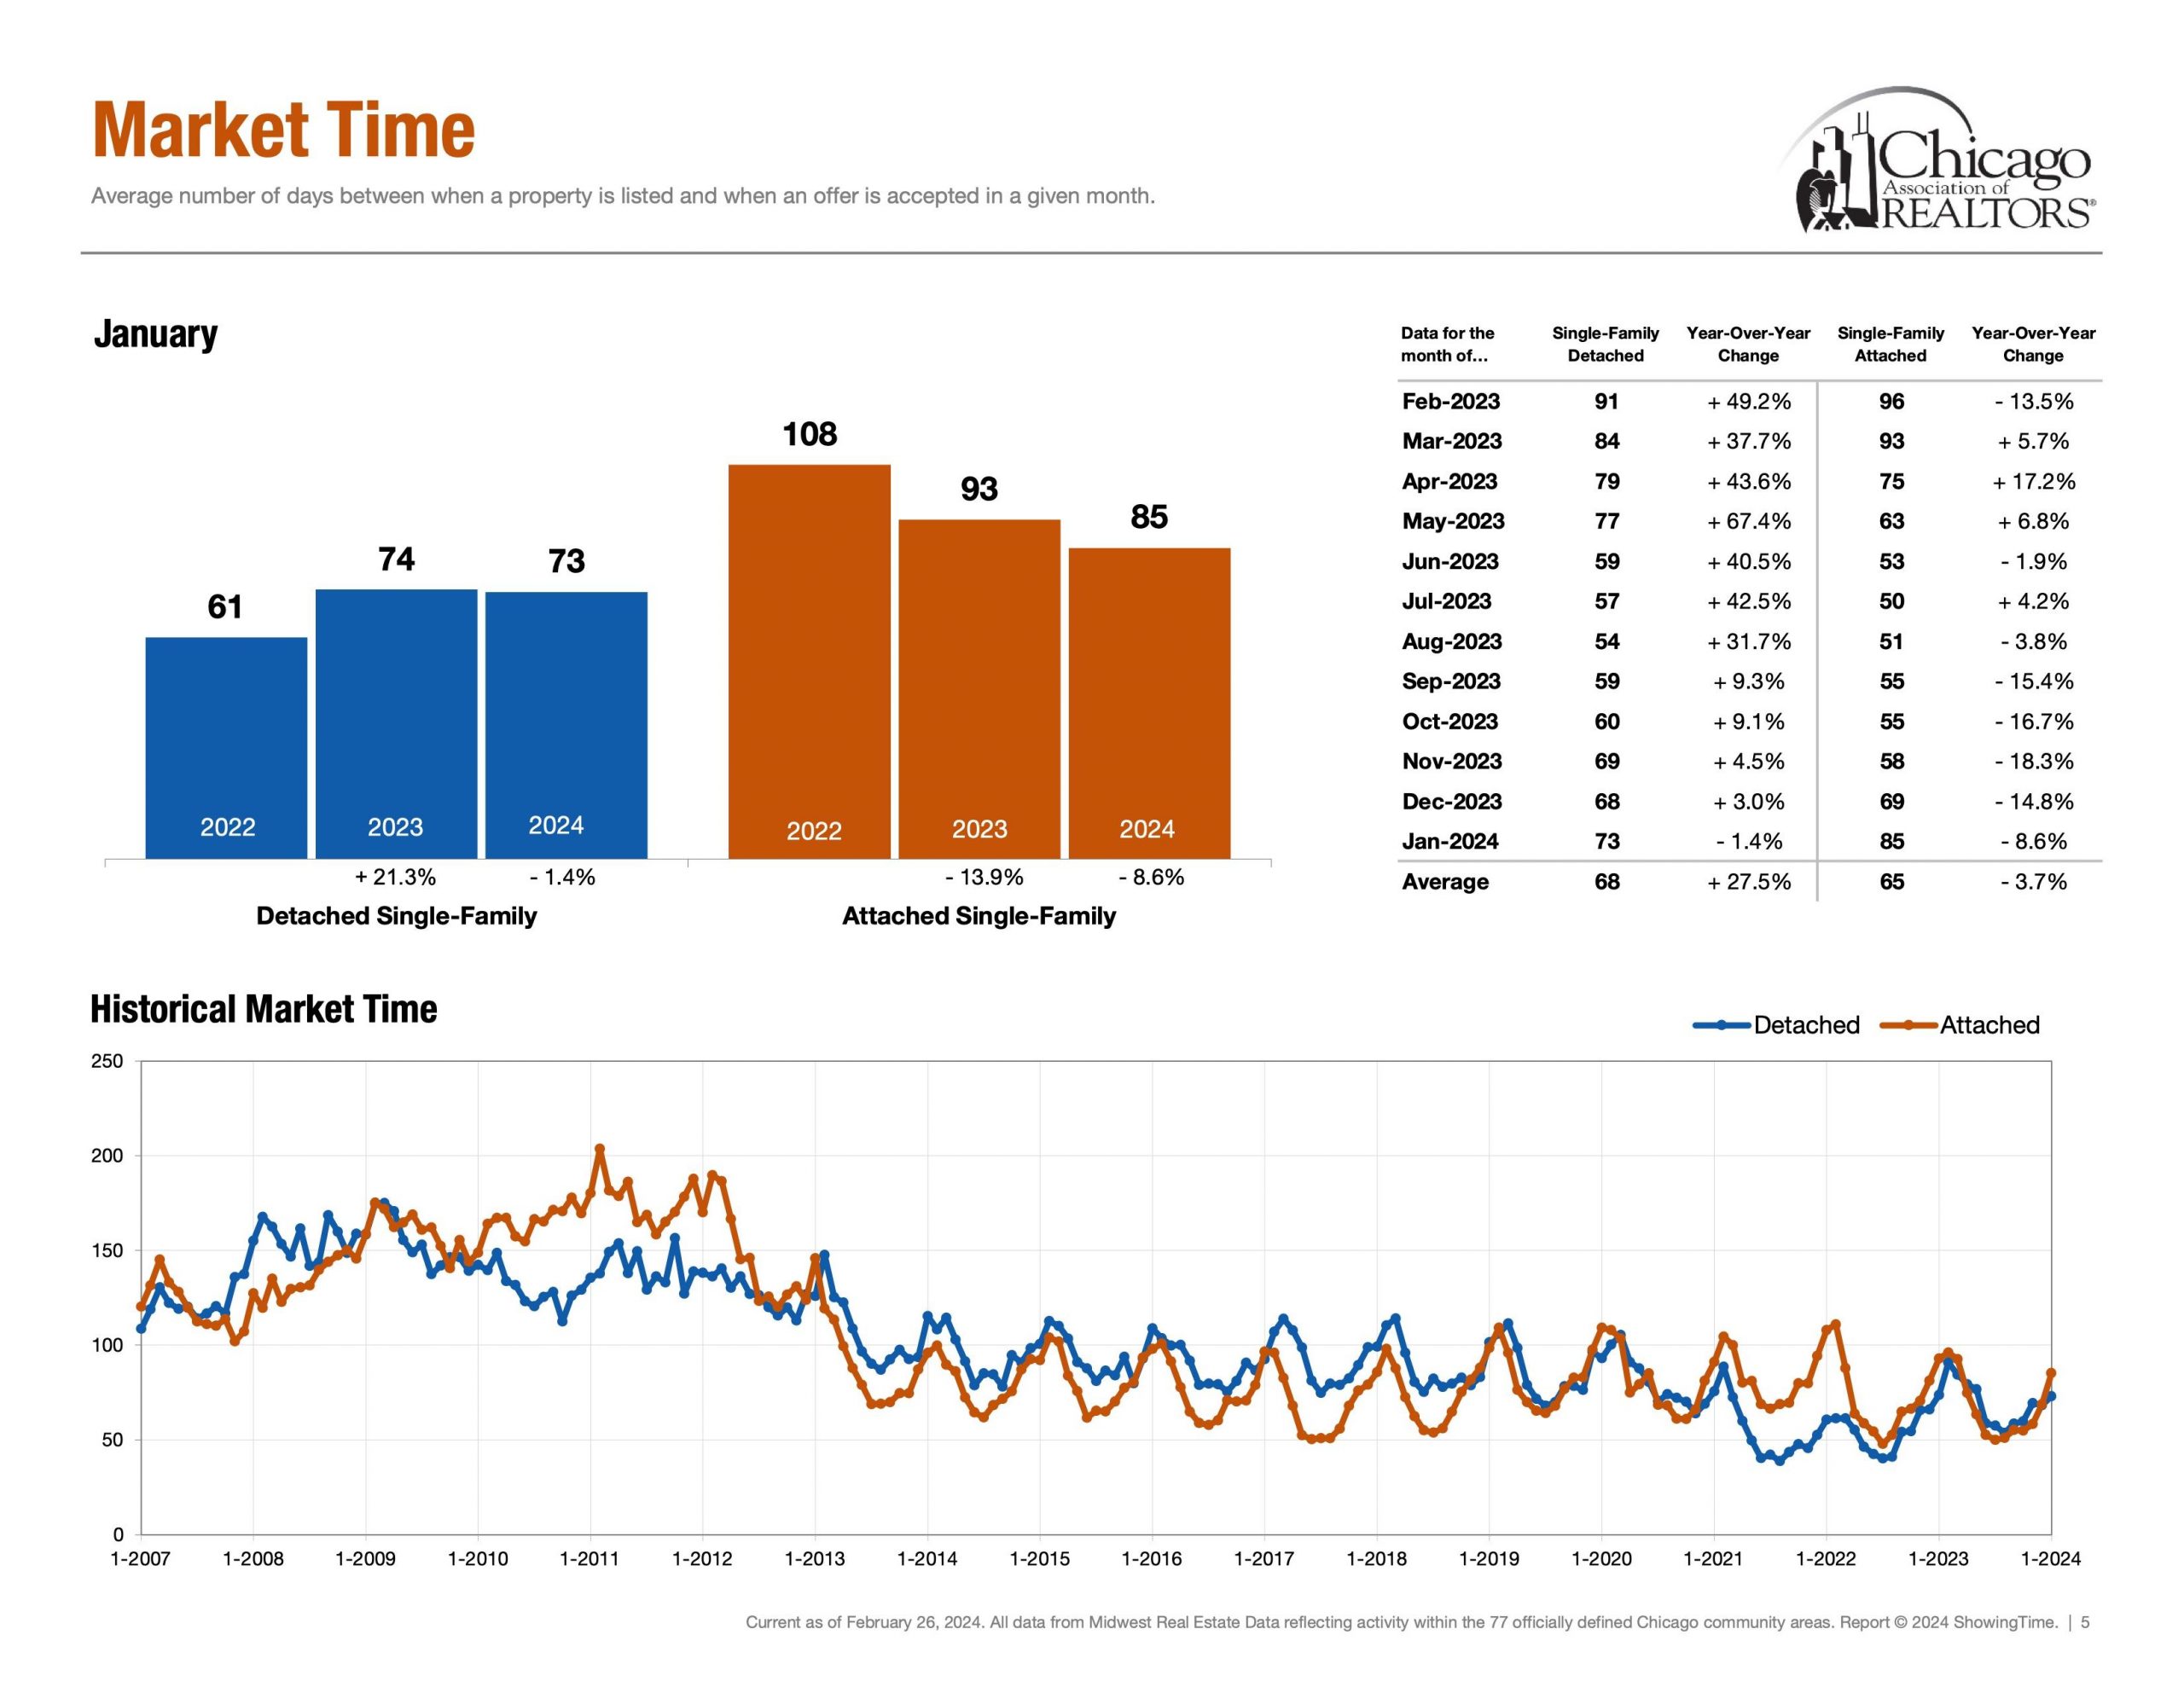
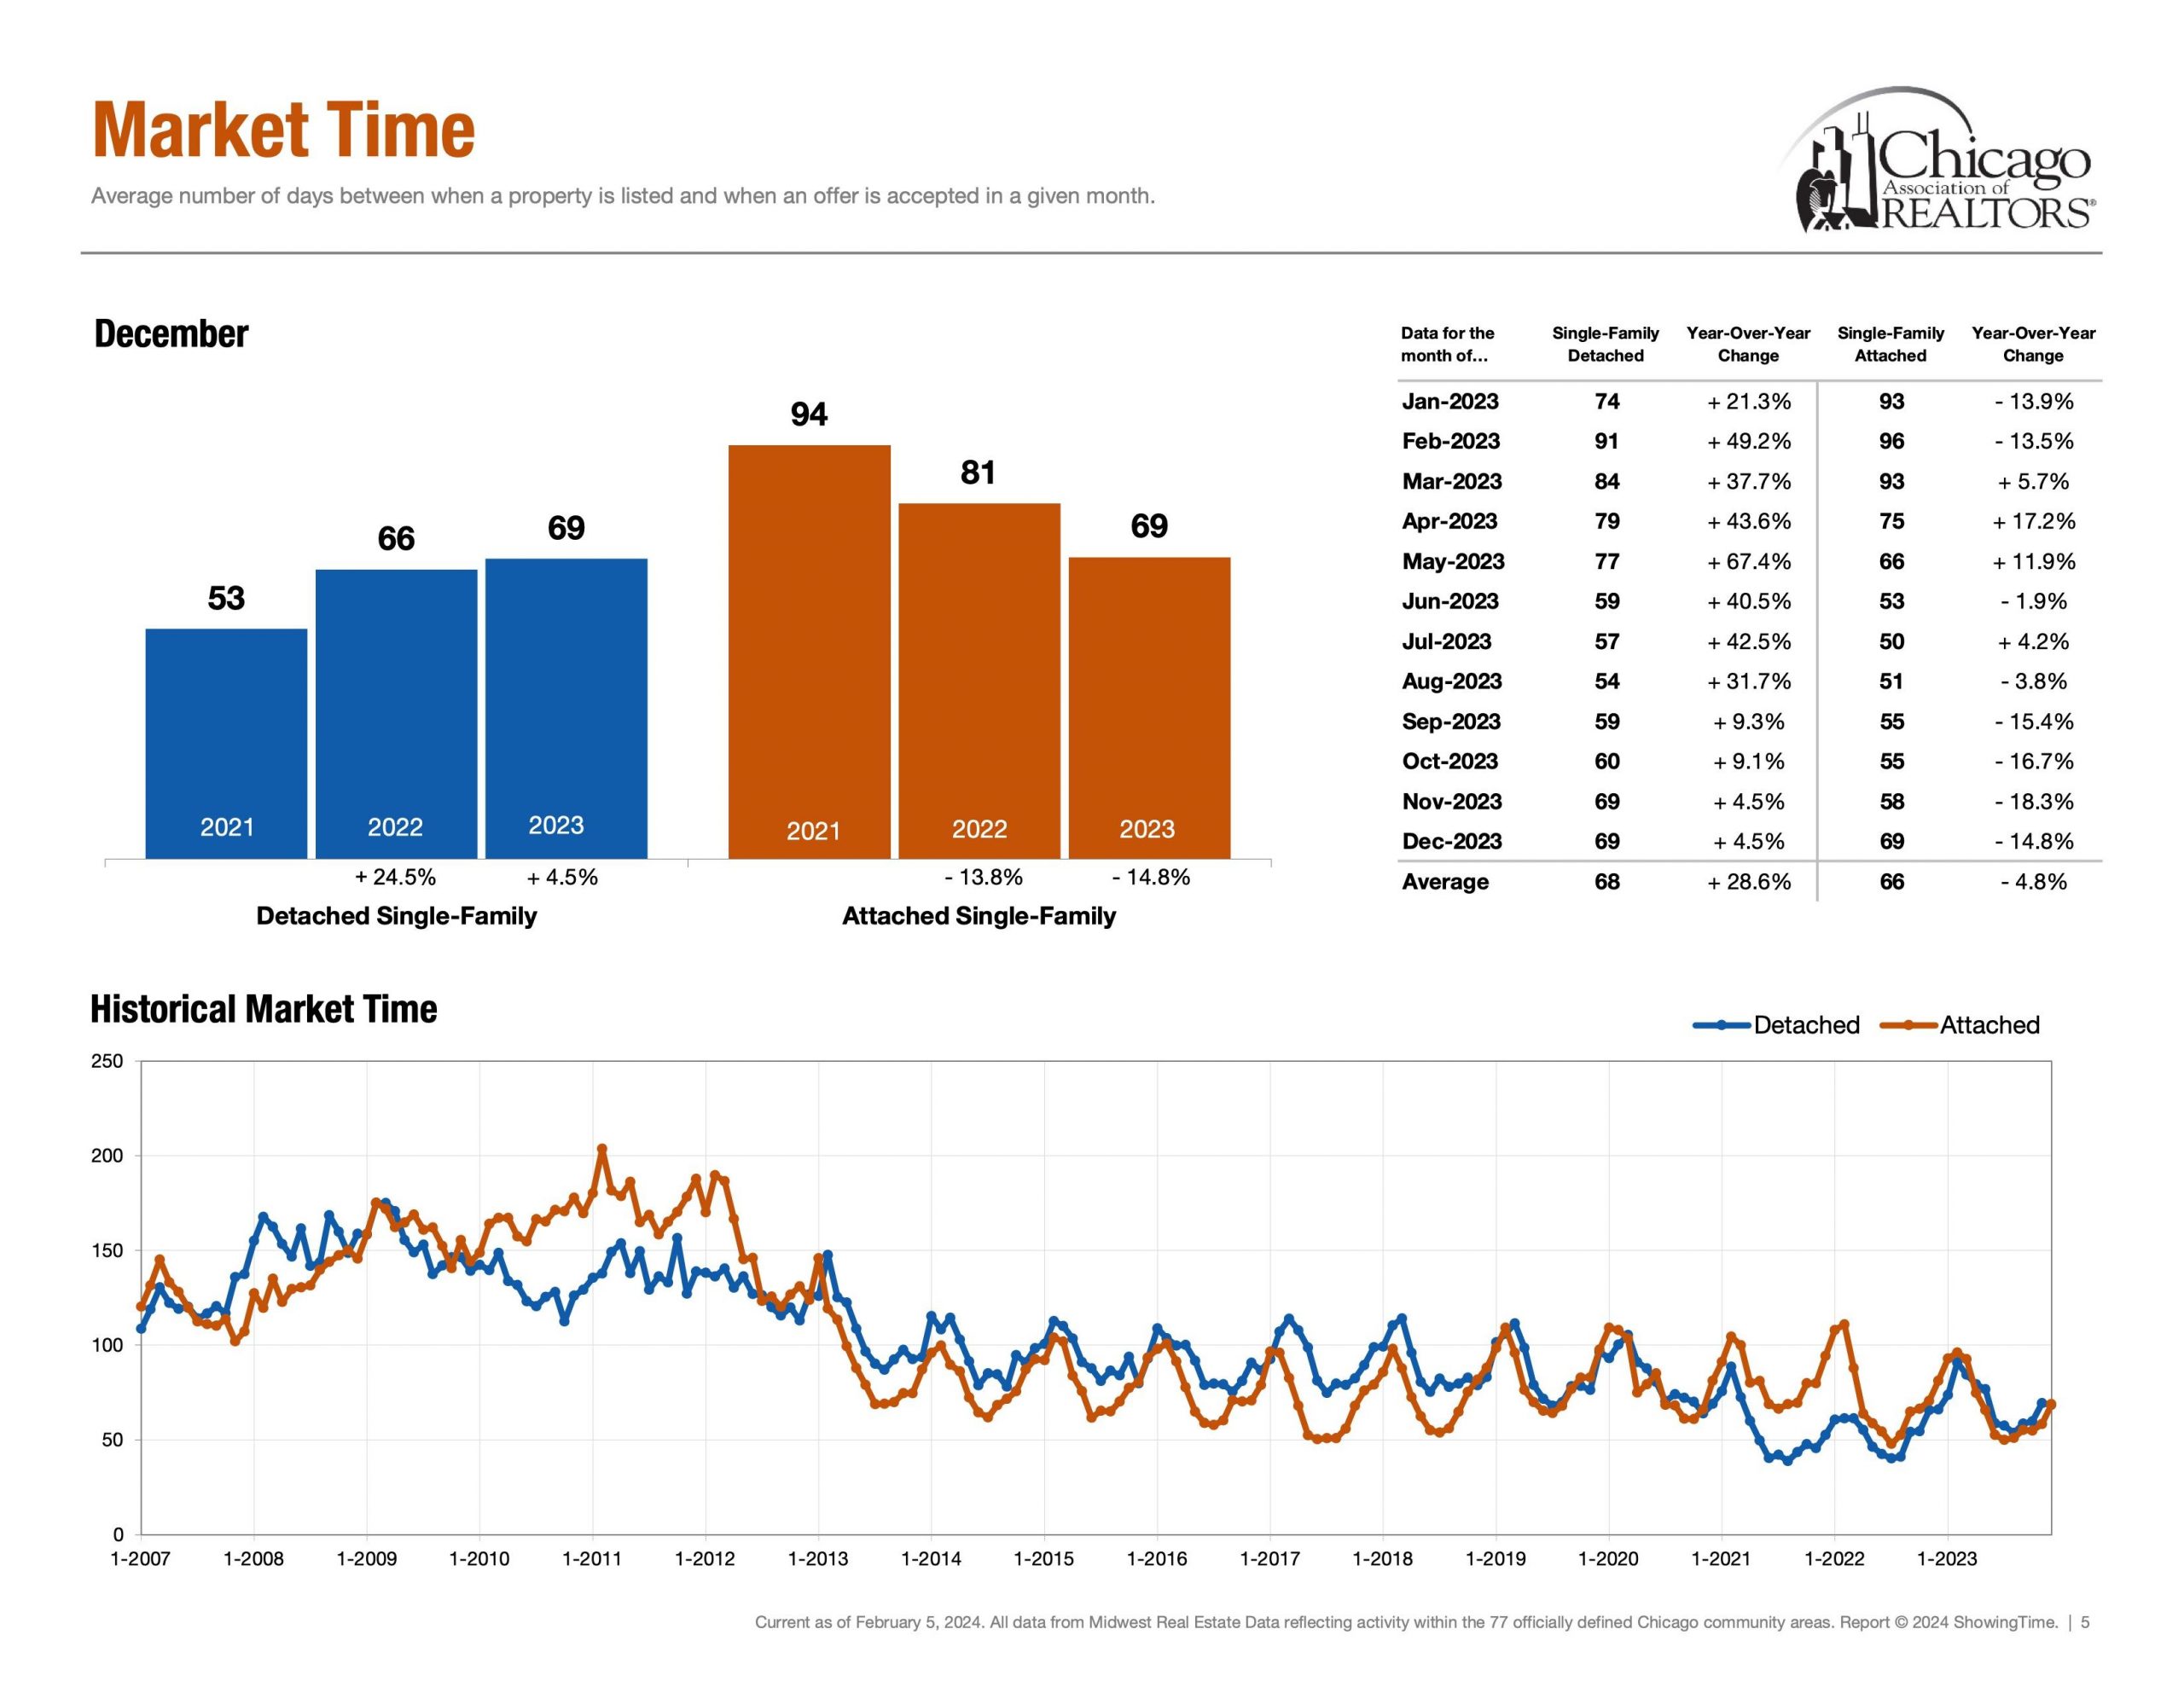
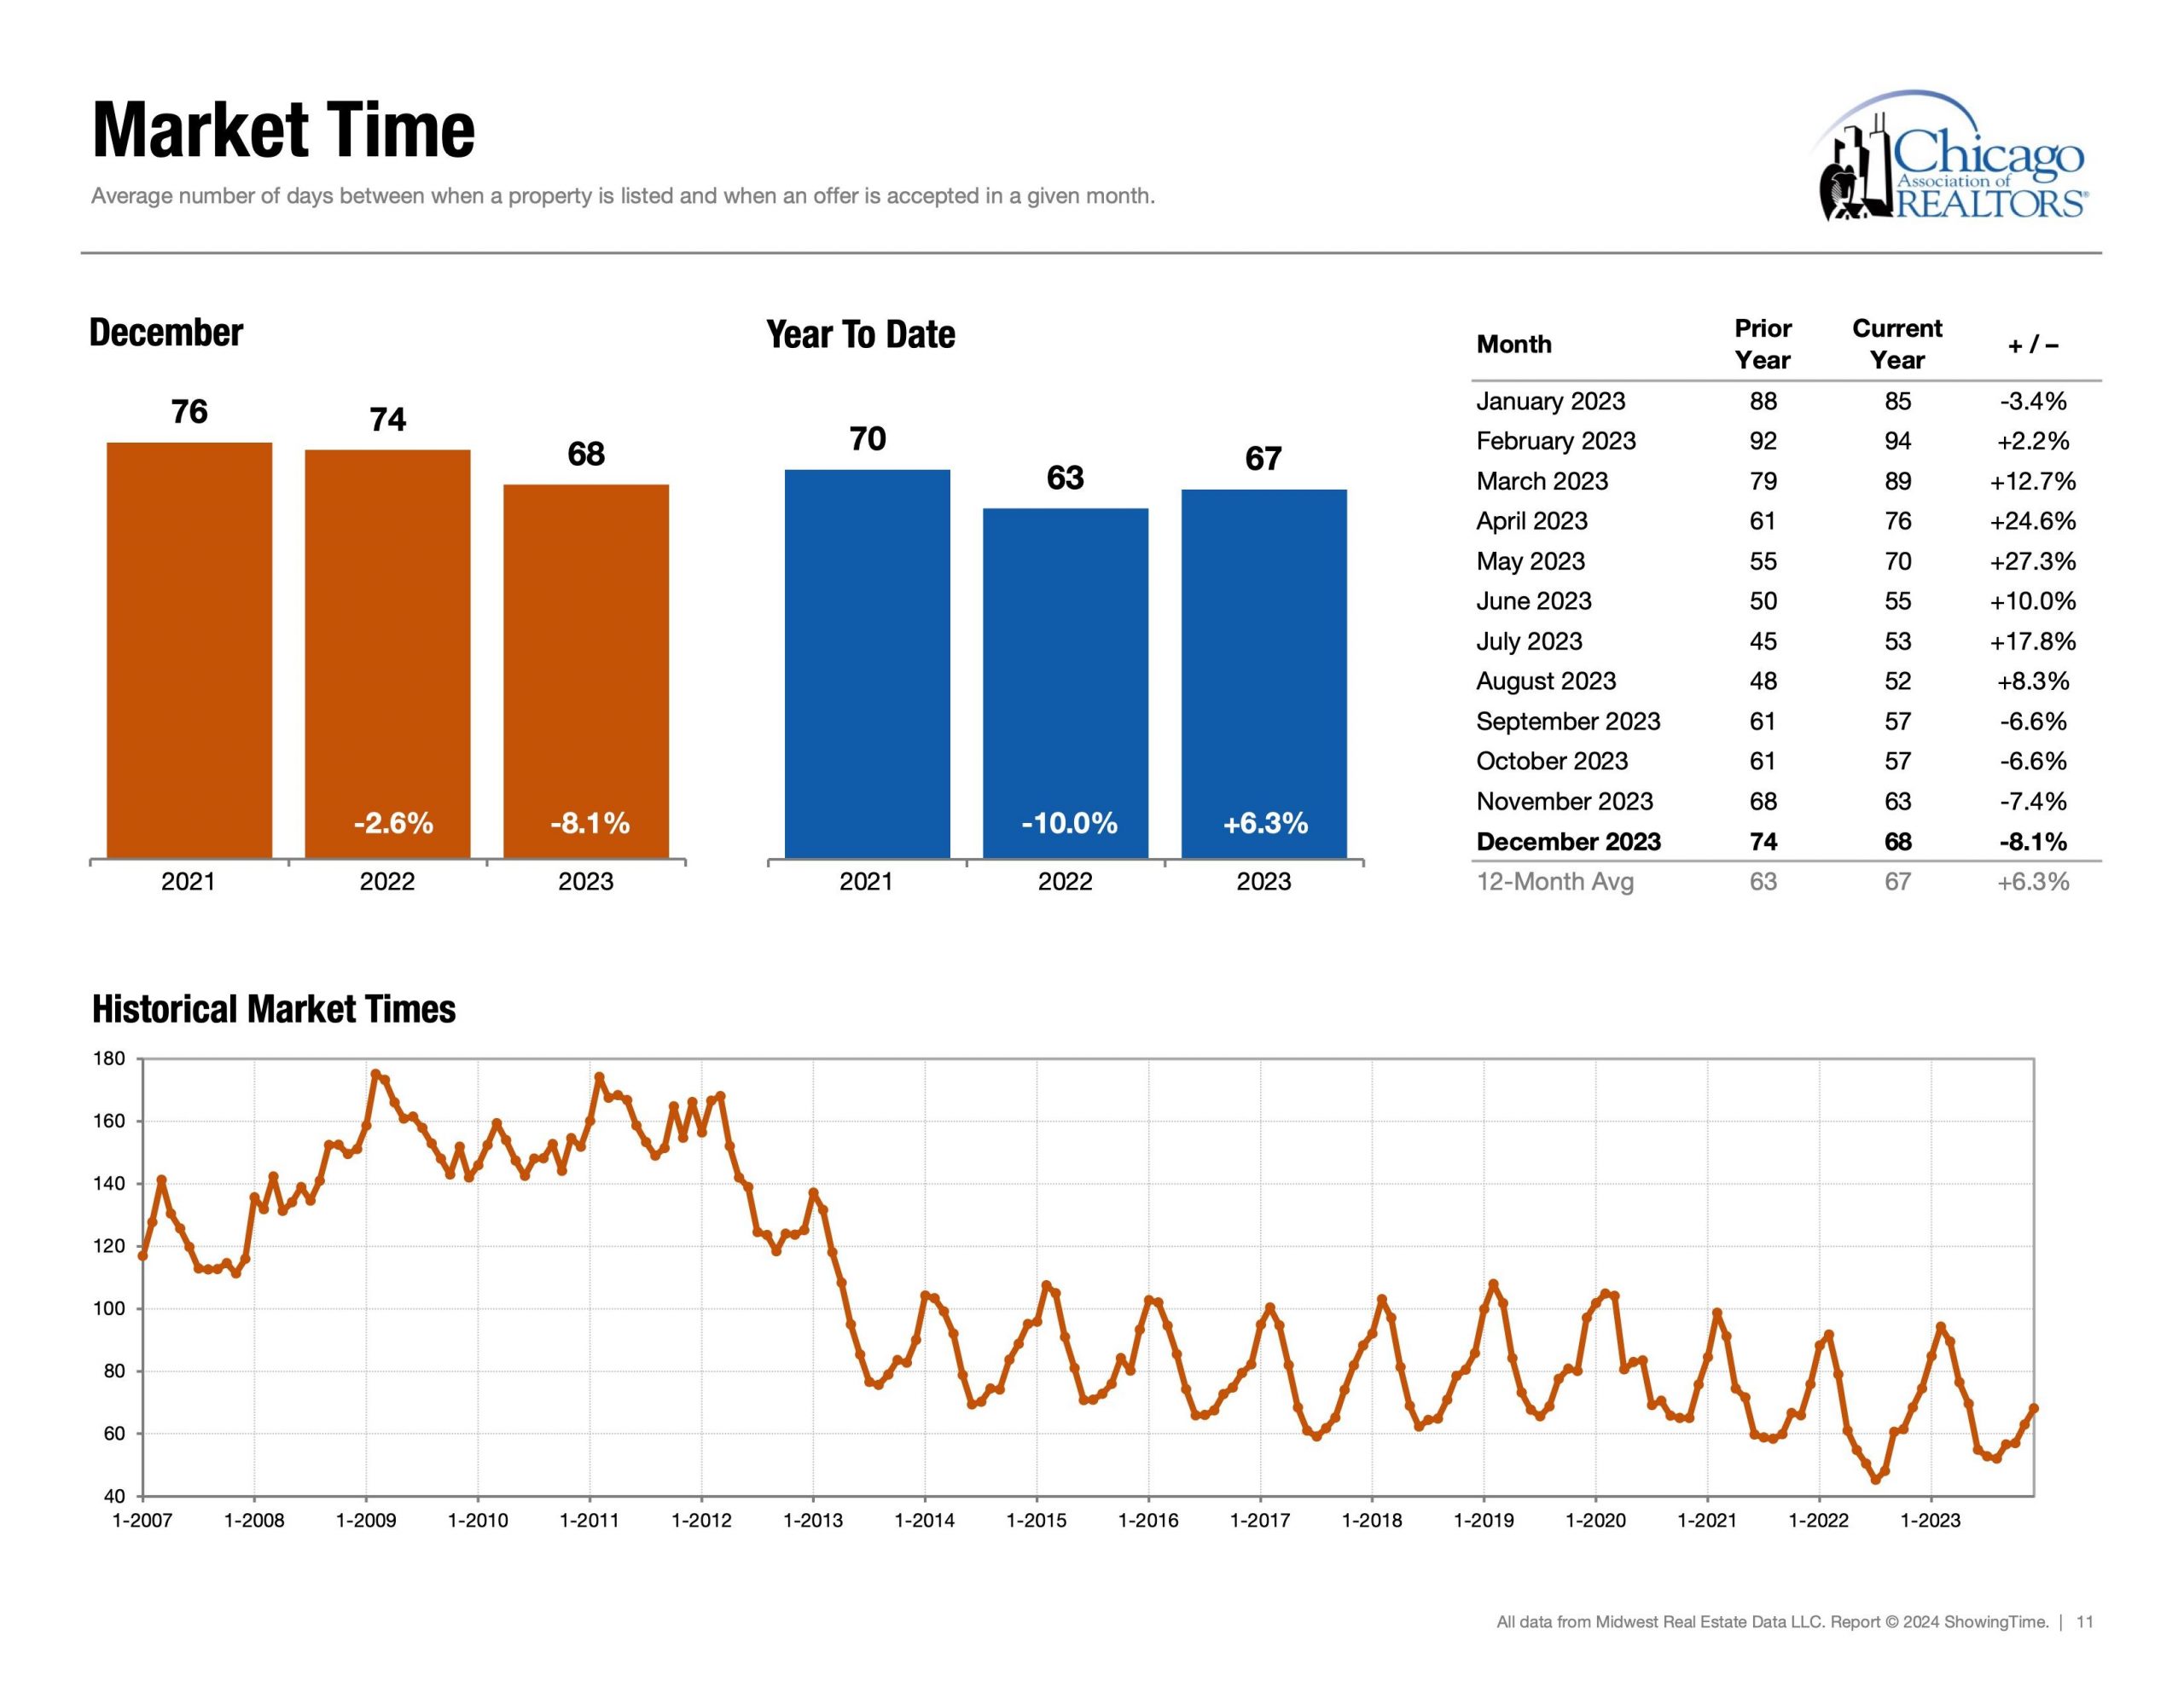
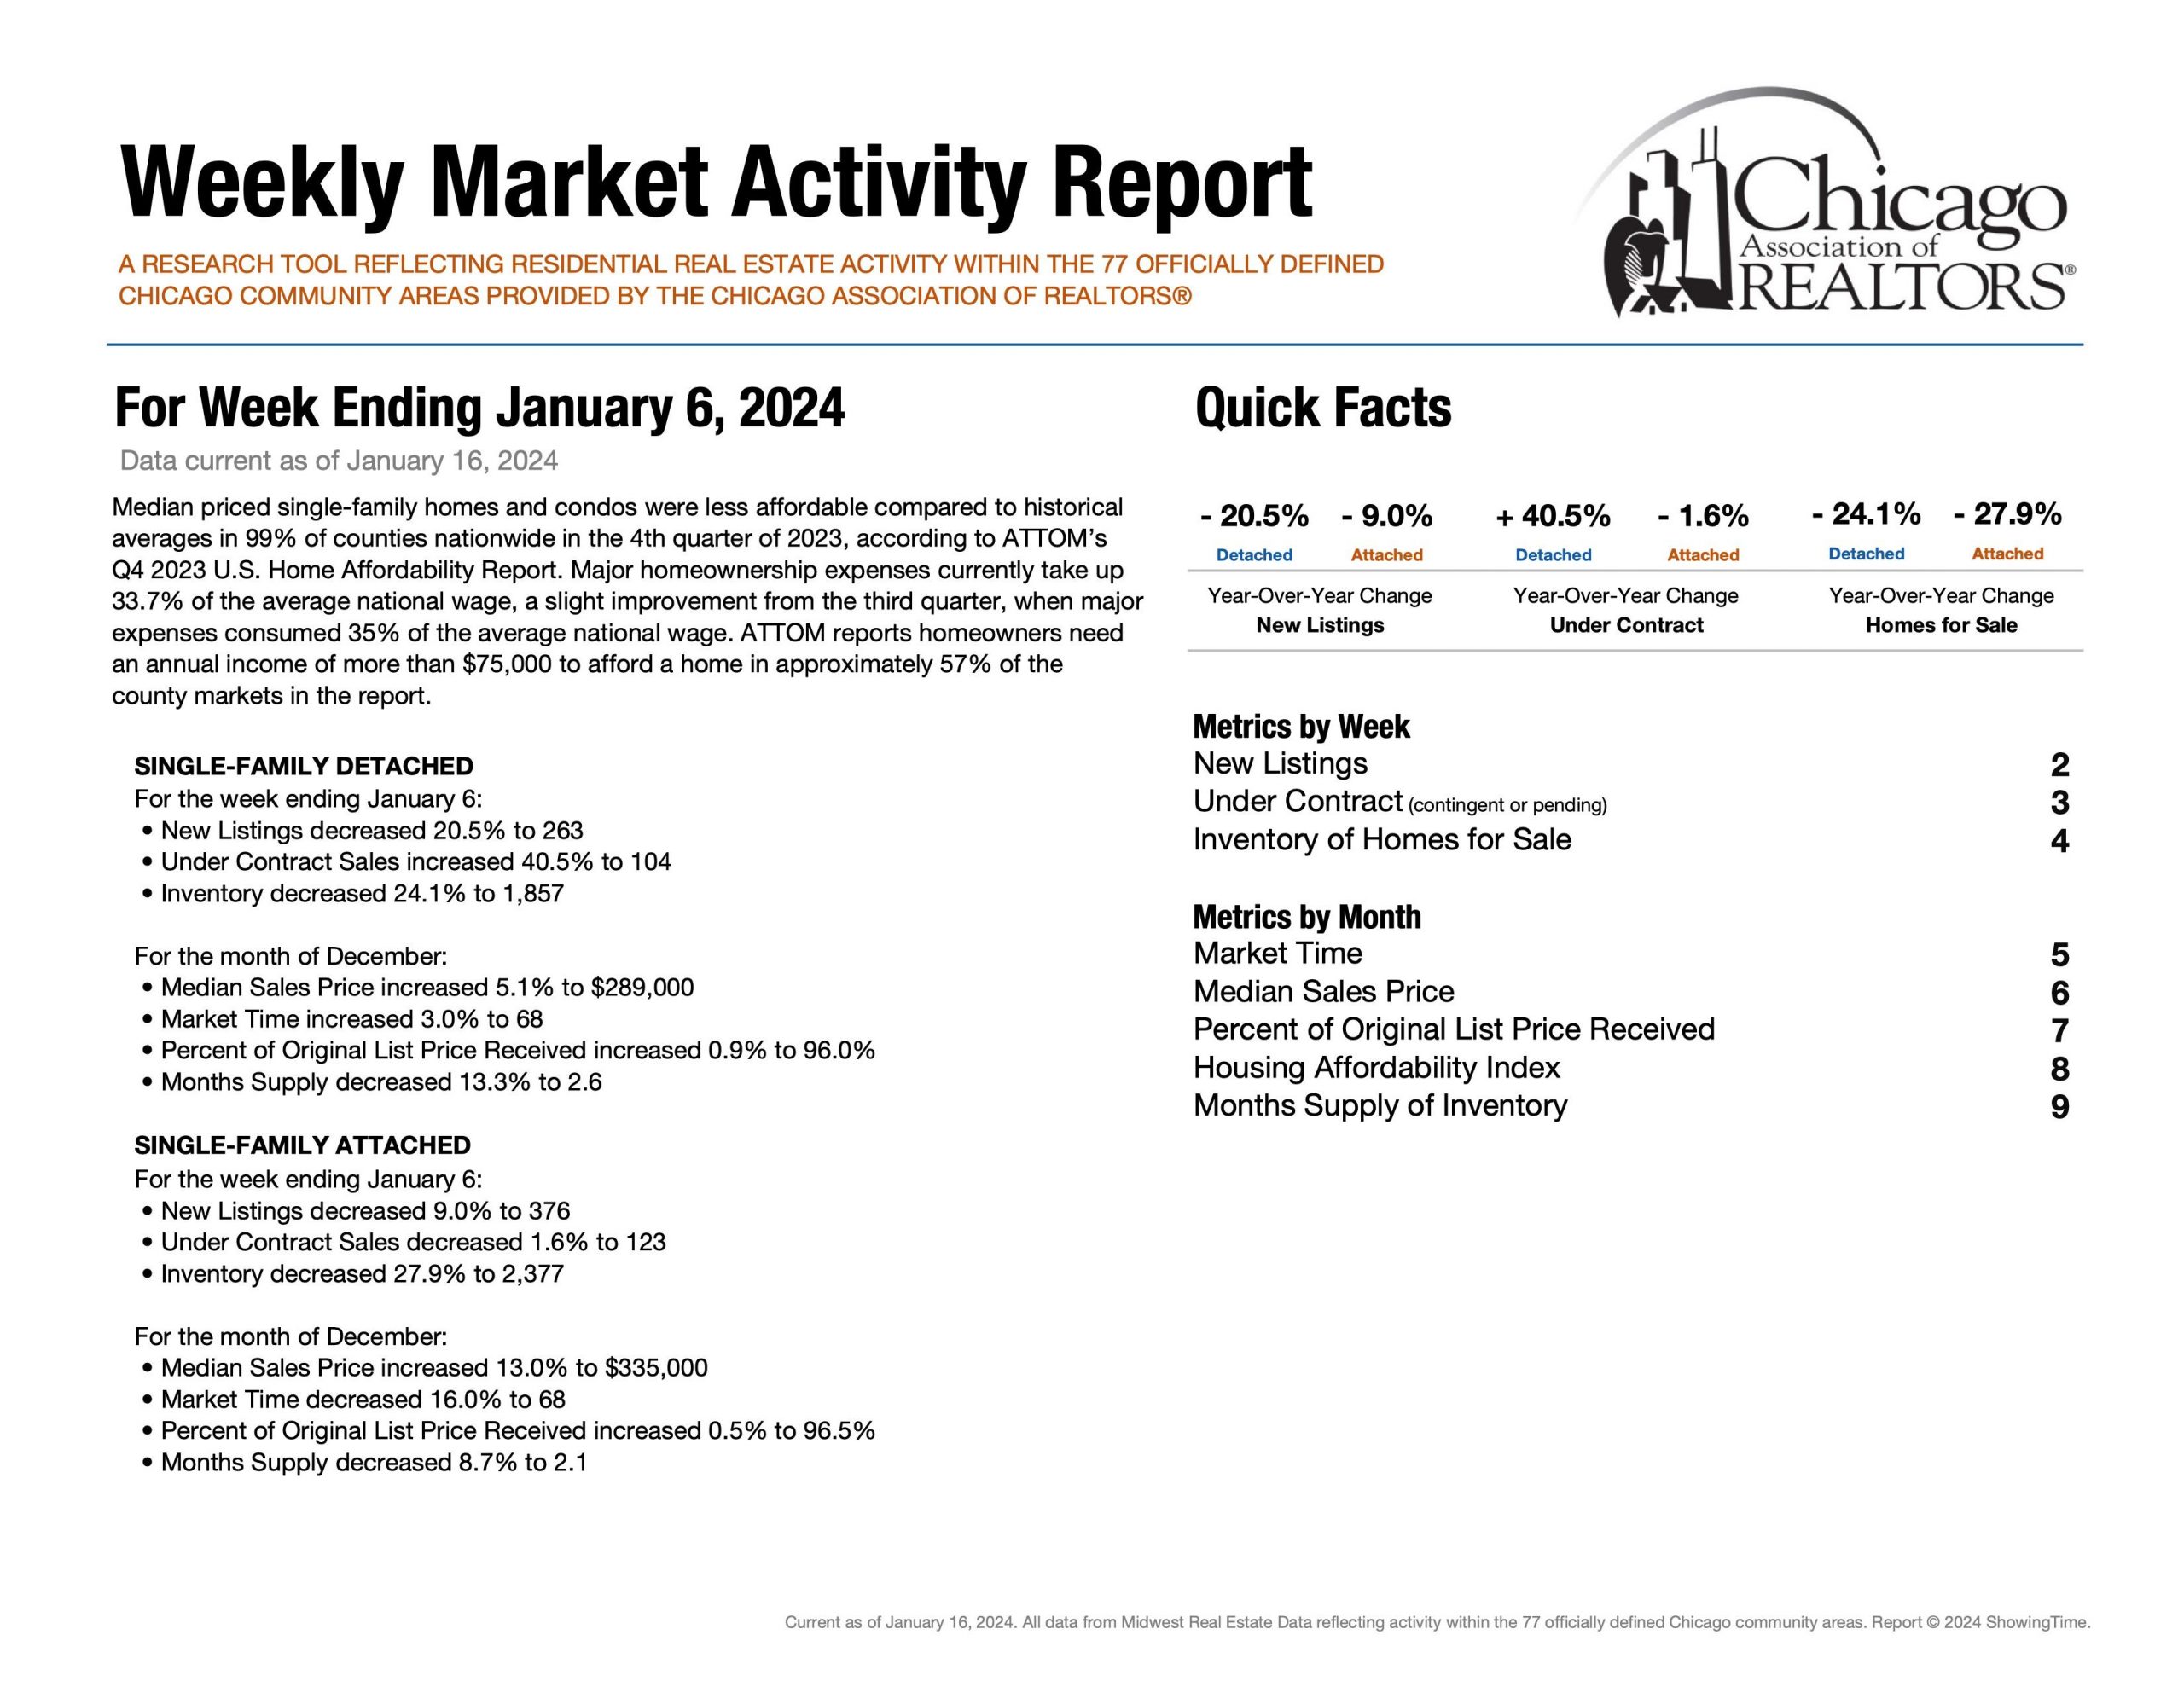
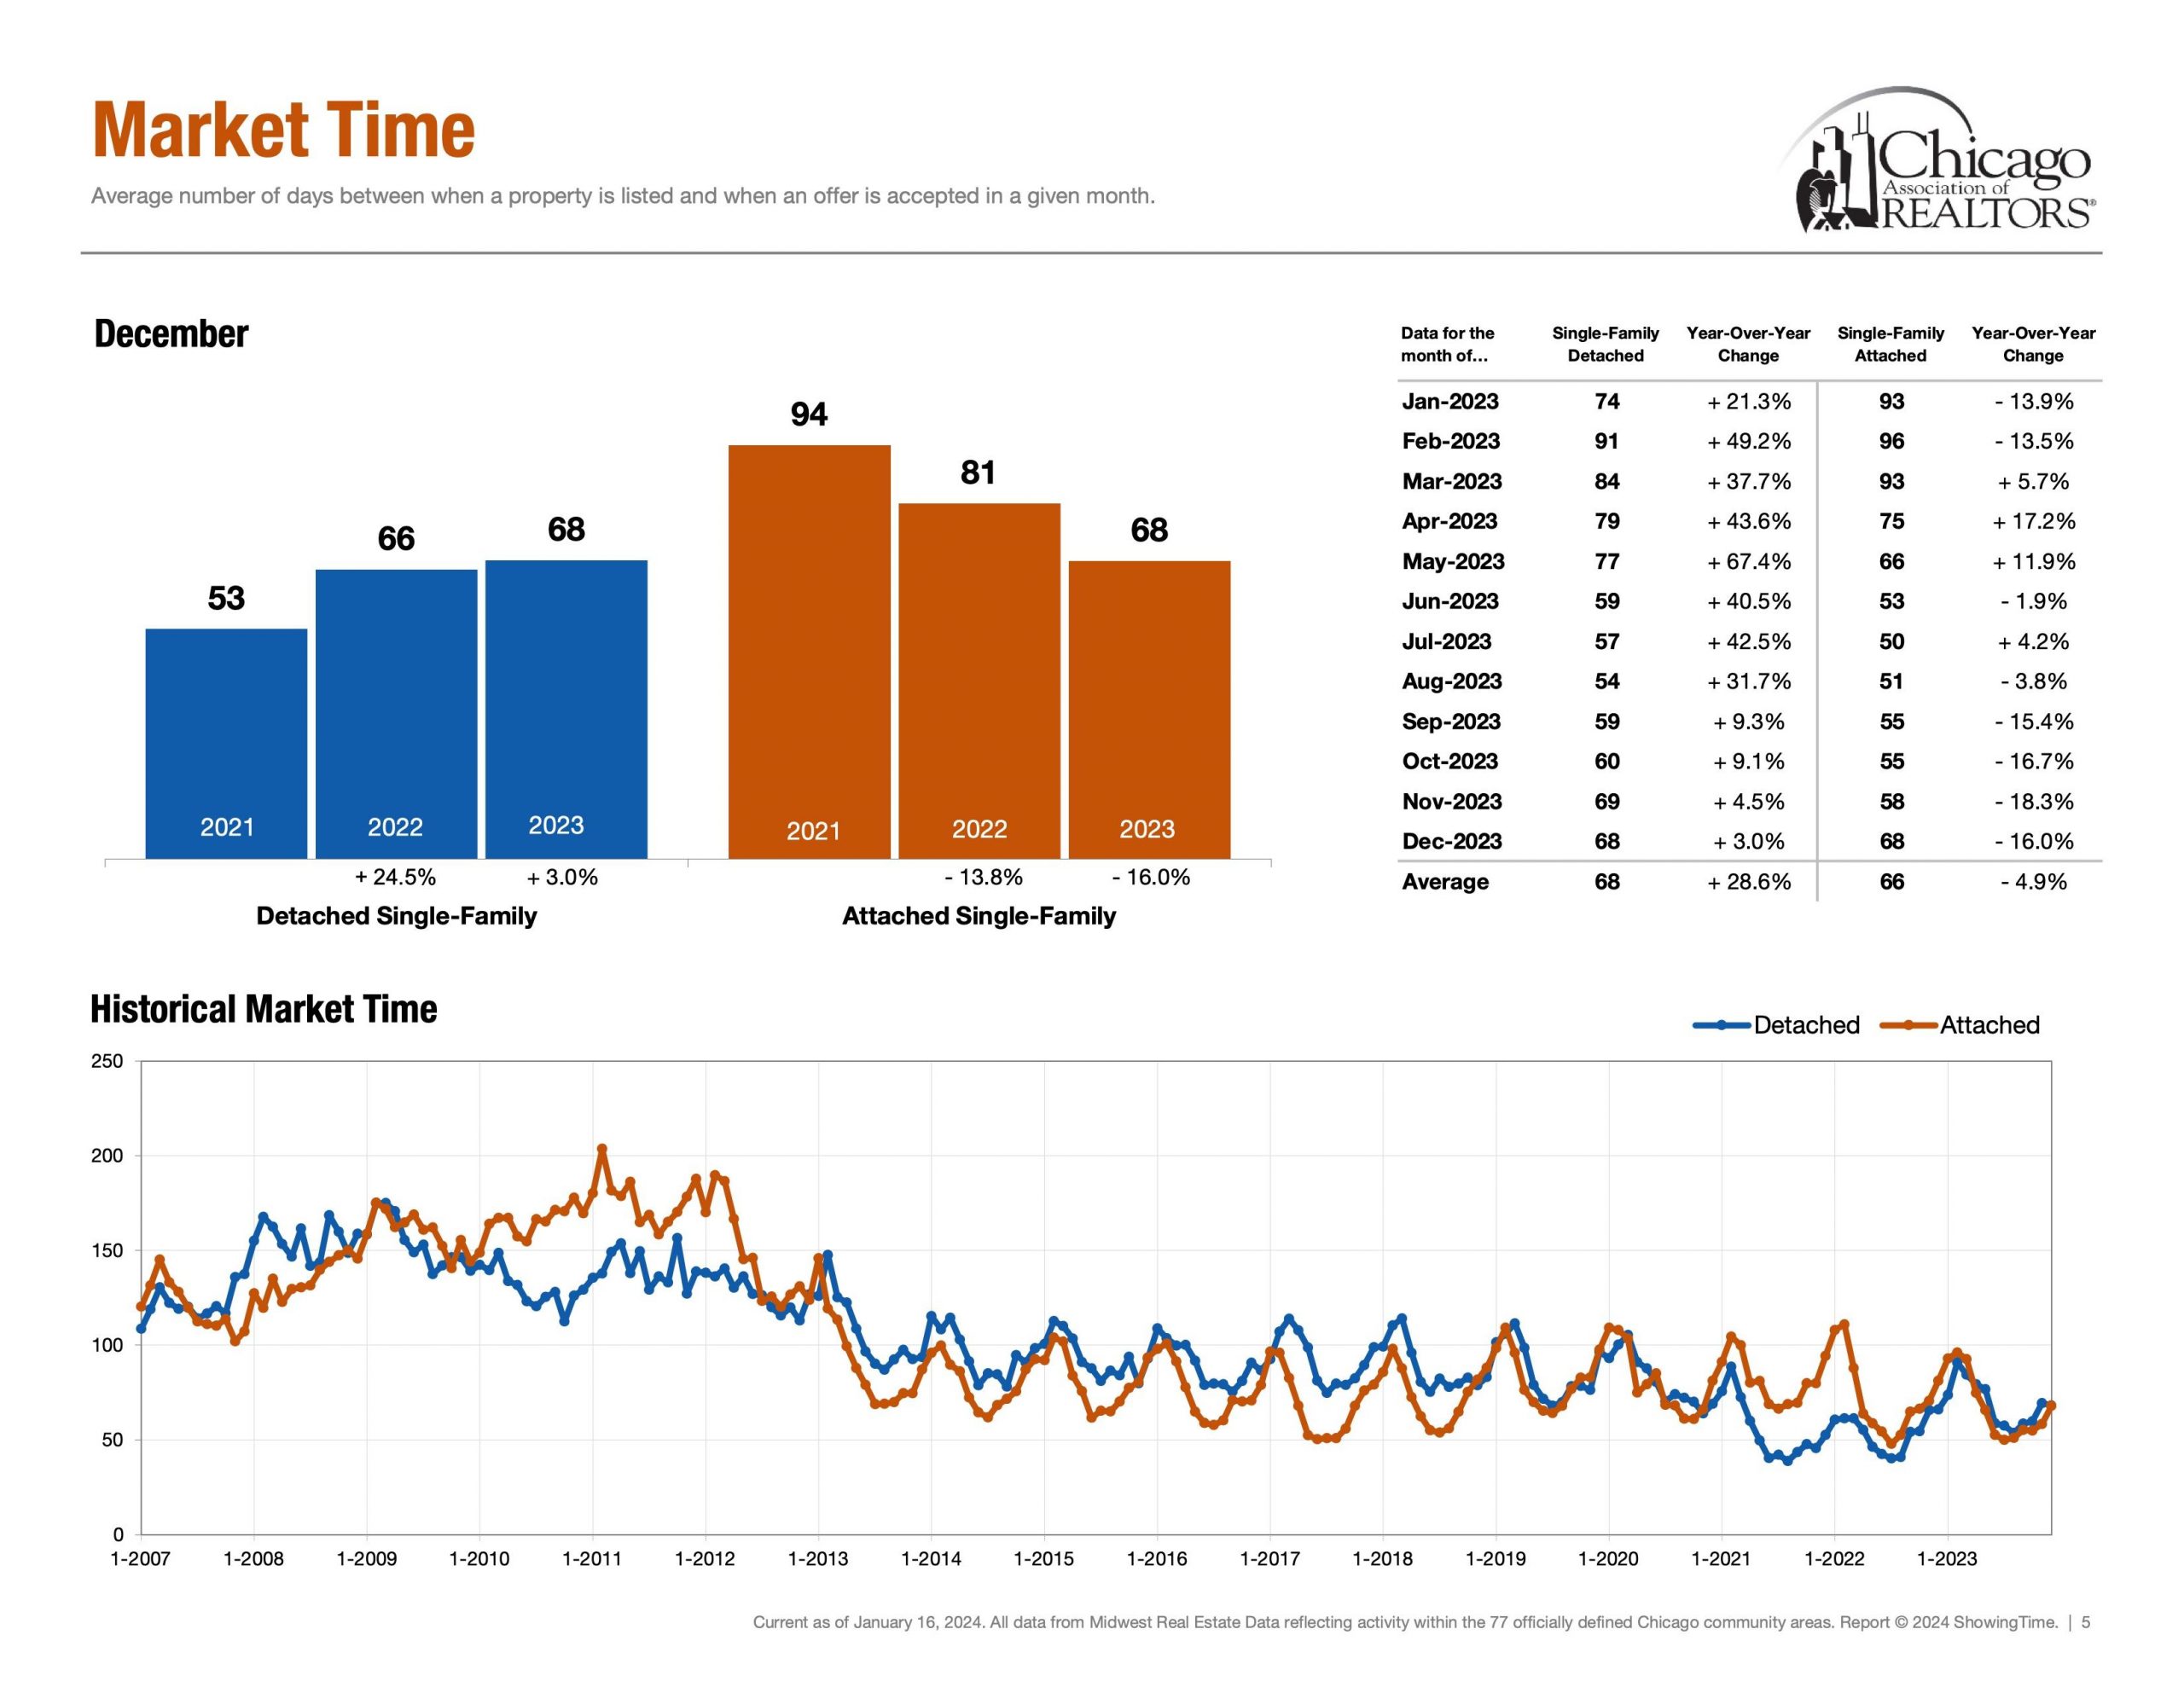
Speed | Healthy Market Time Range
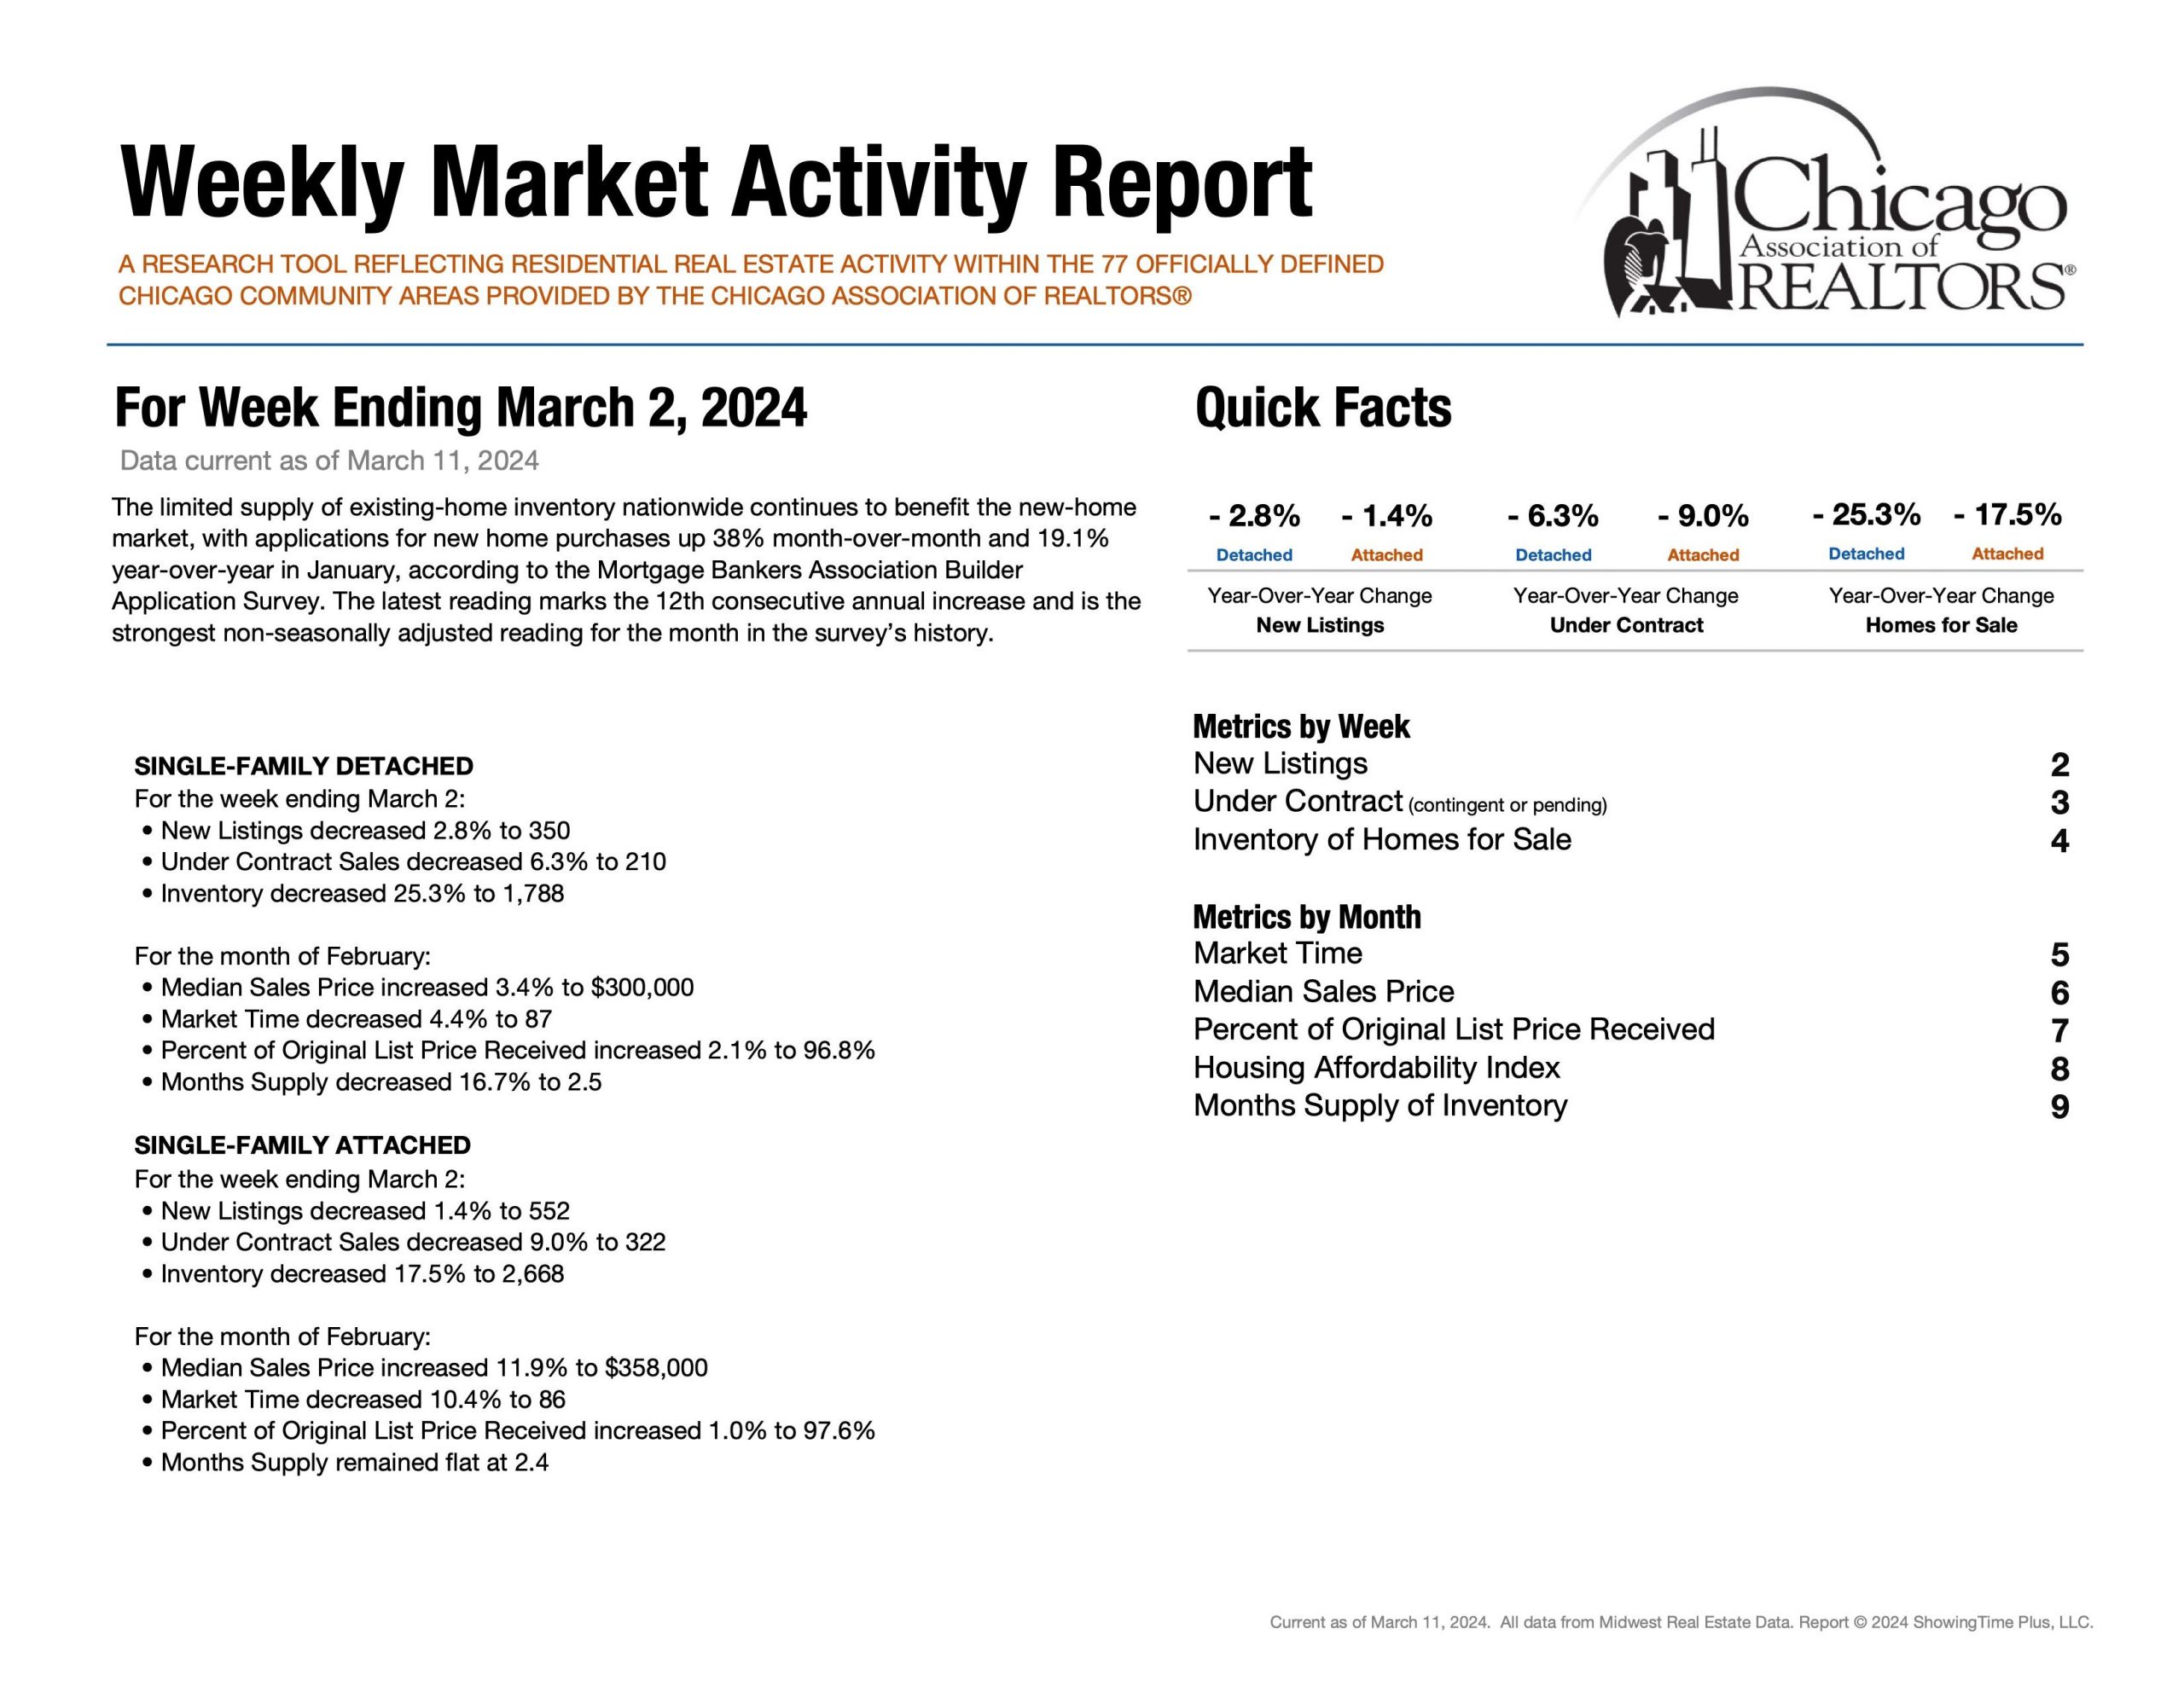
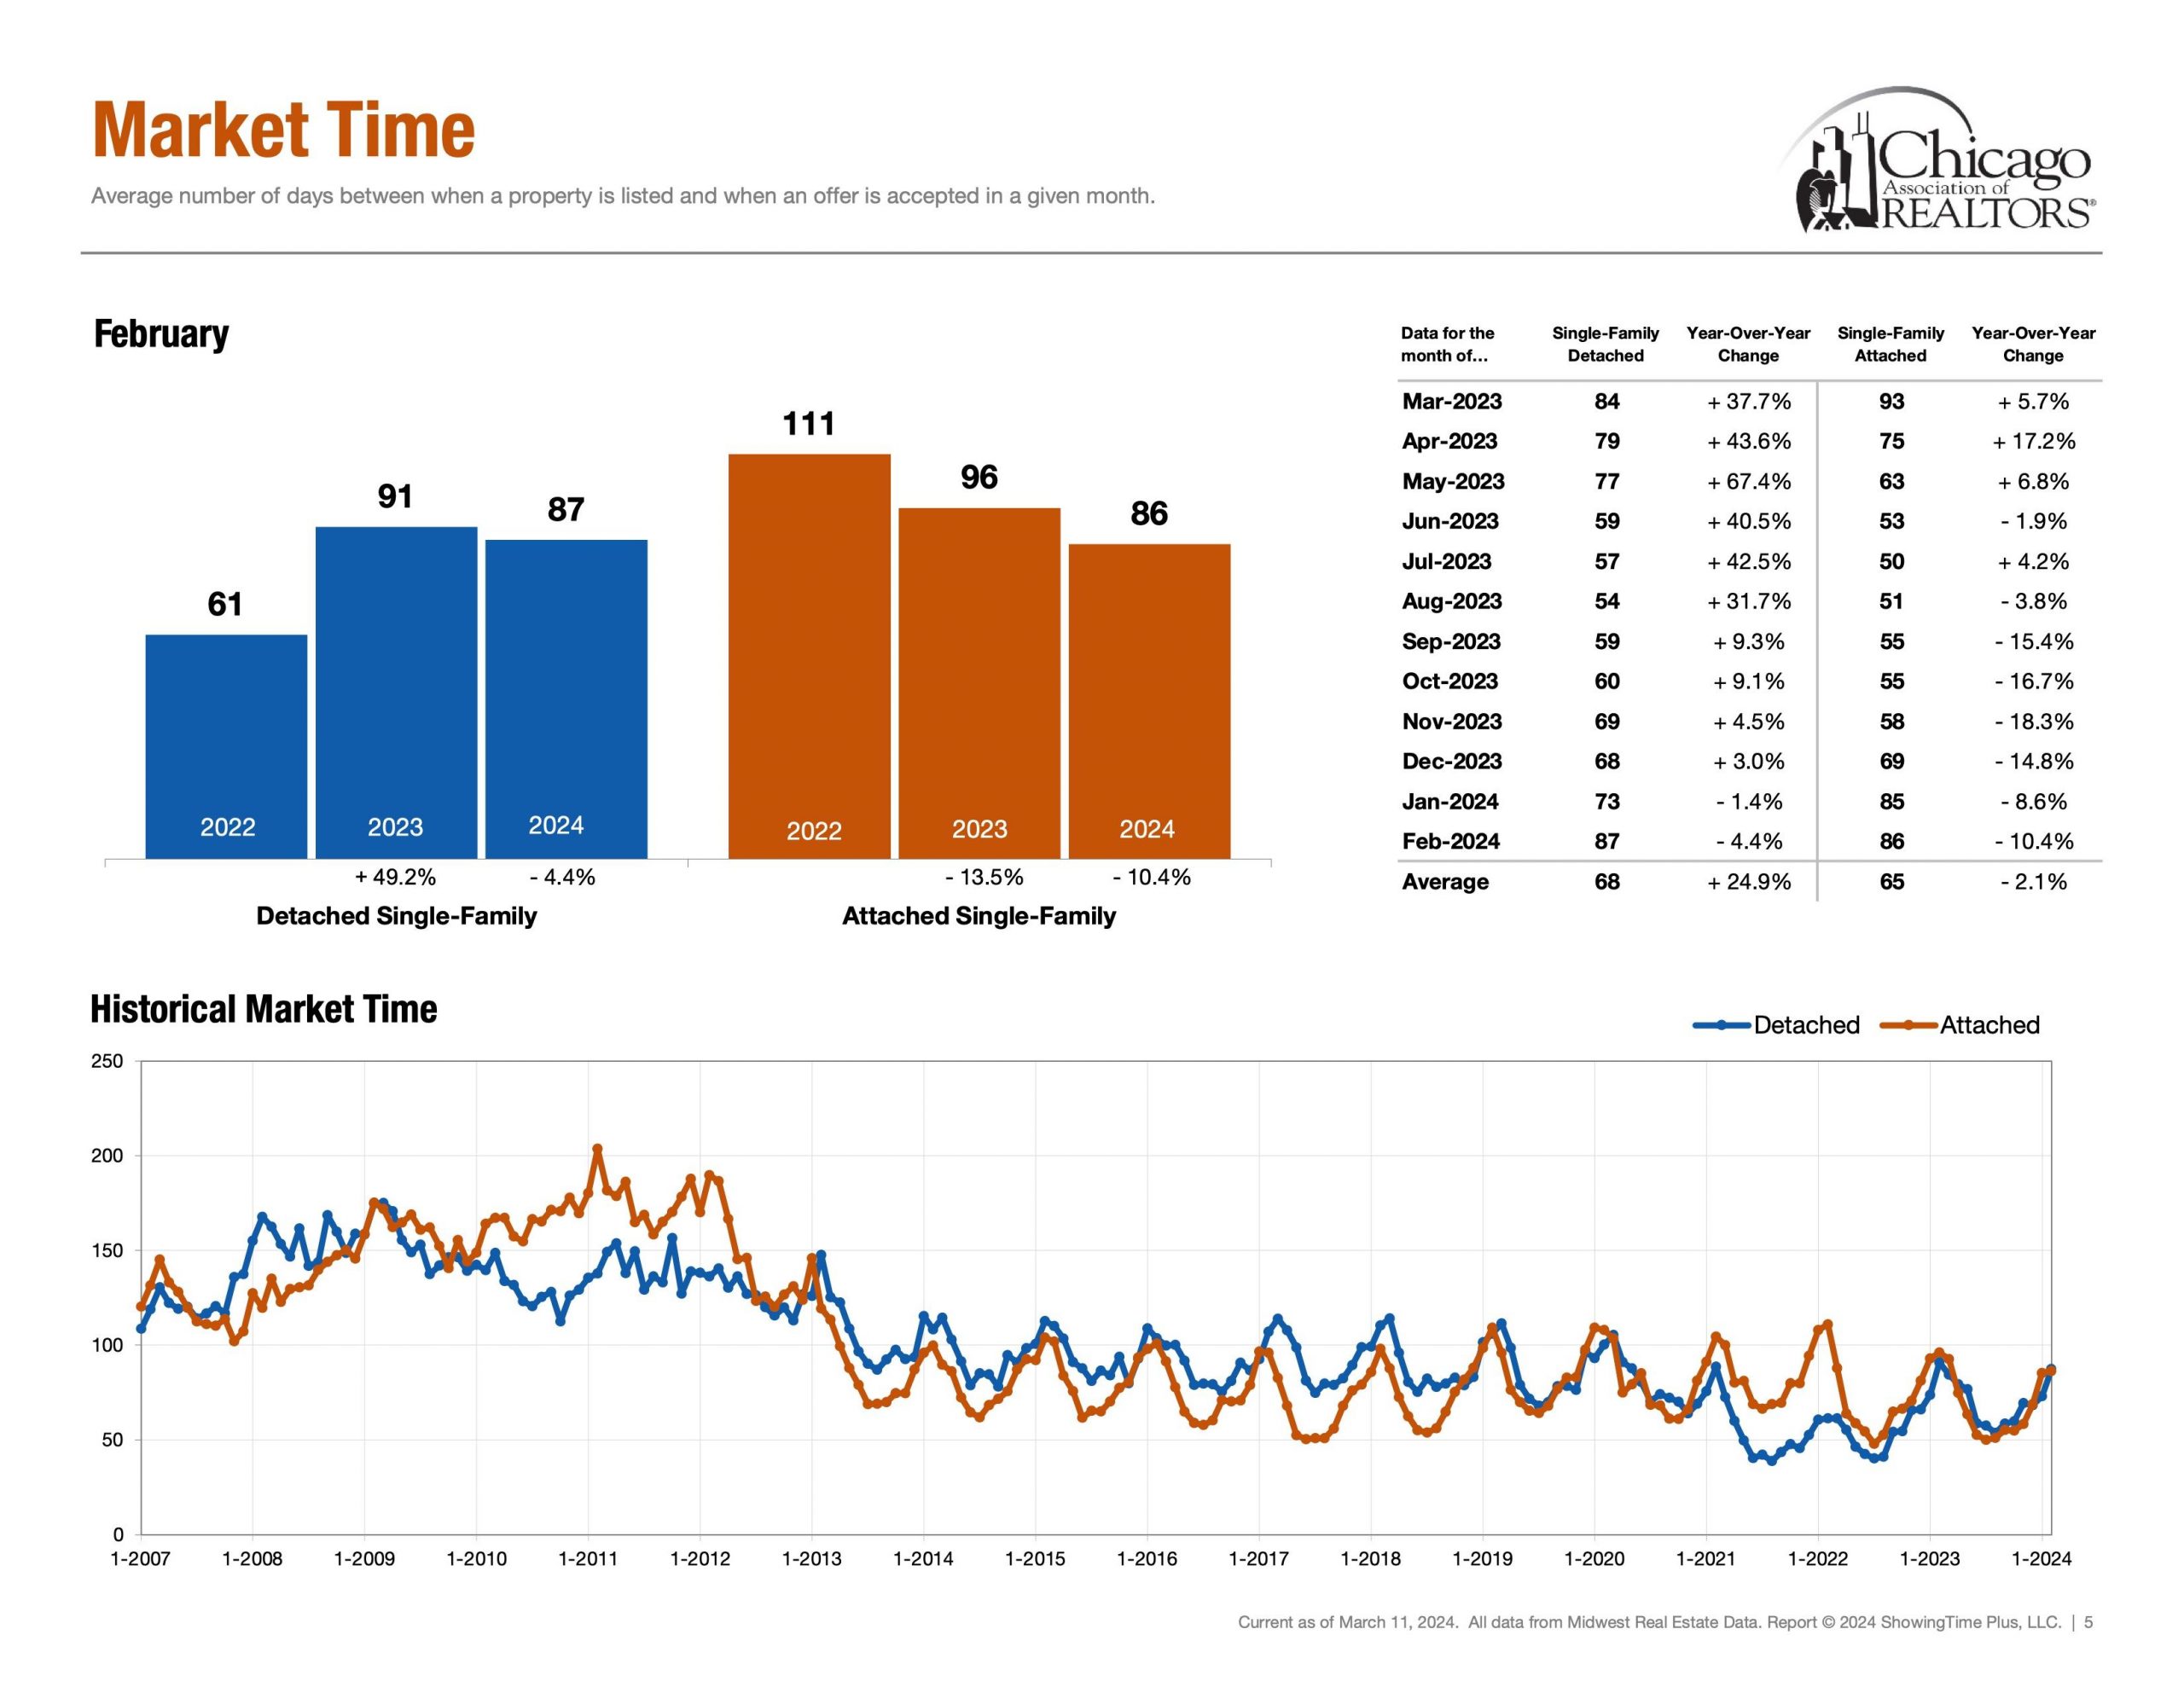
Detached Single ~ 87 Days (Feb 24′)
Attached Single ~ 86 Days (Feb 24′)
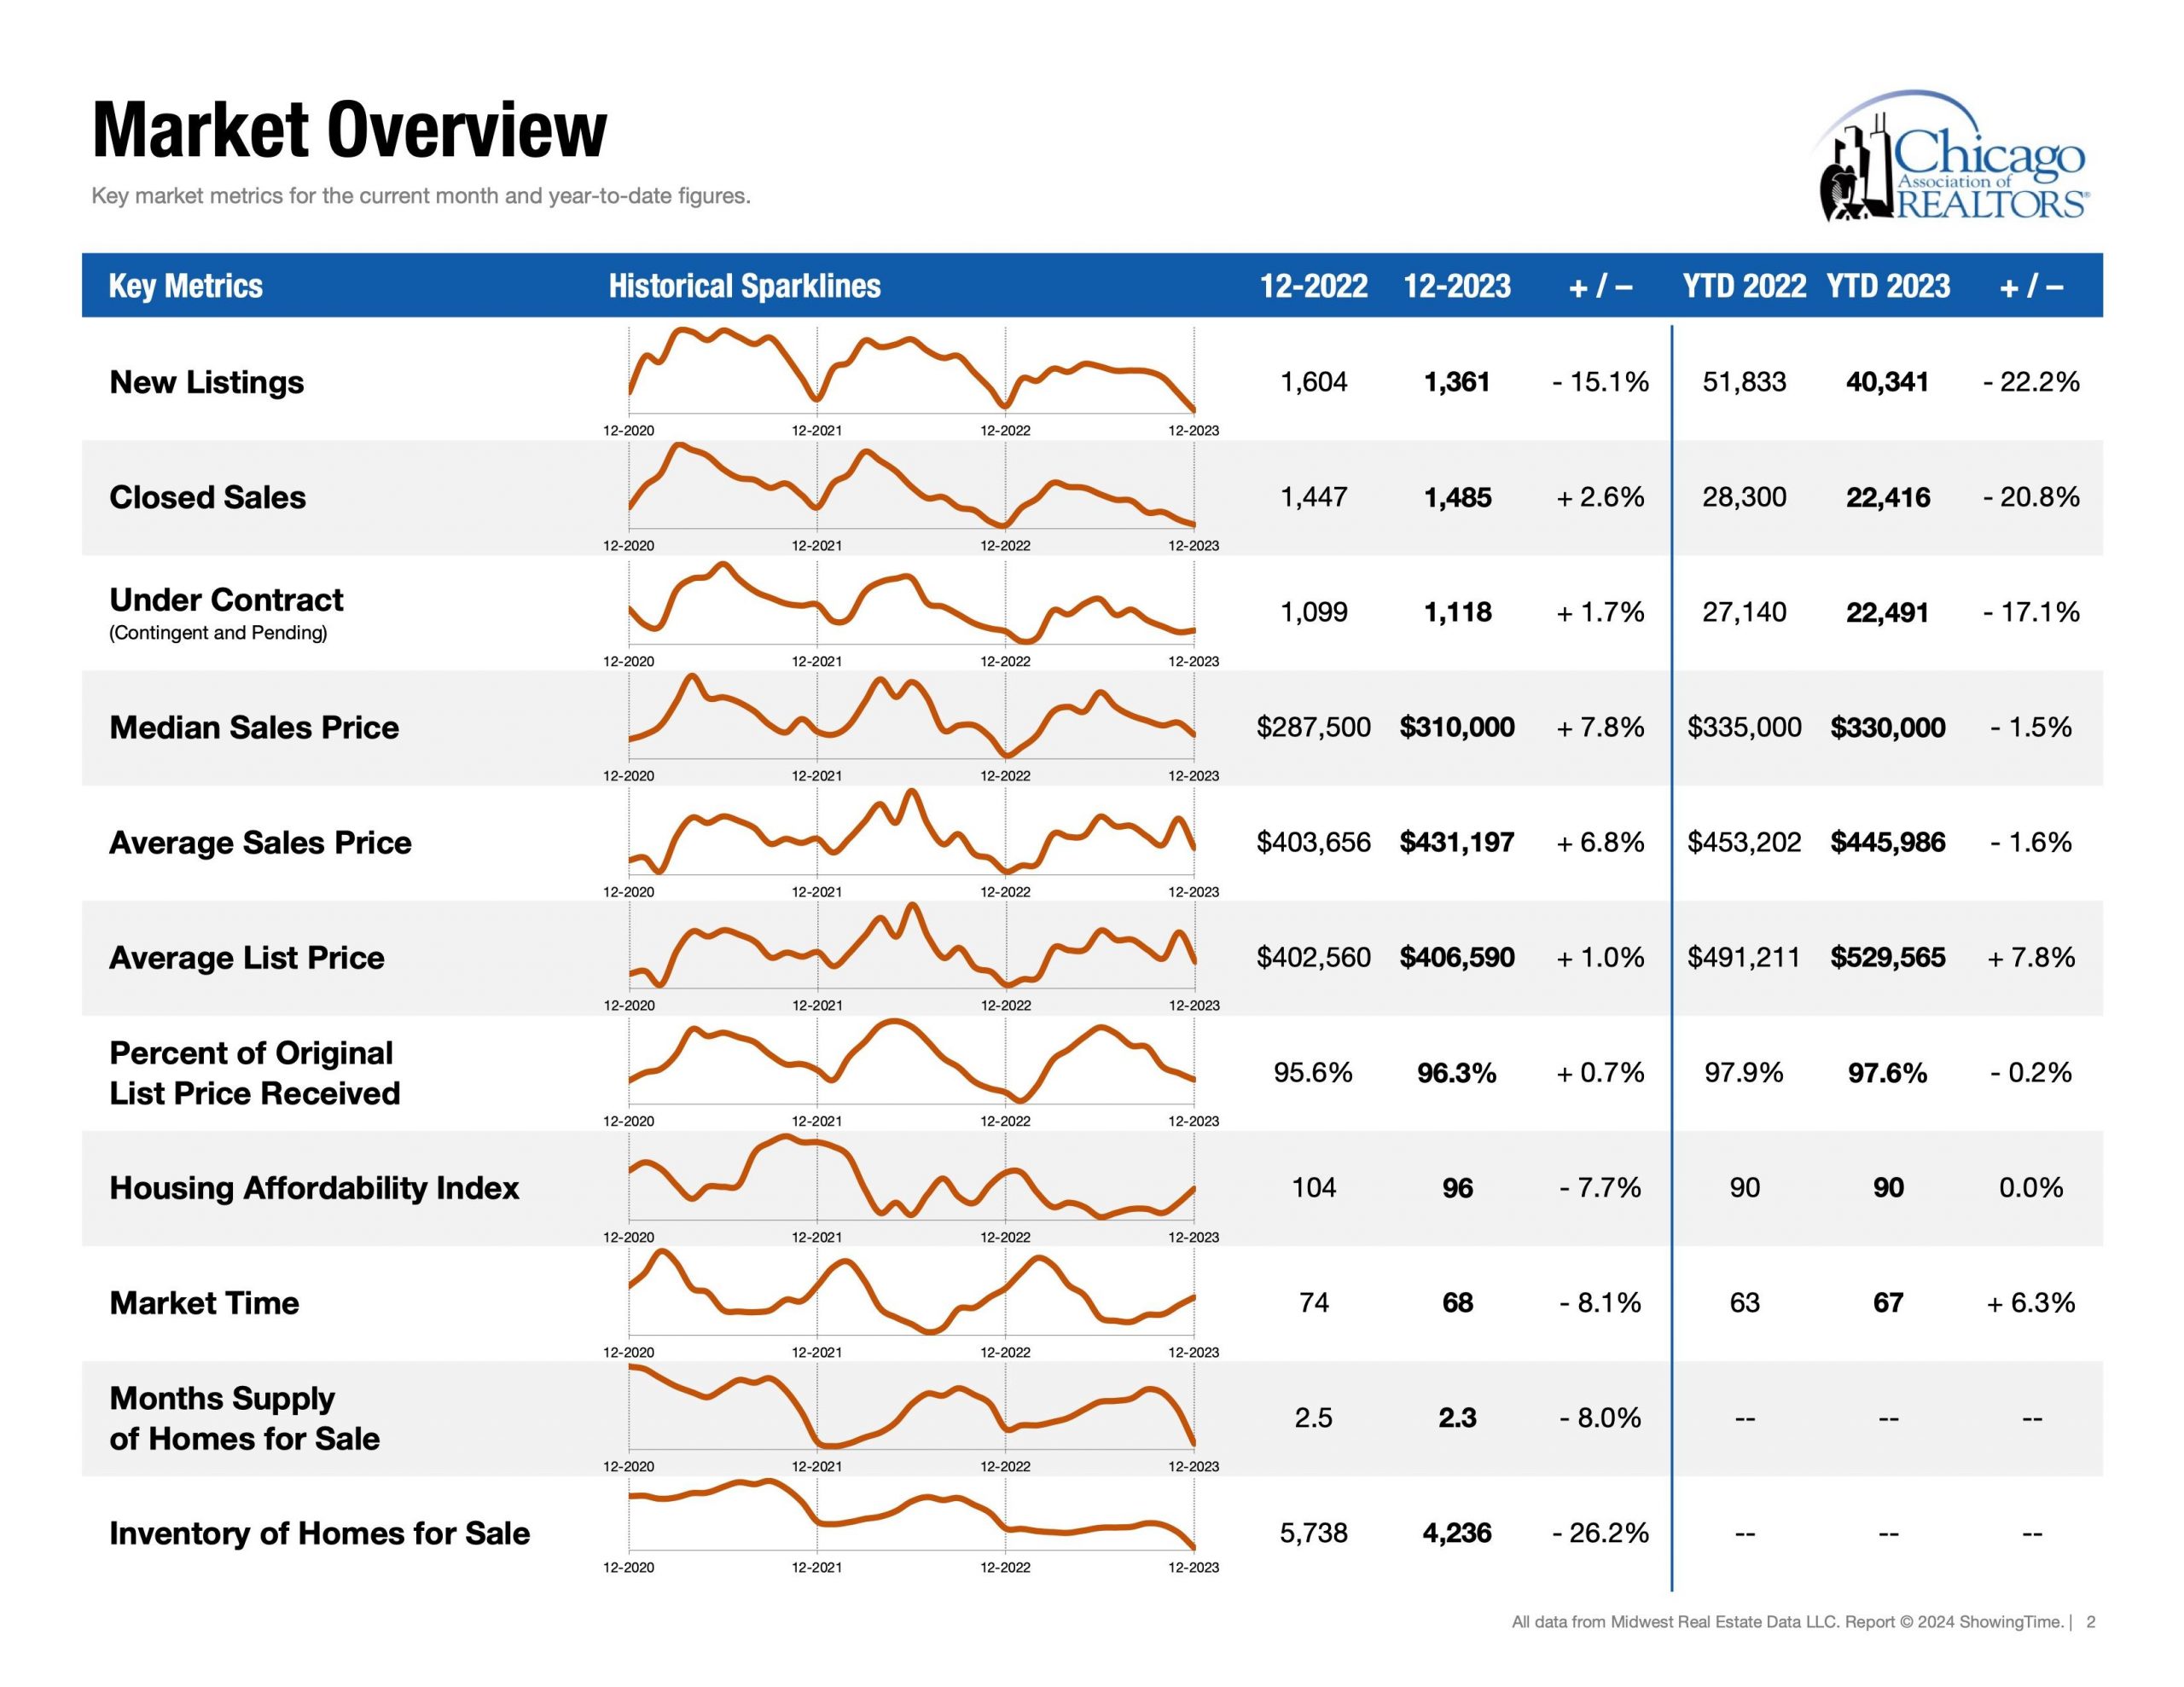
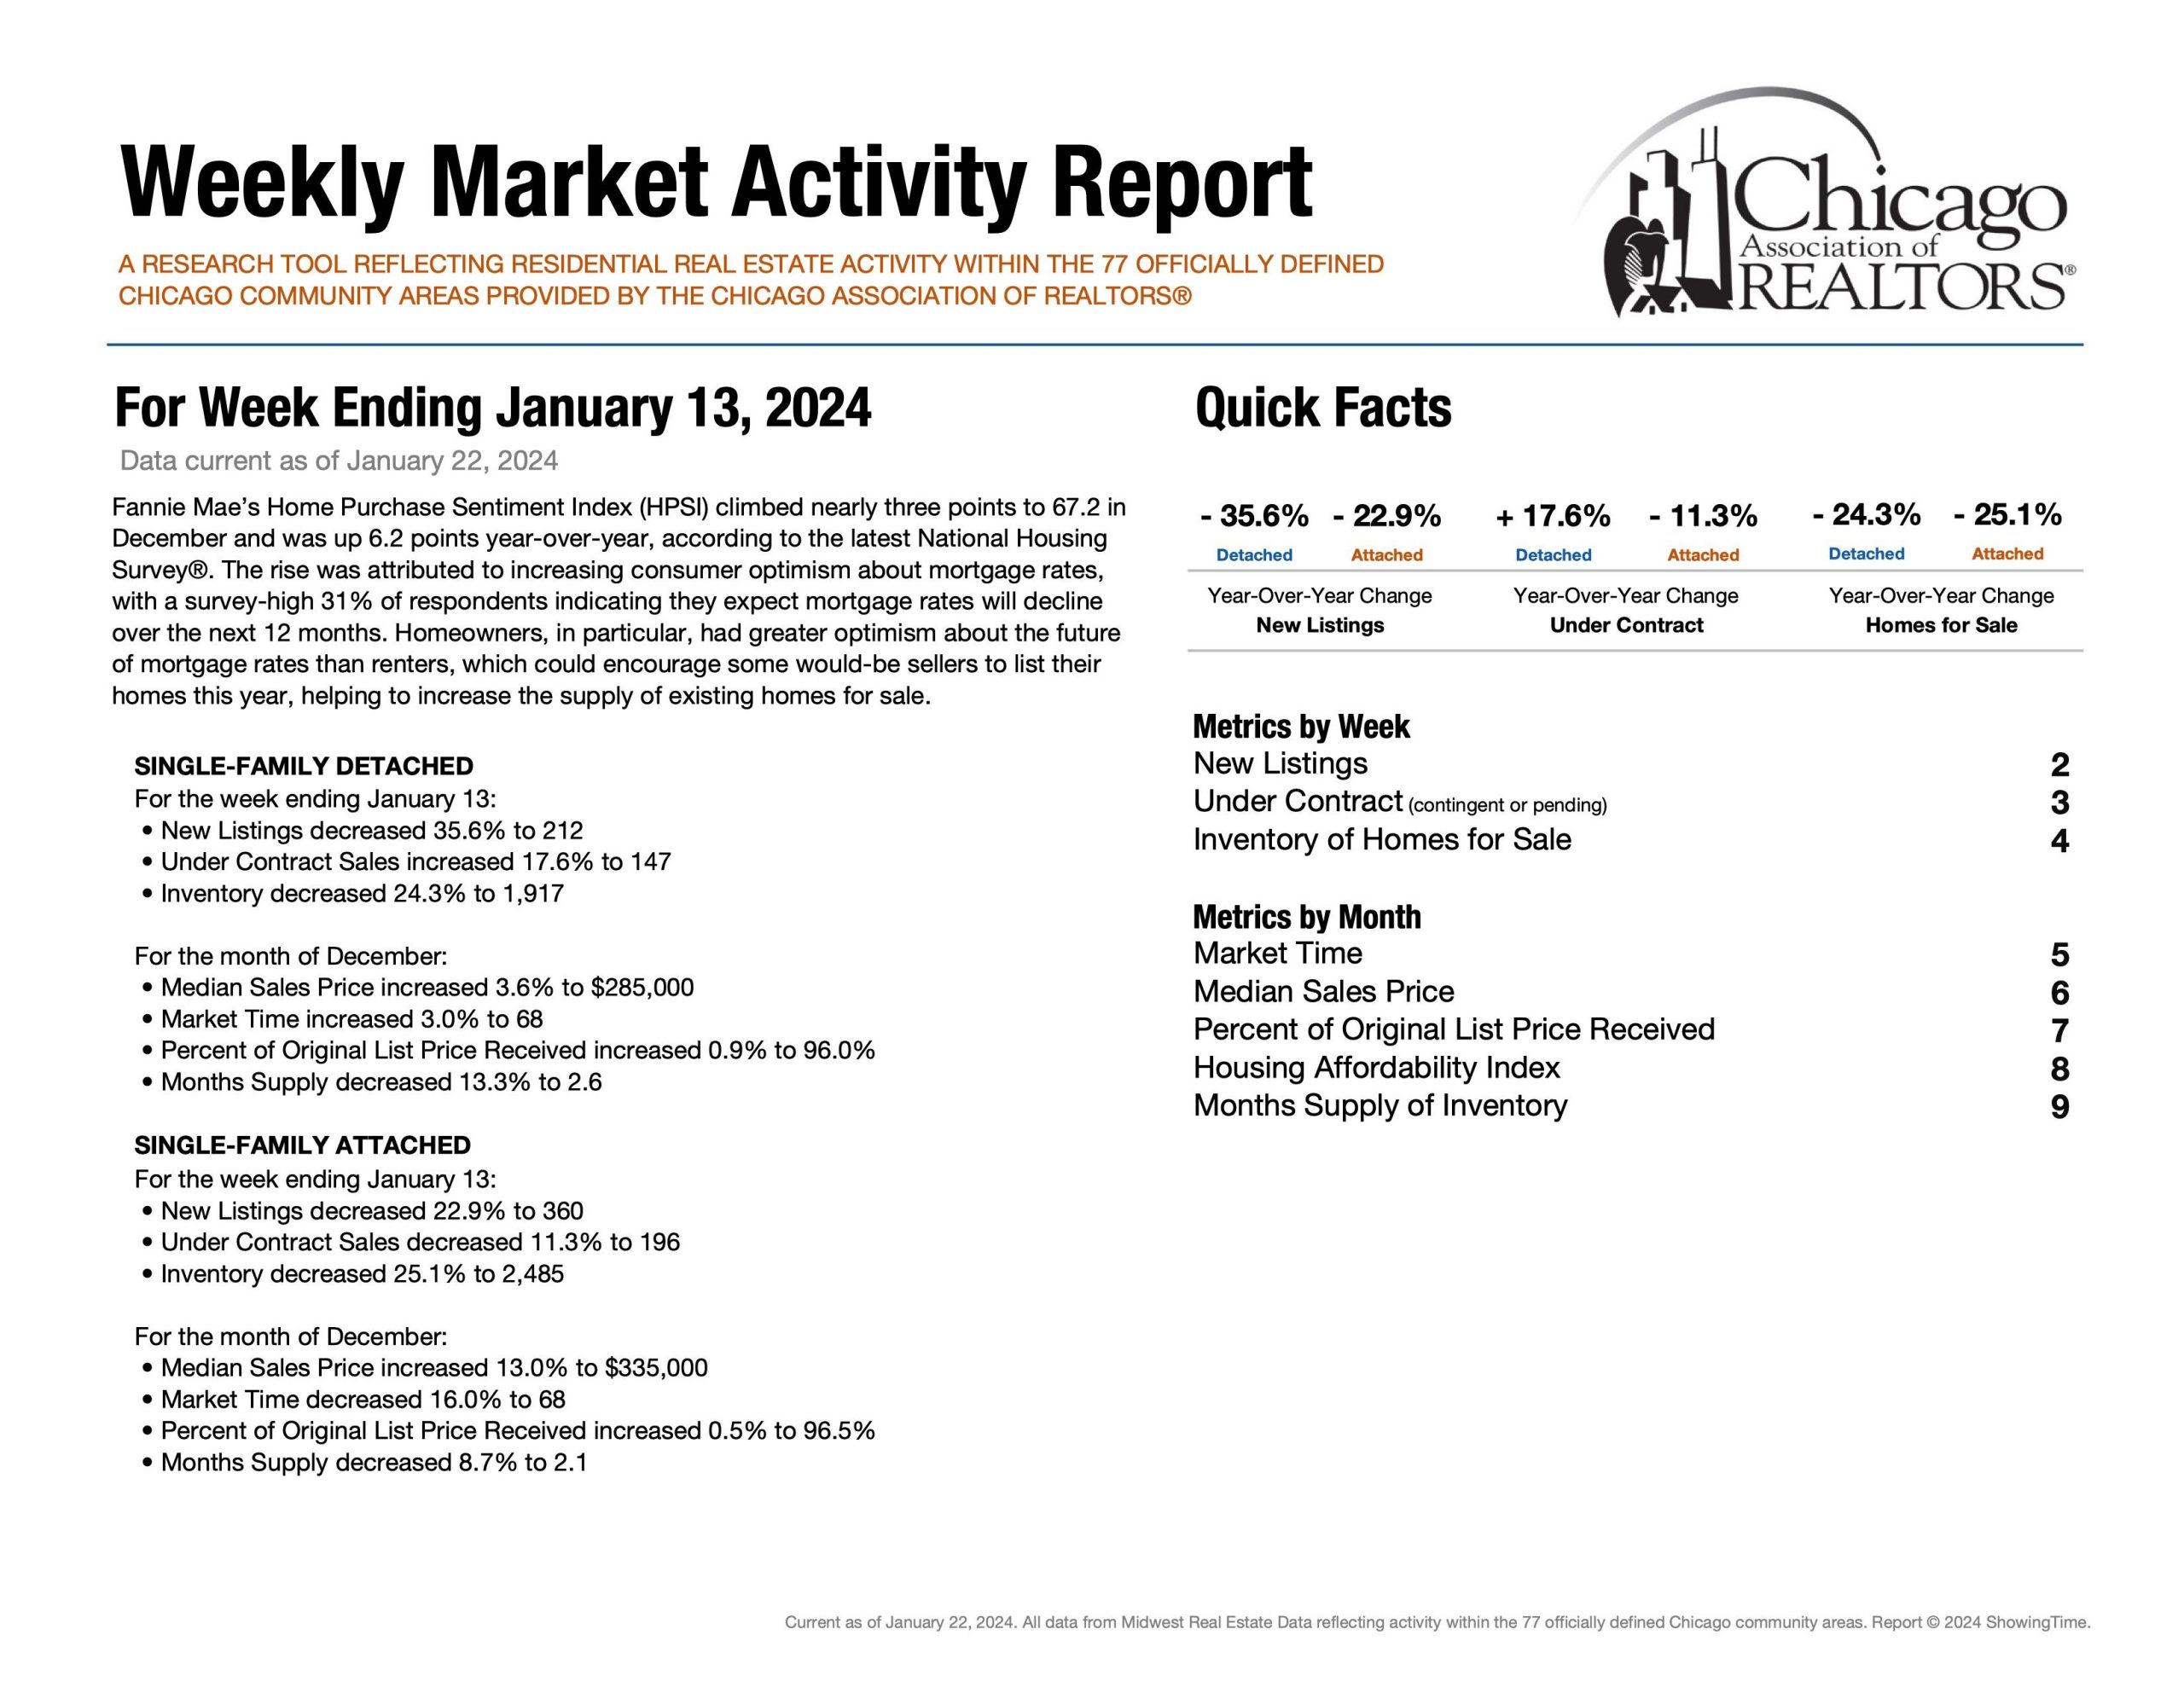
First, market time is metric that showcases speed and whether a listing was priced too low, priced properly or priced too high. If a listing surpasses average days on market, it is a check engine light that your listing maybe overpriced.
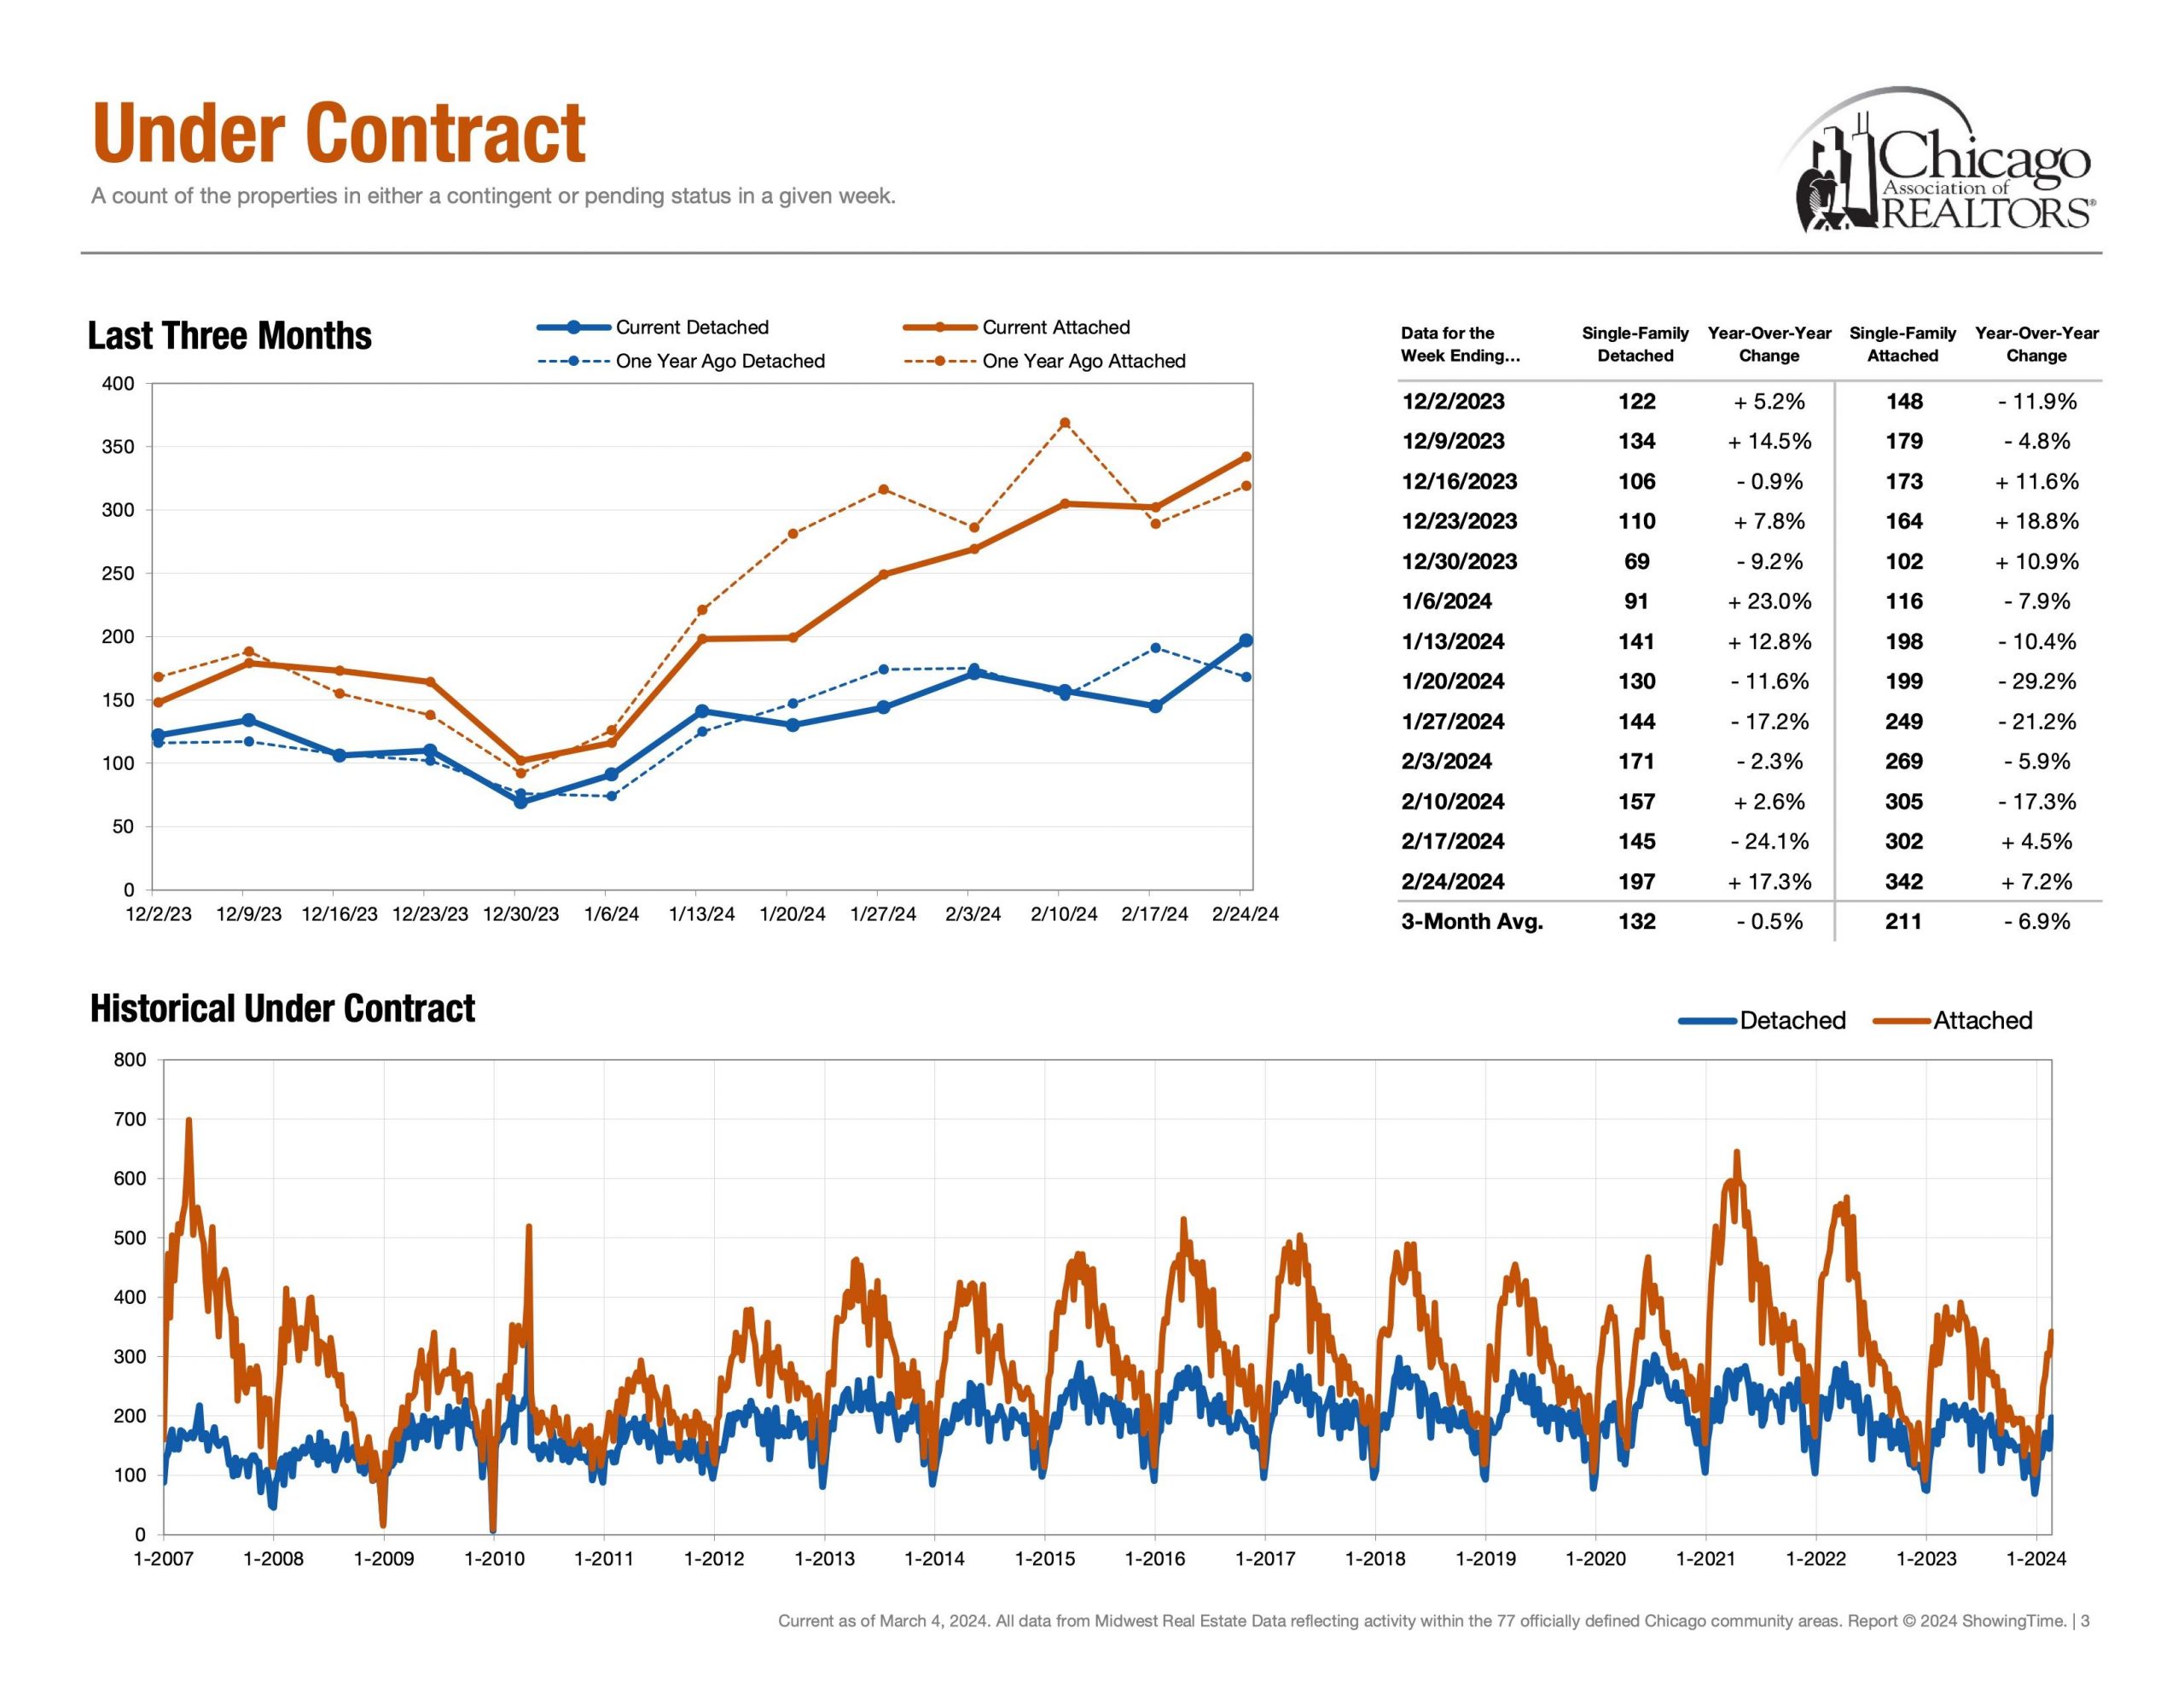
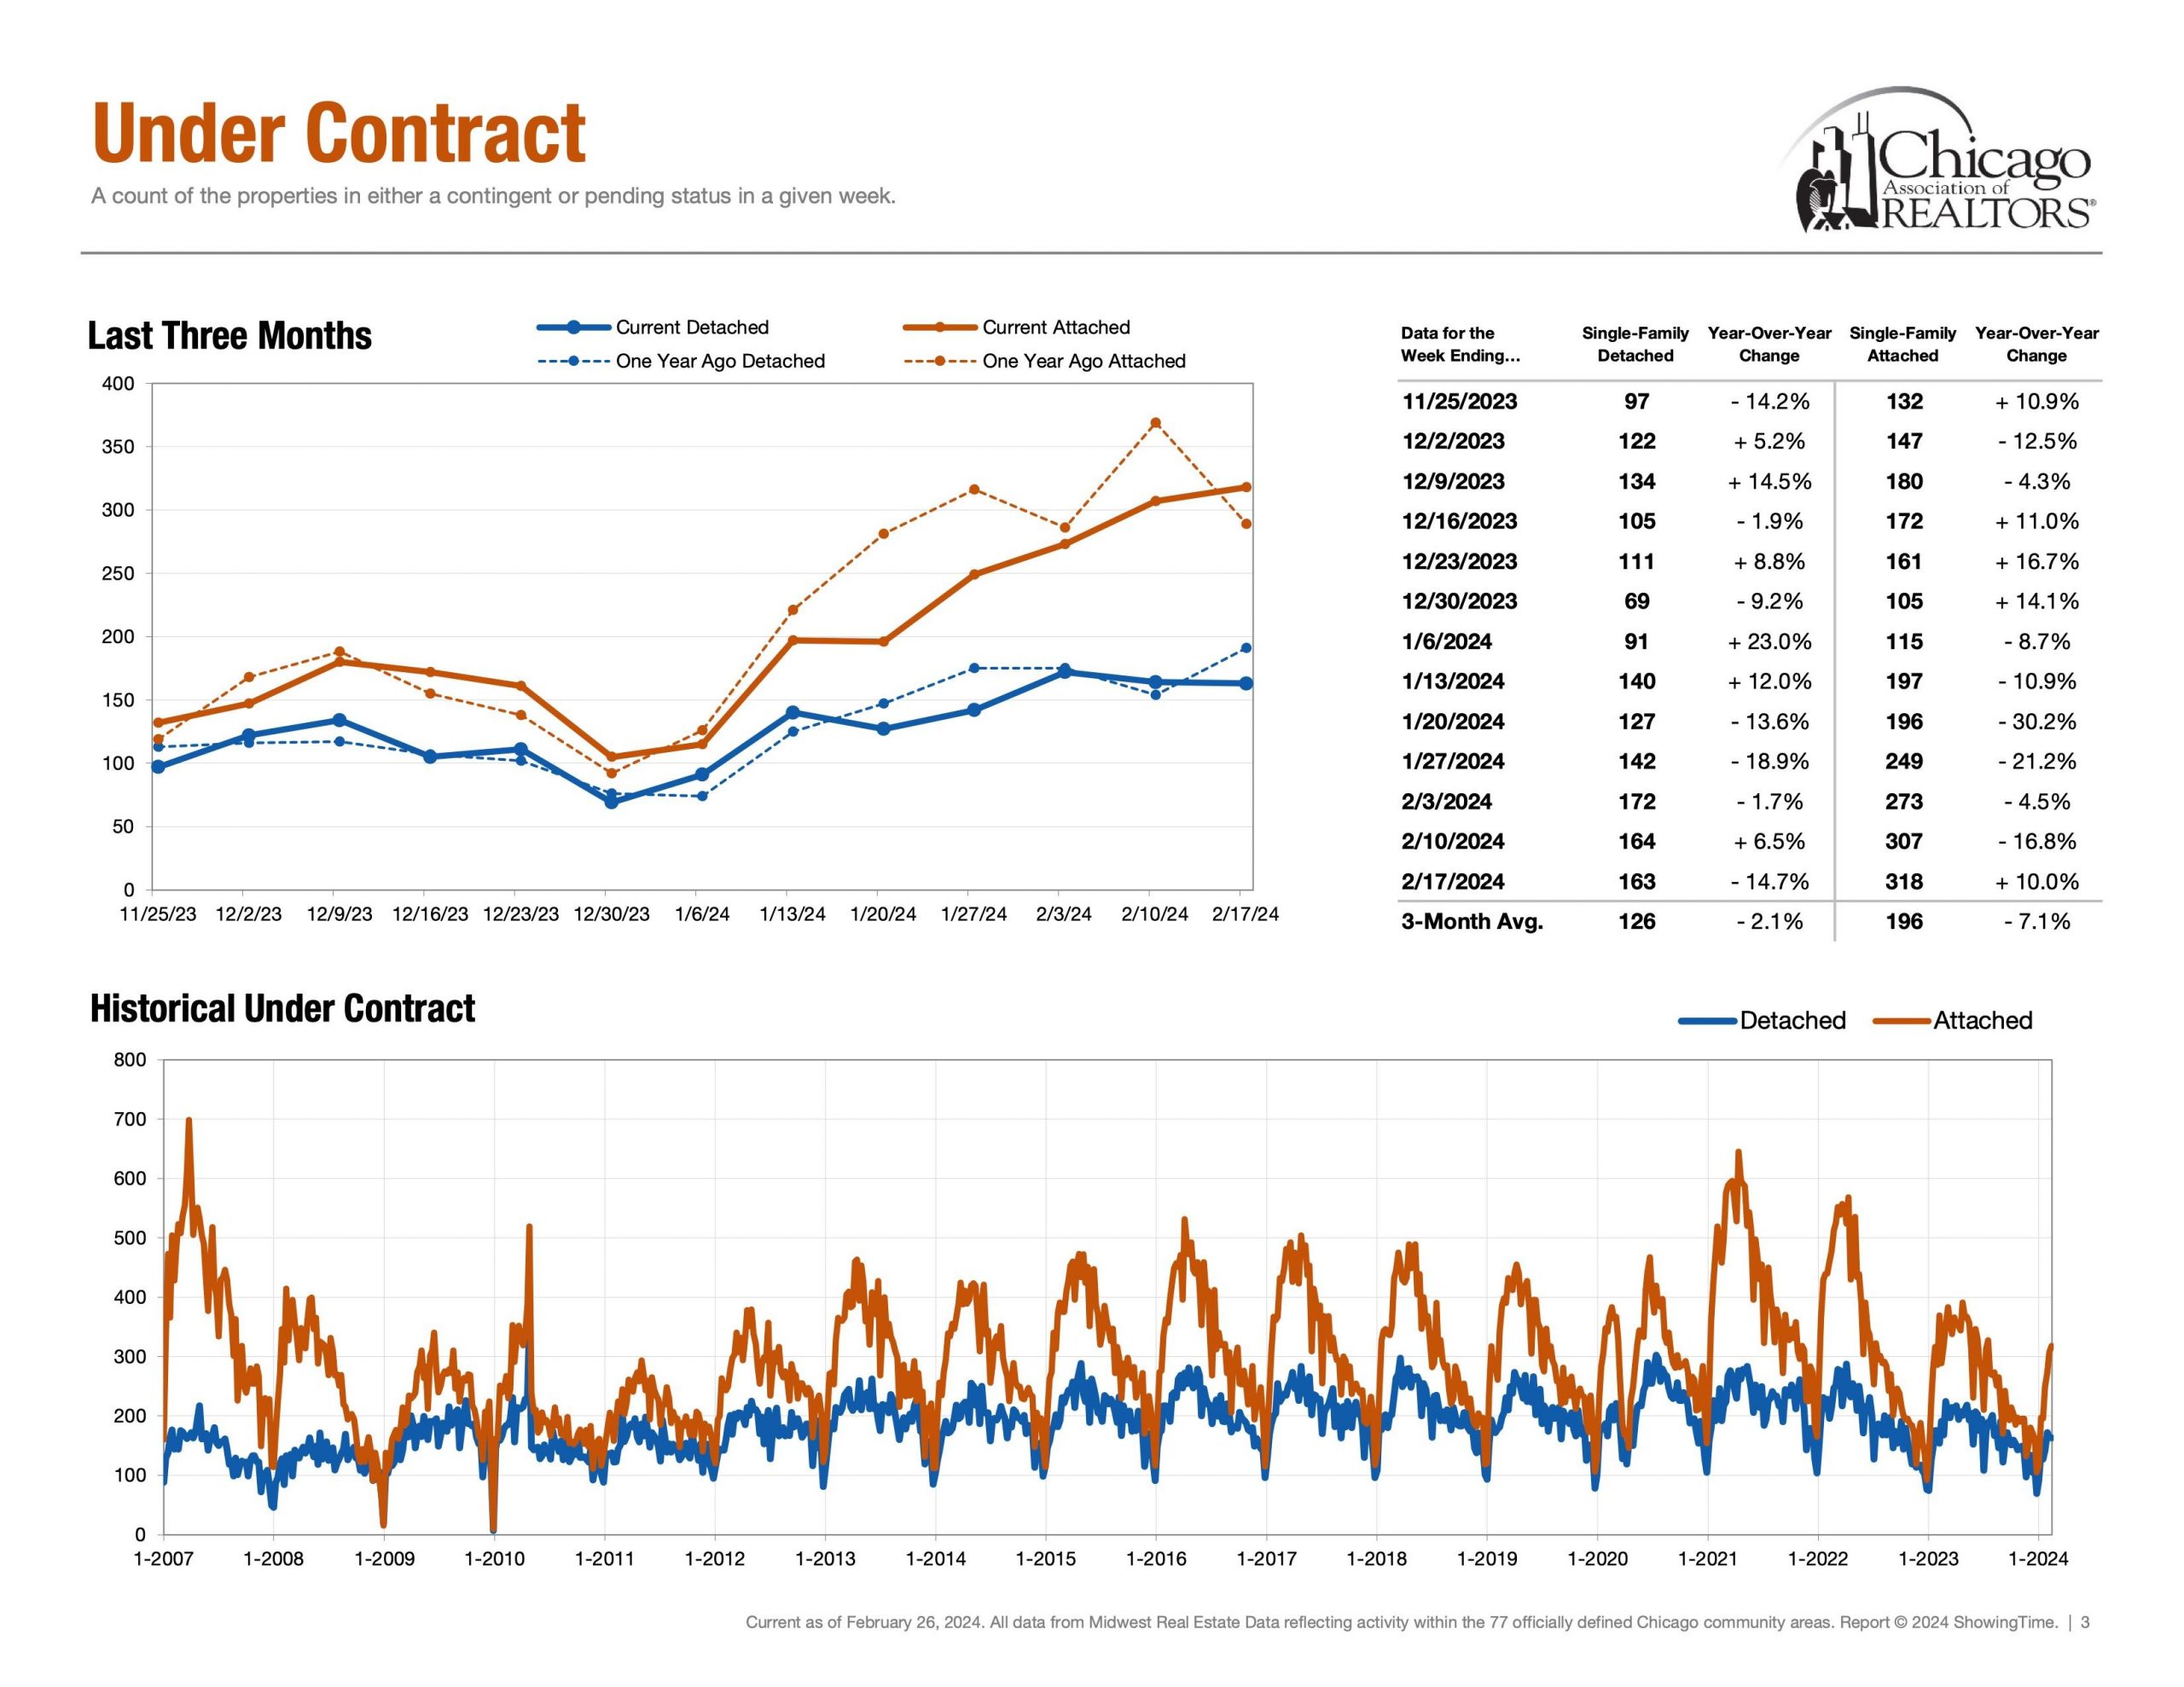
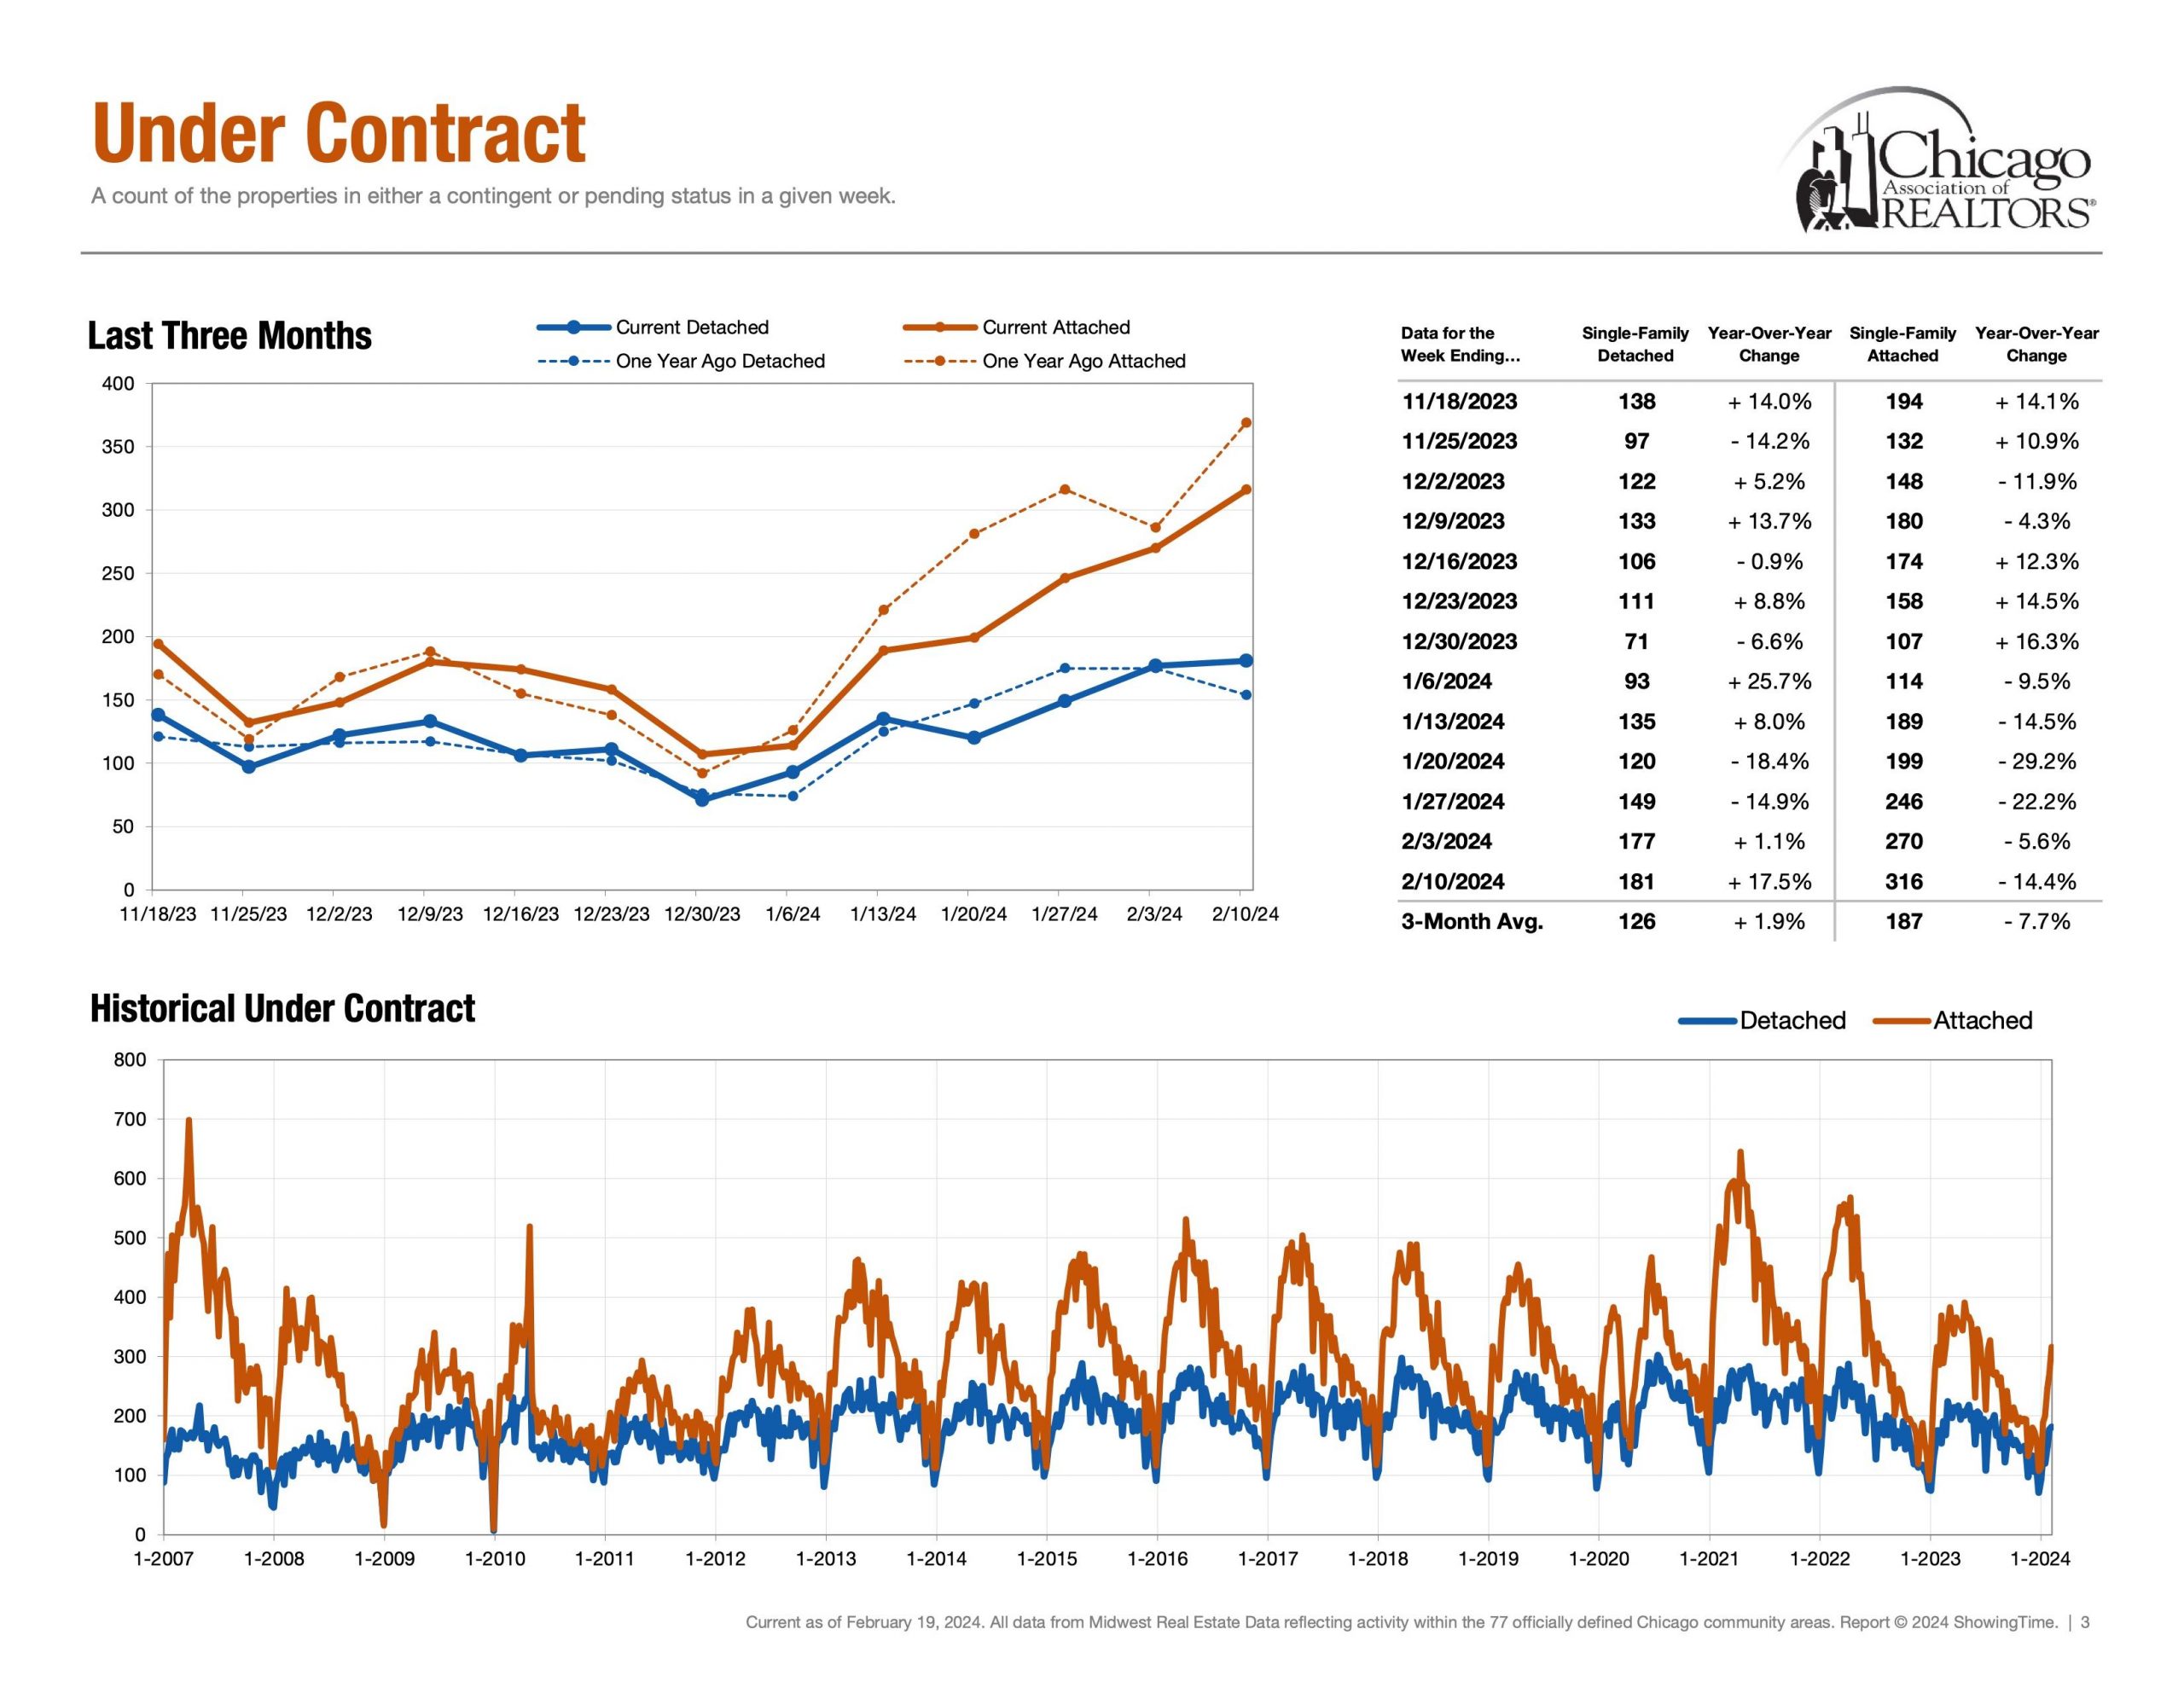
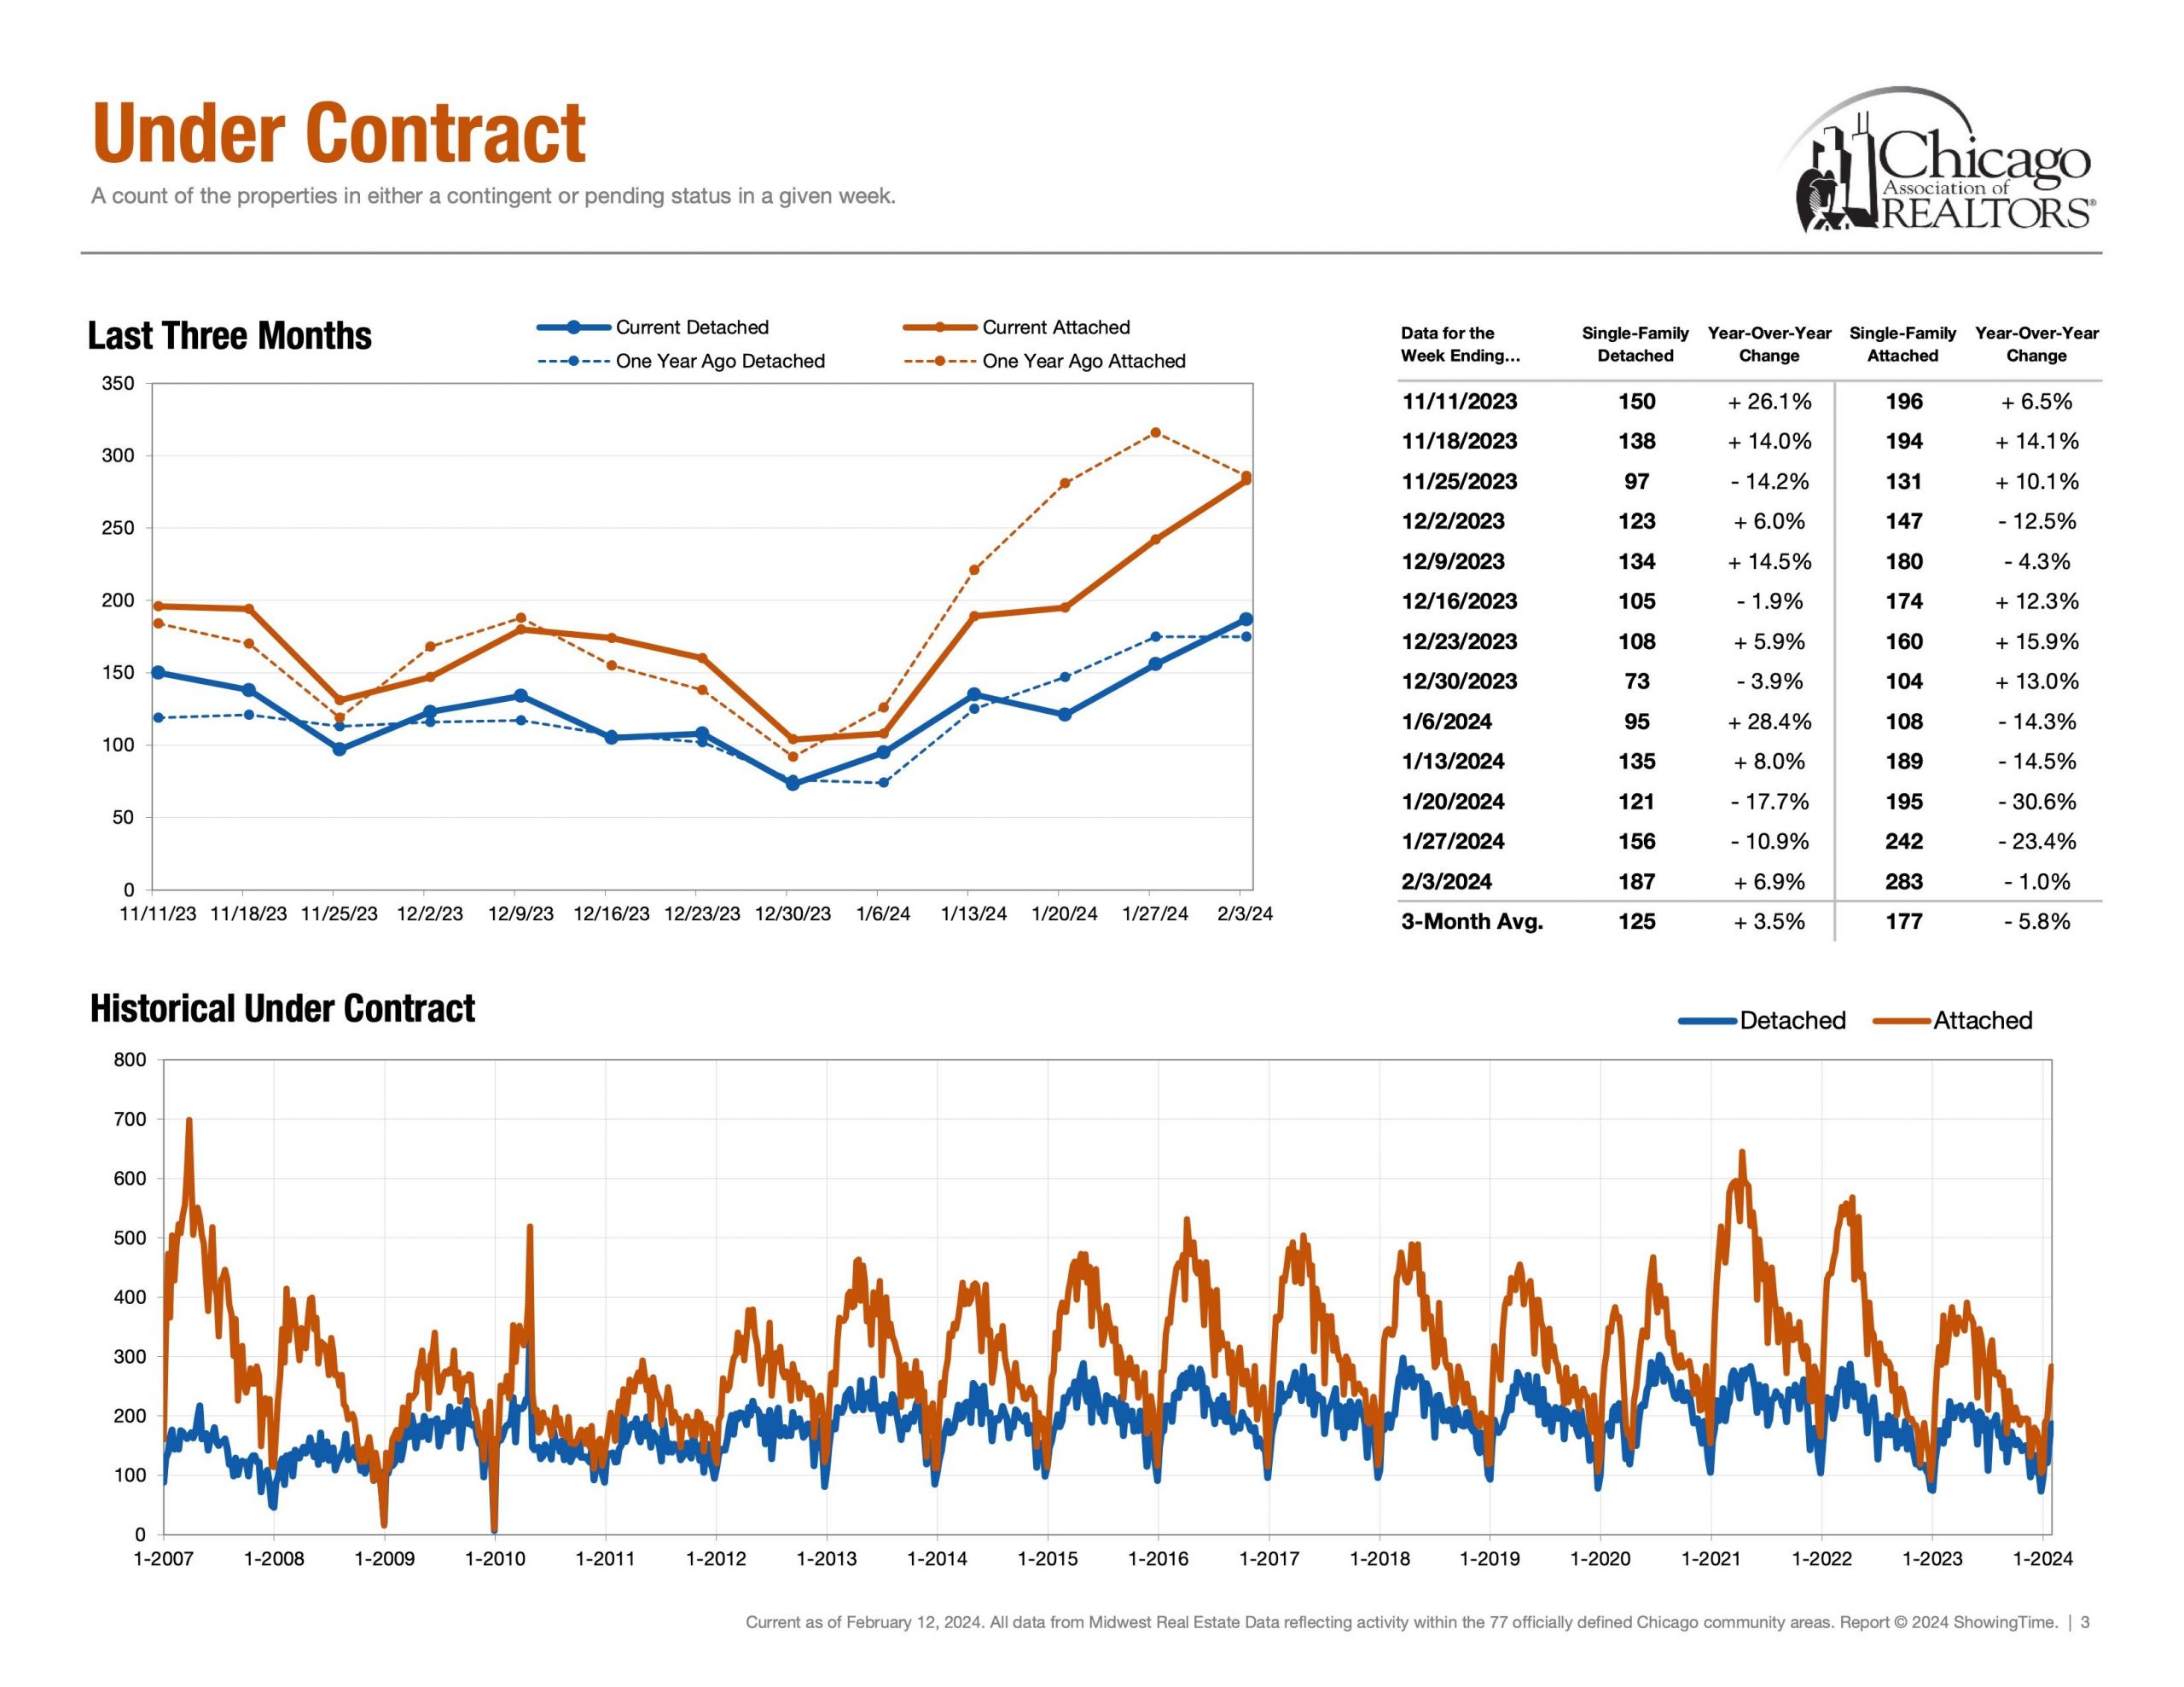
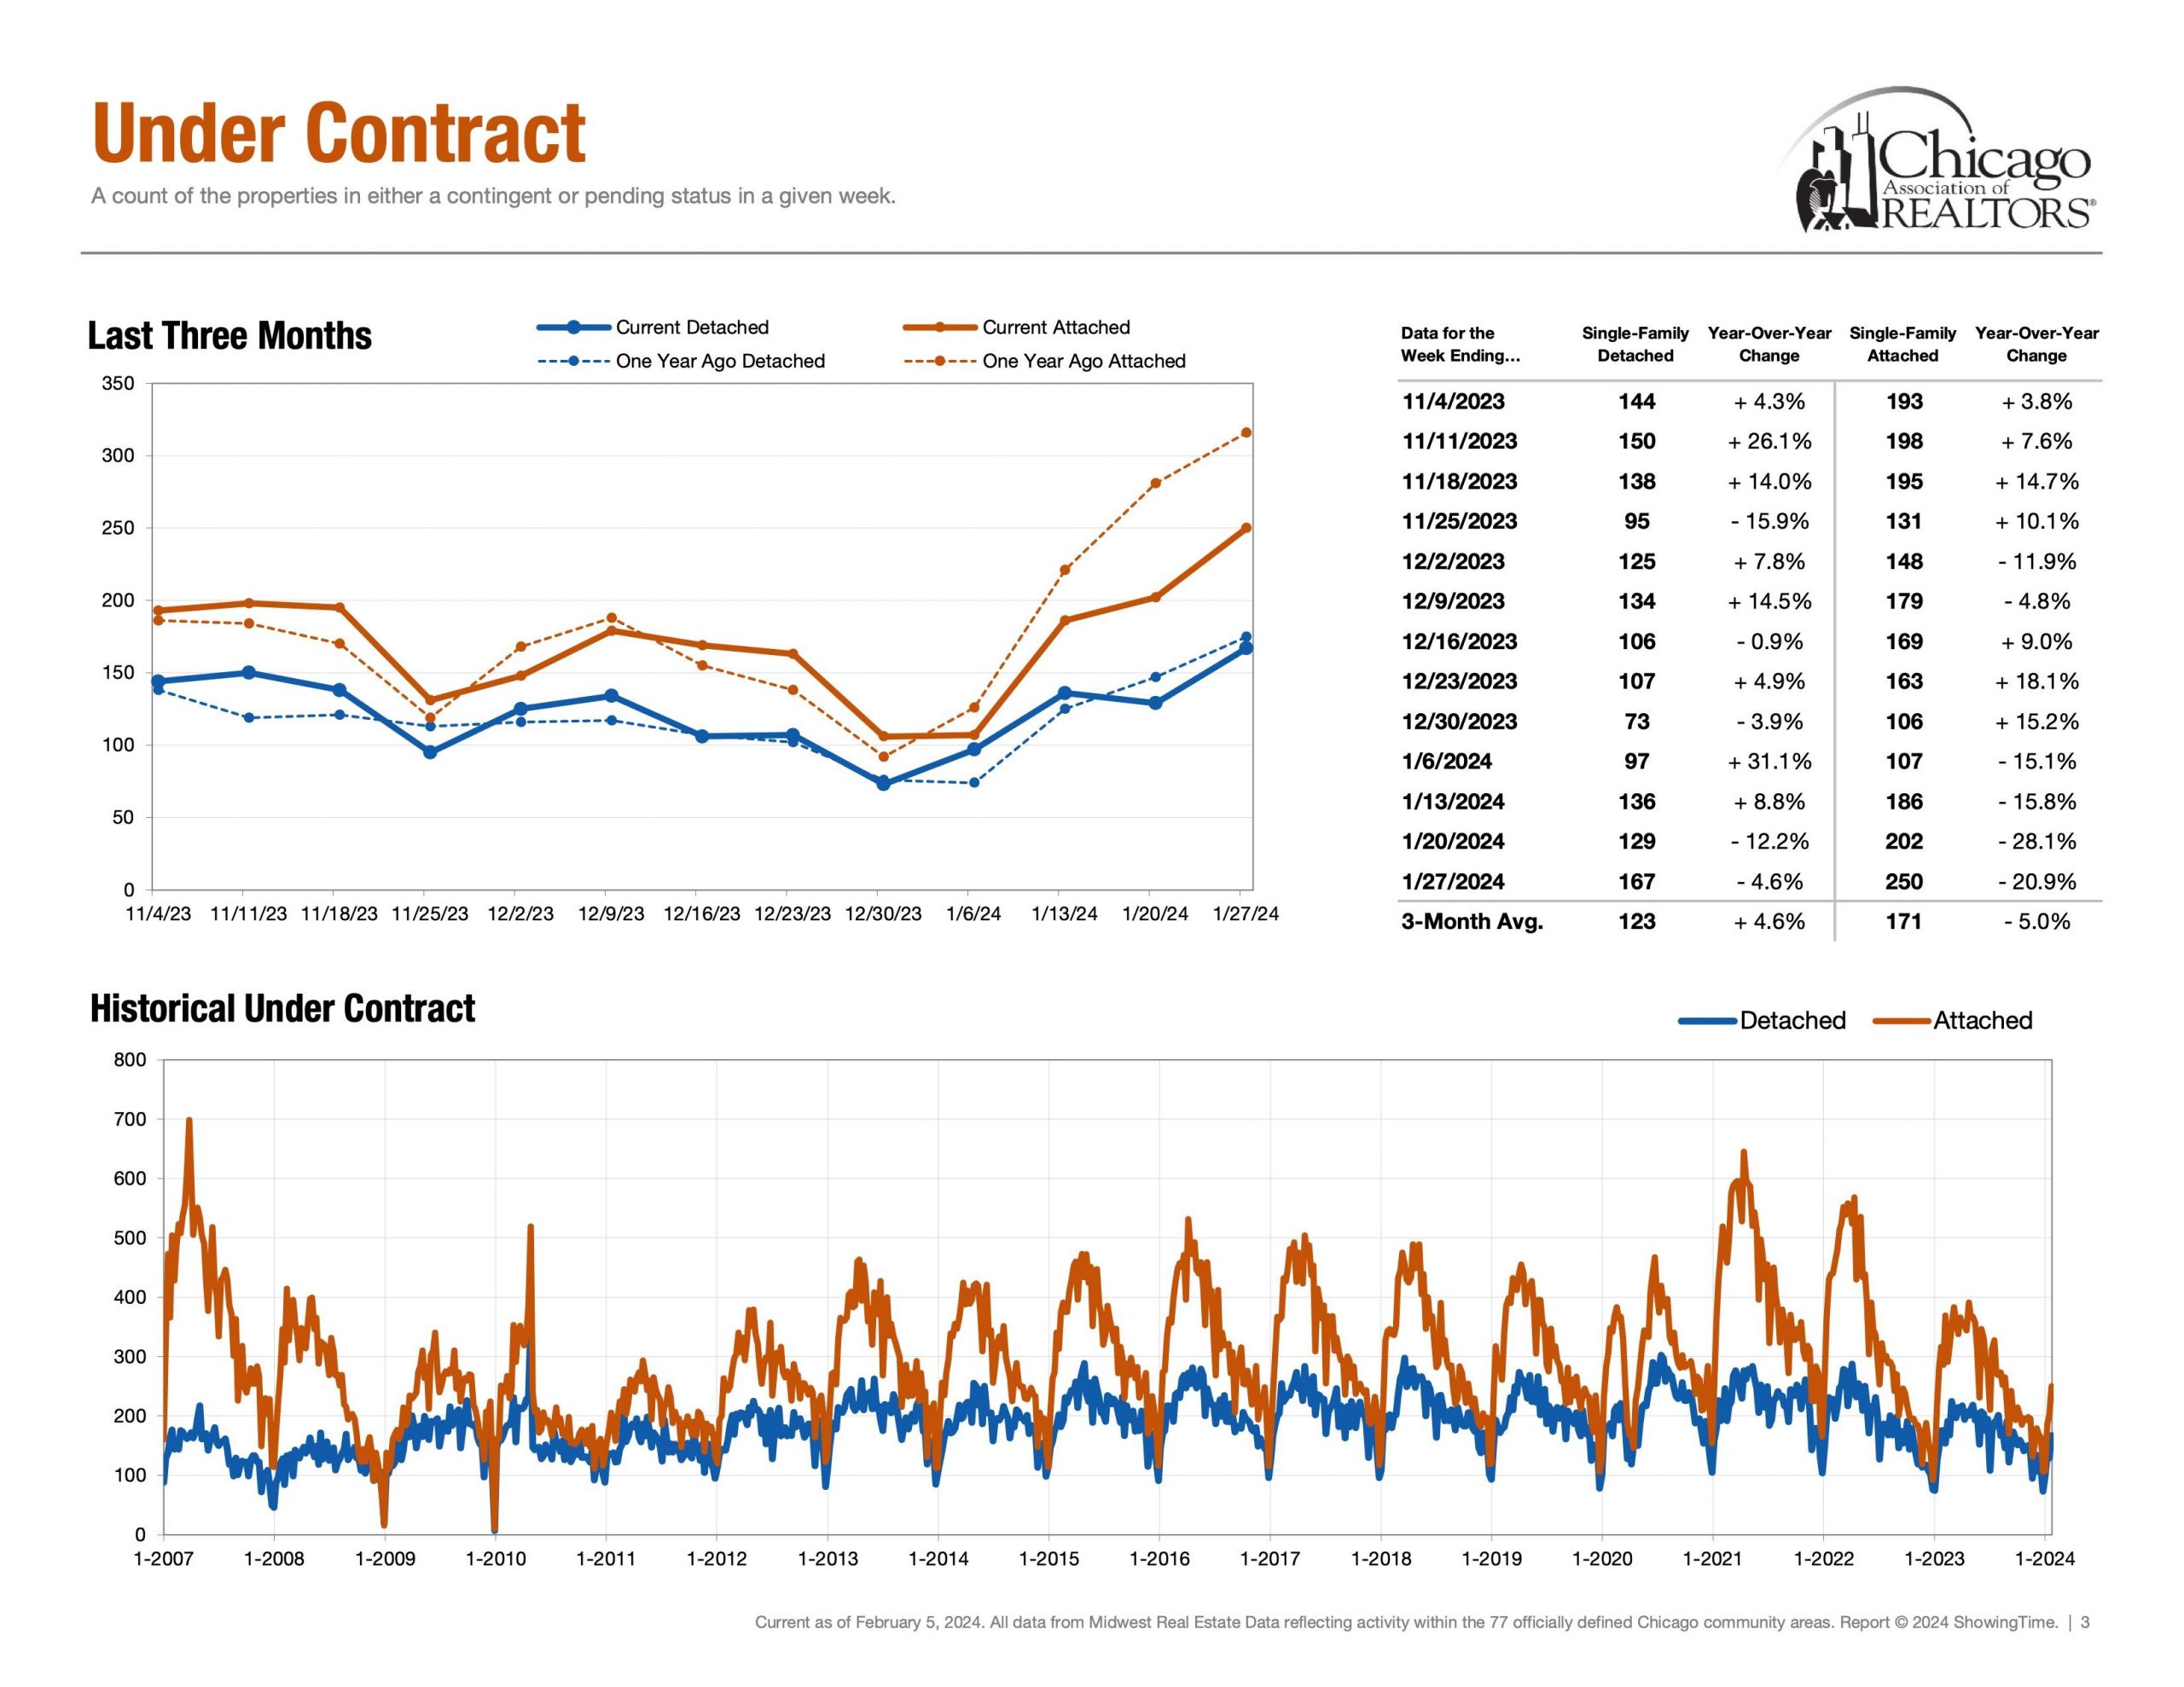
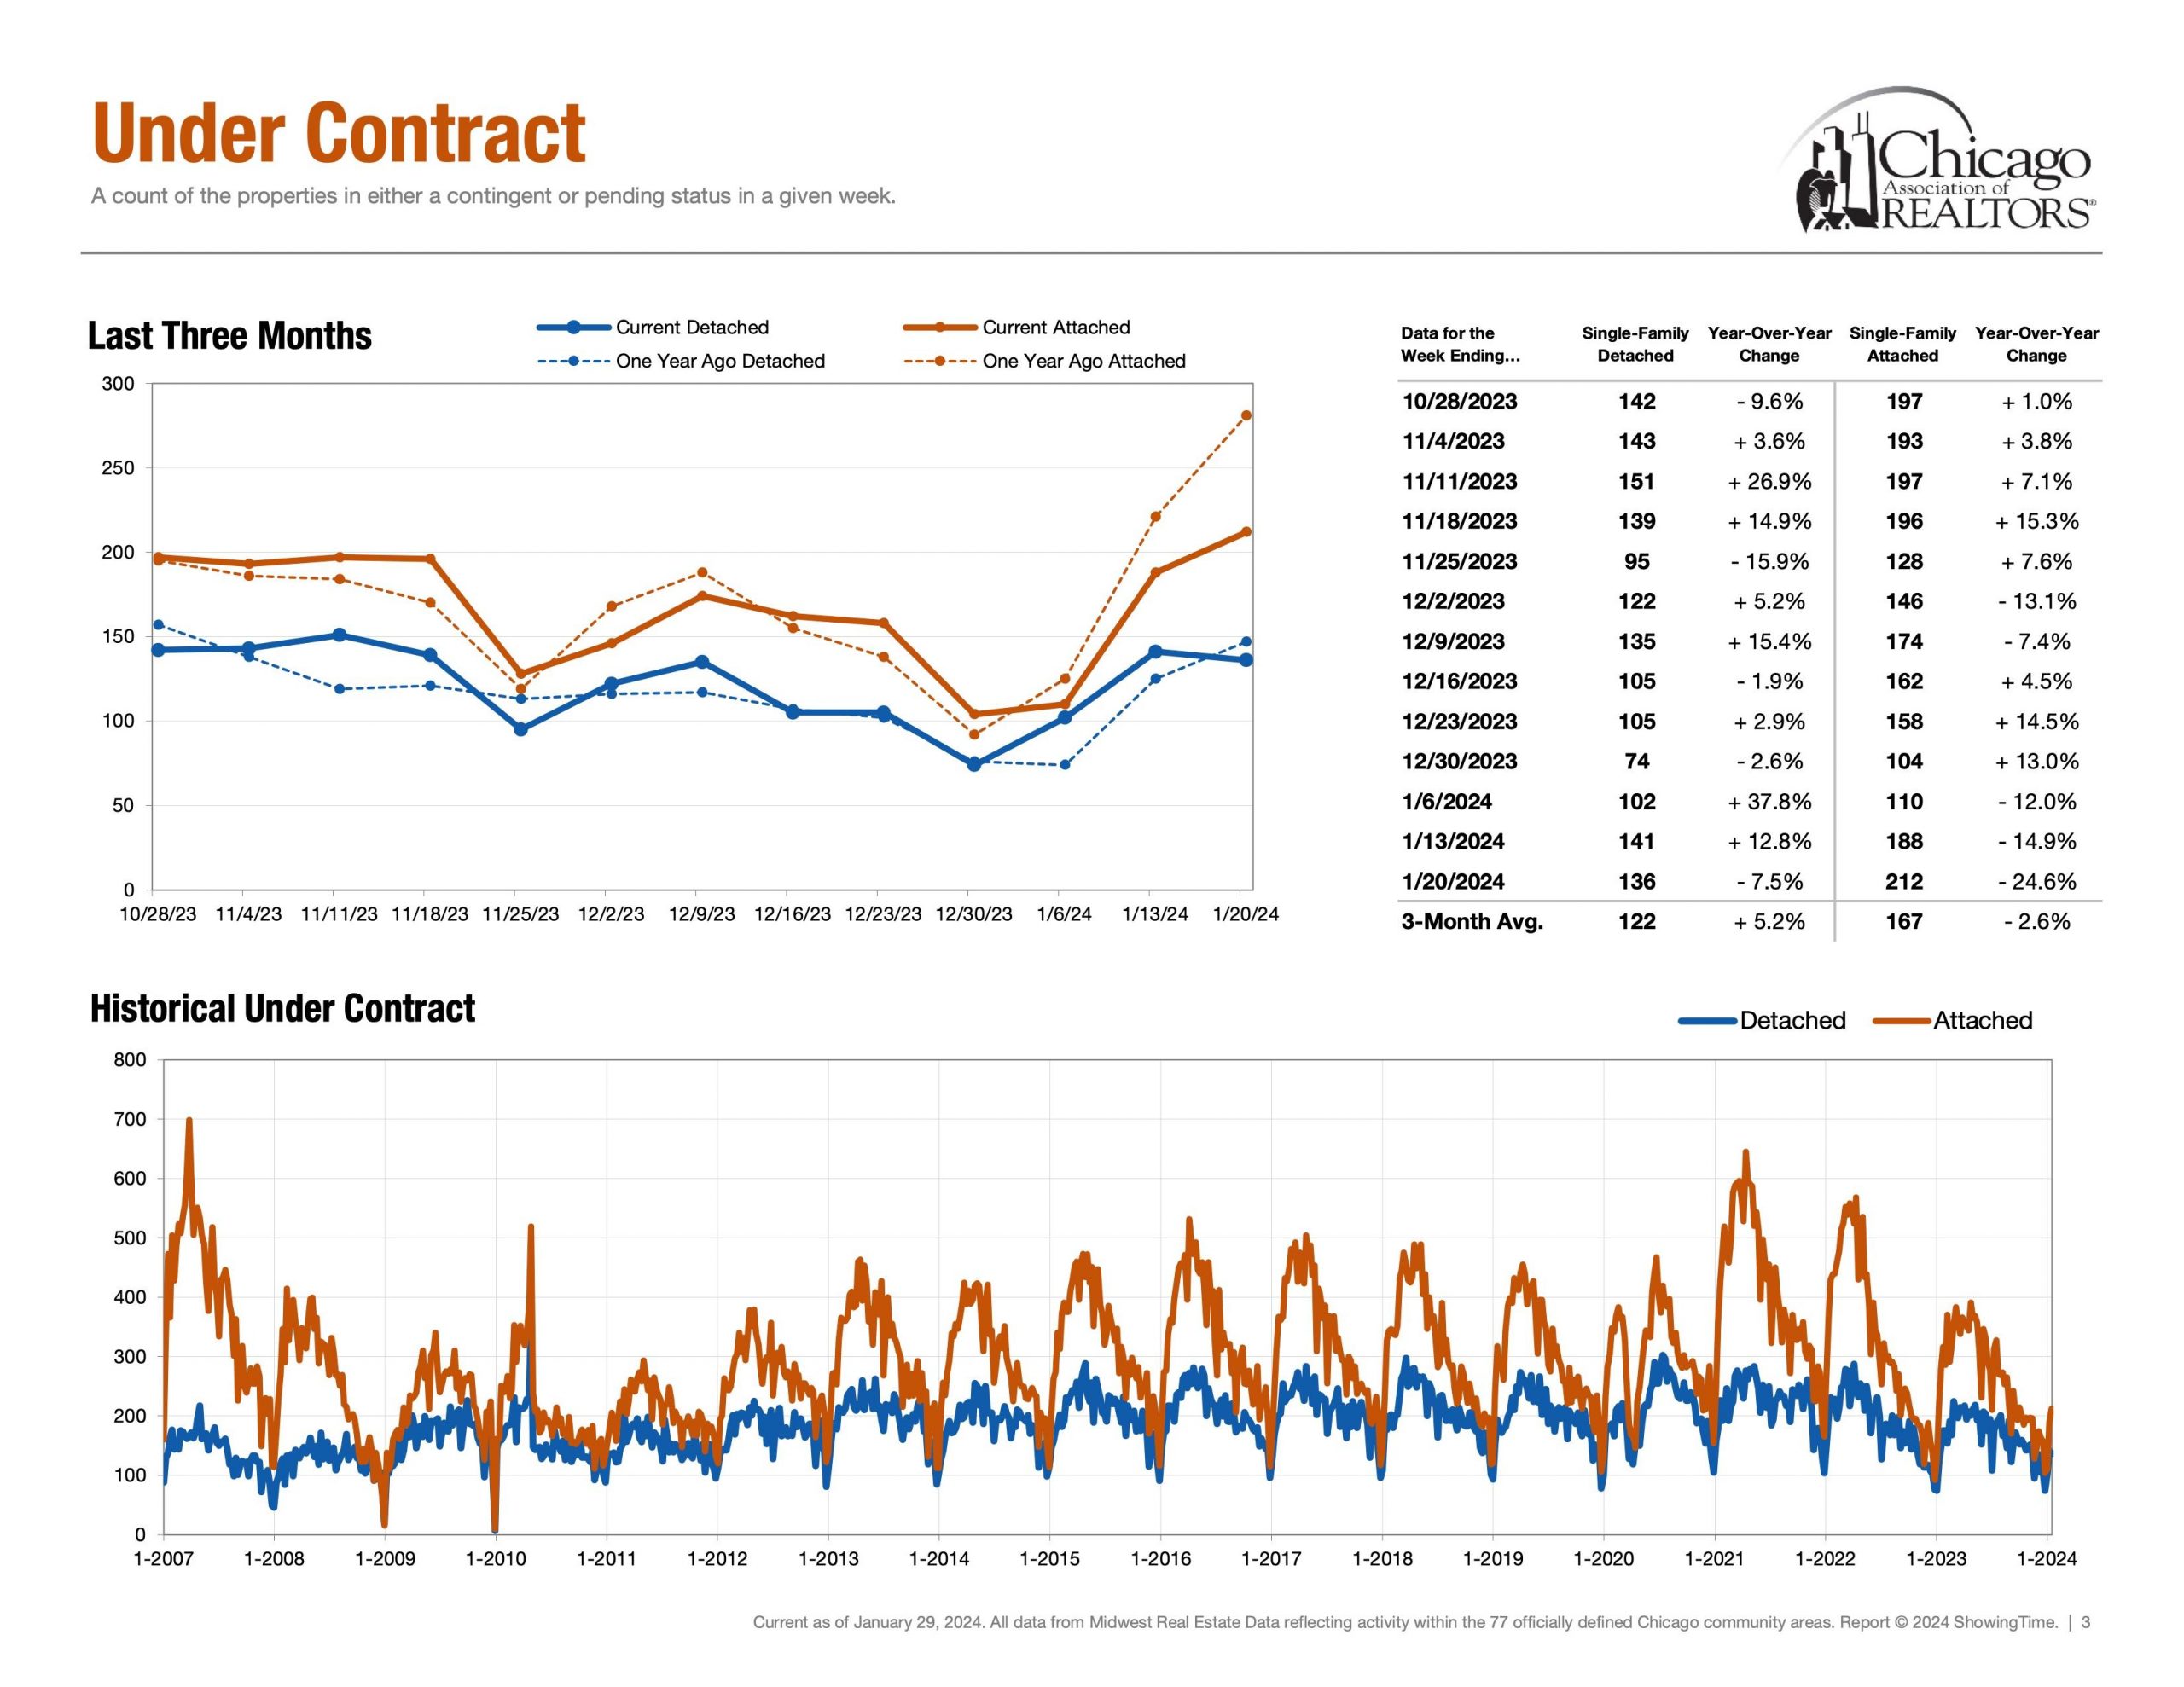
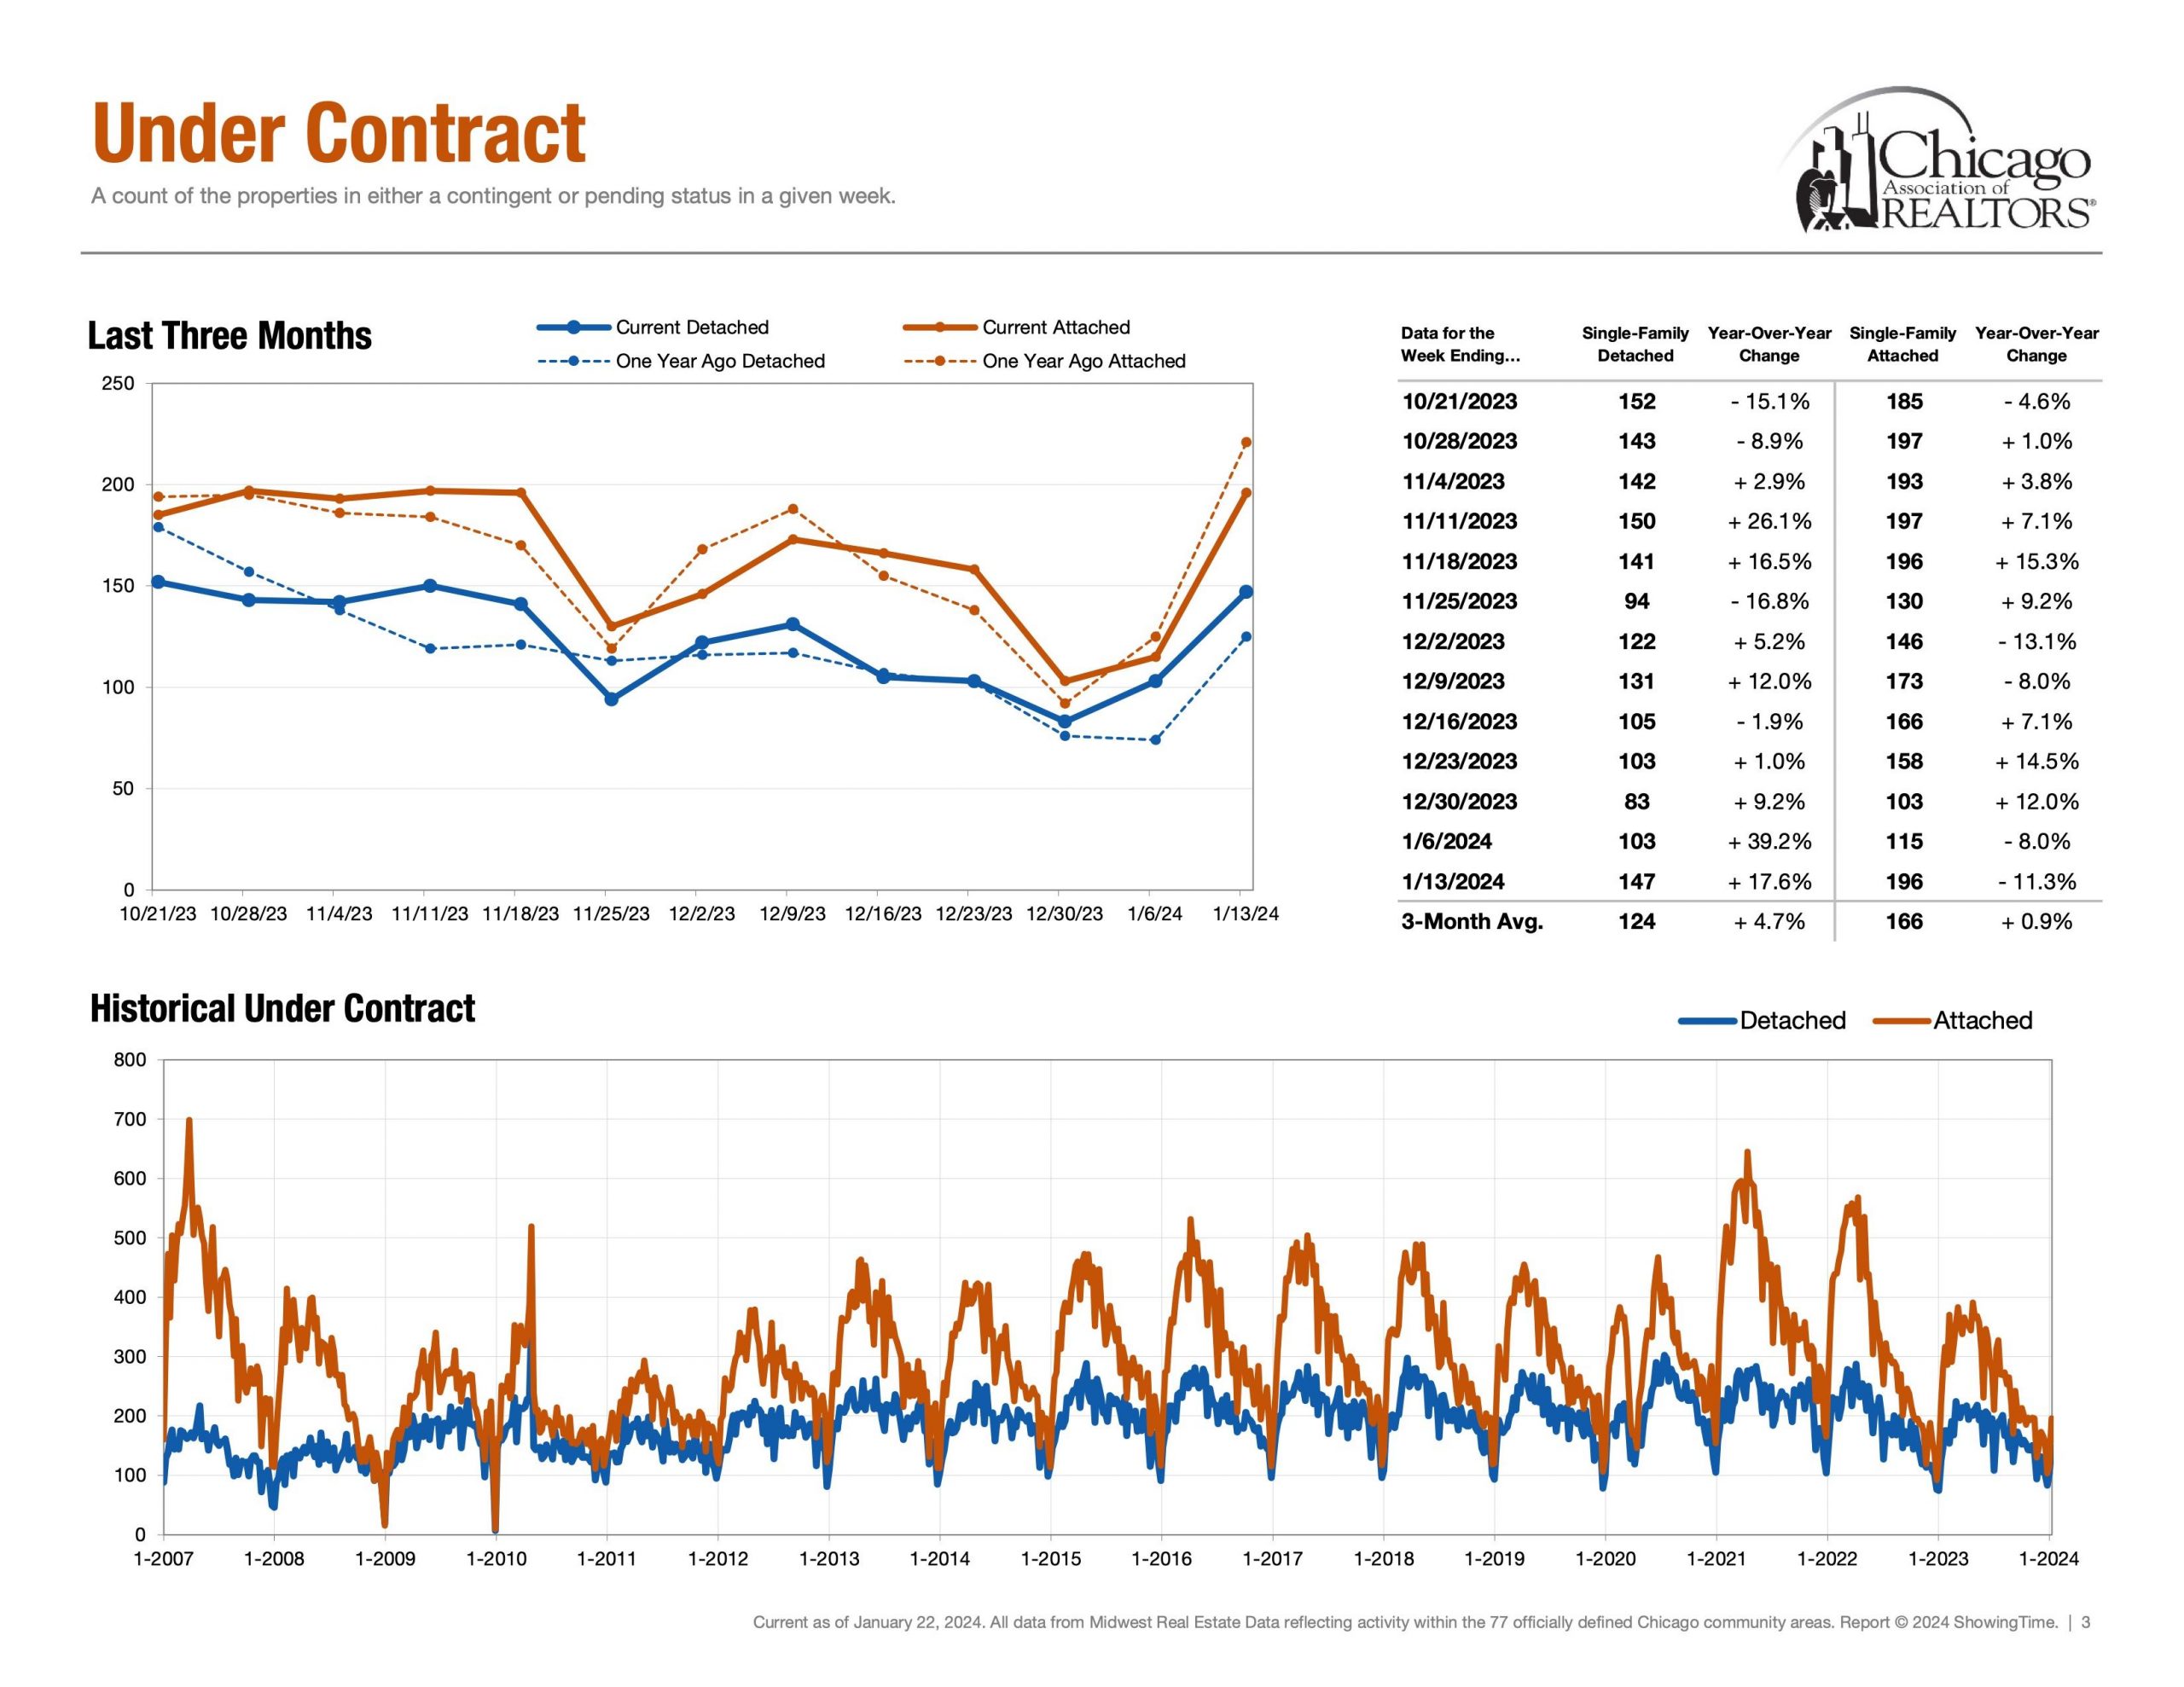
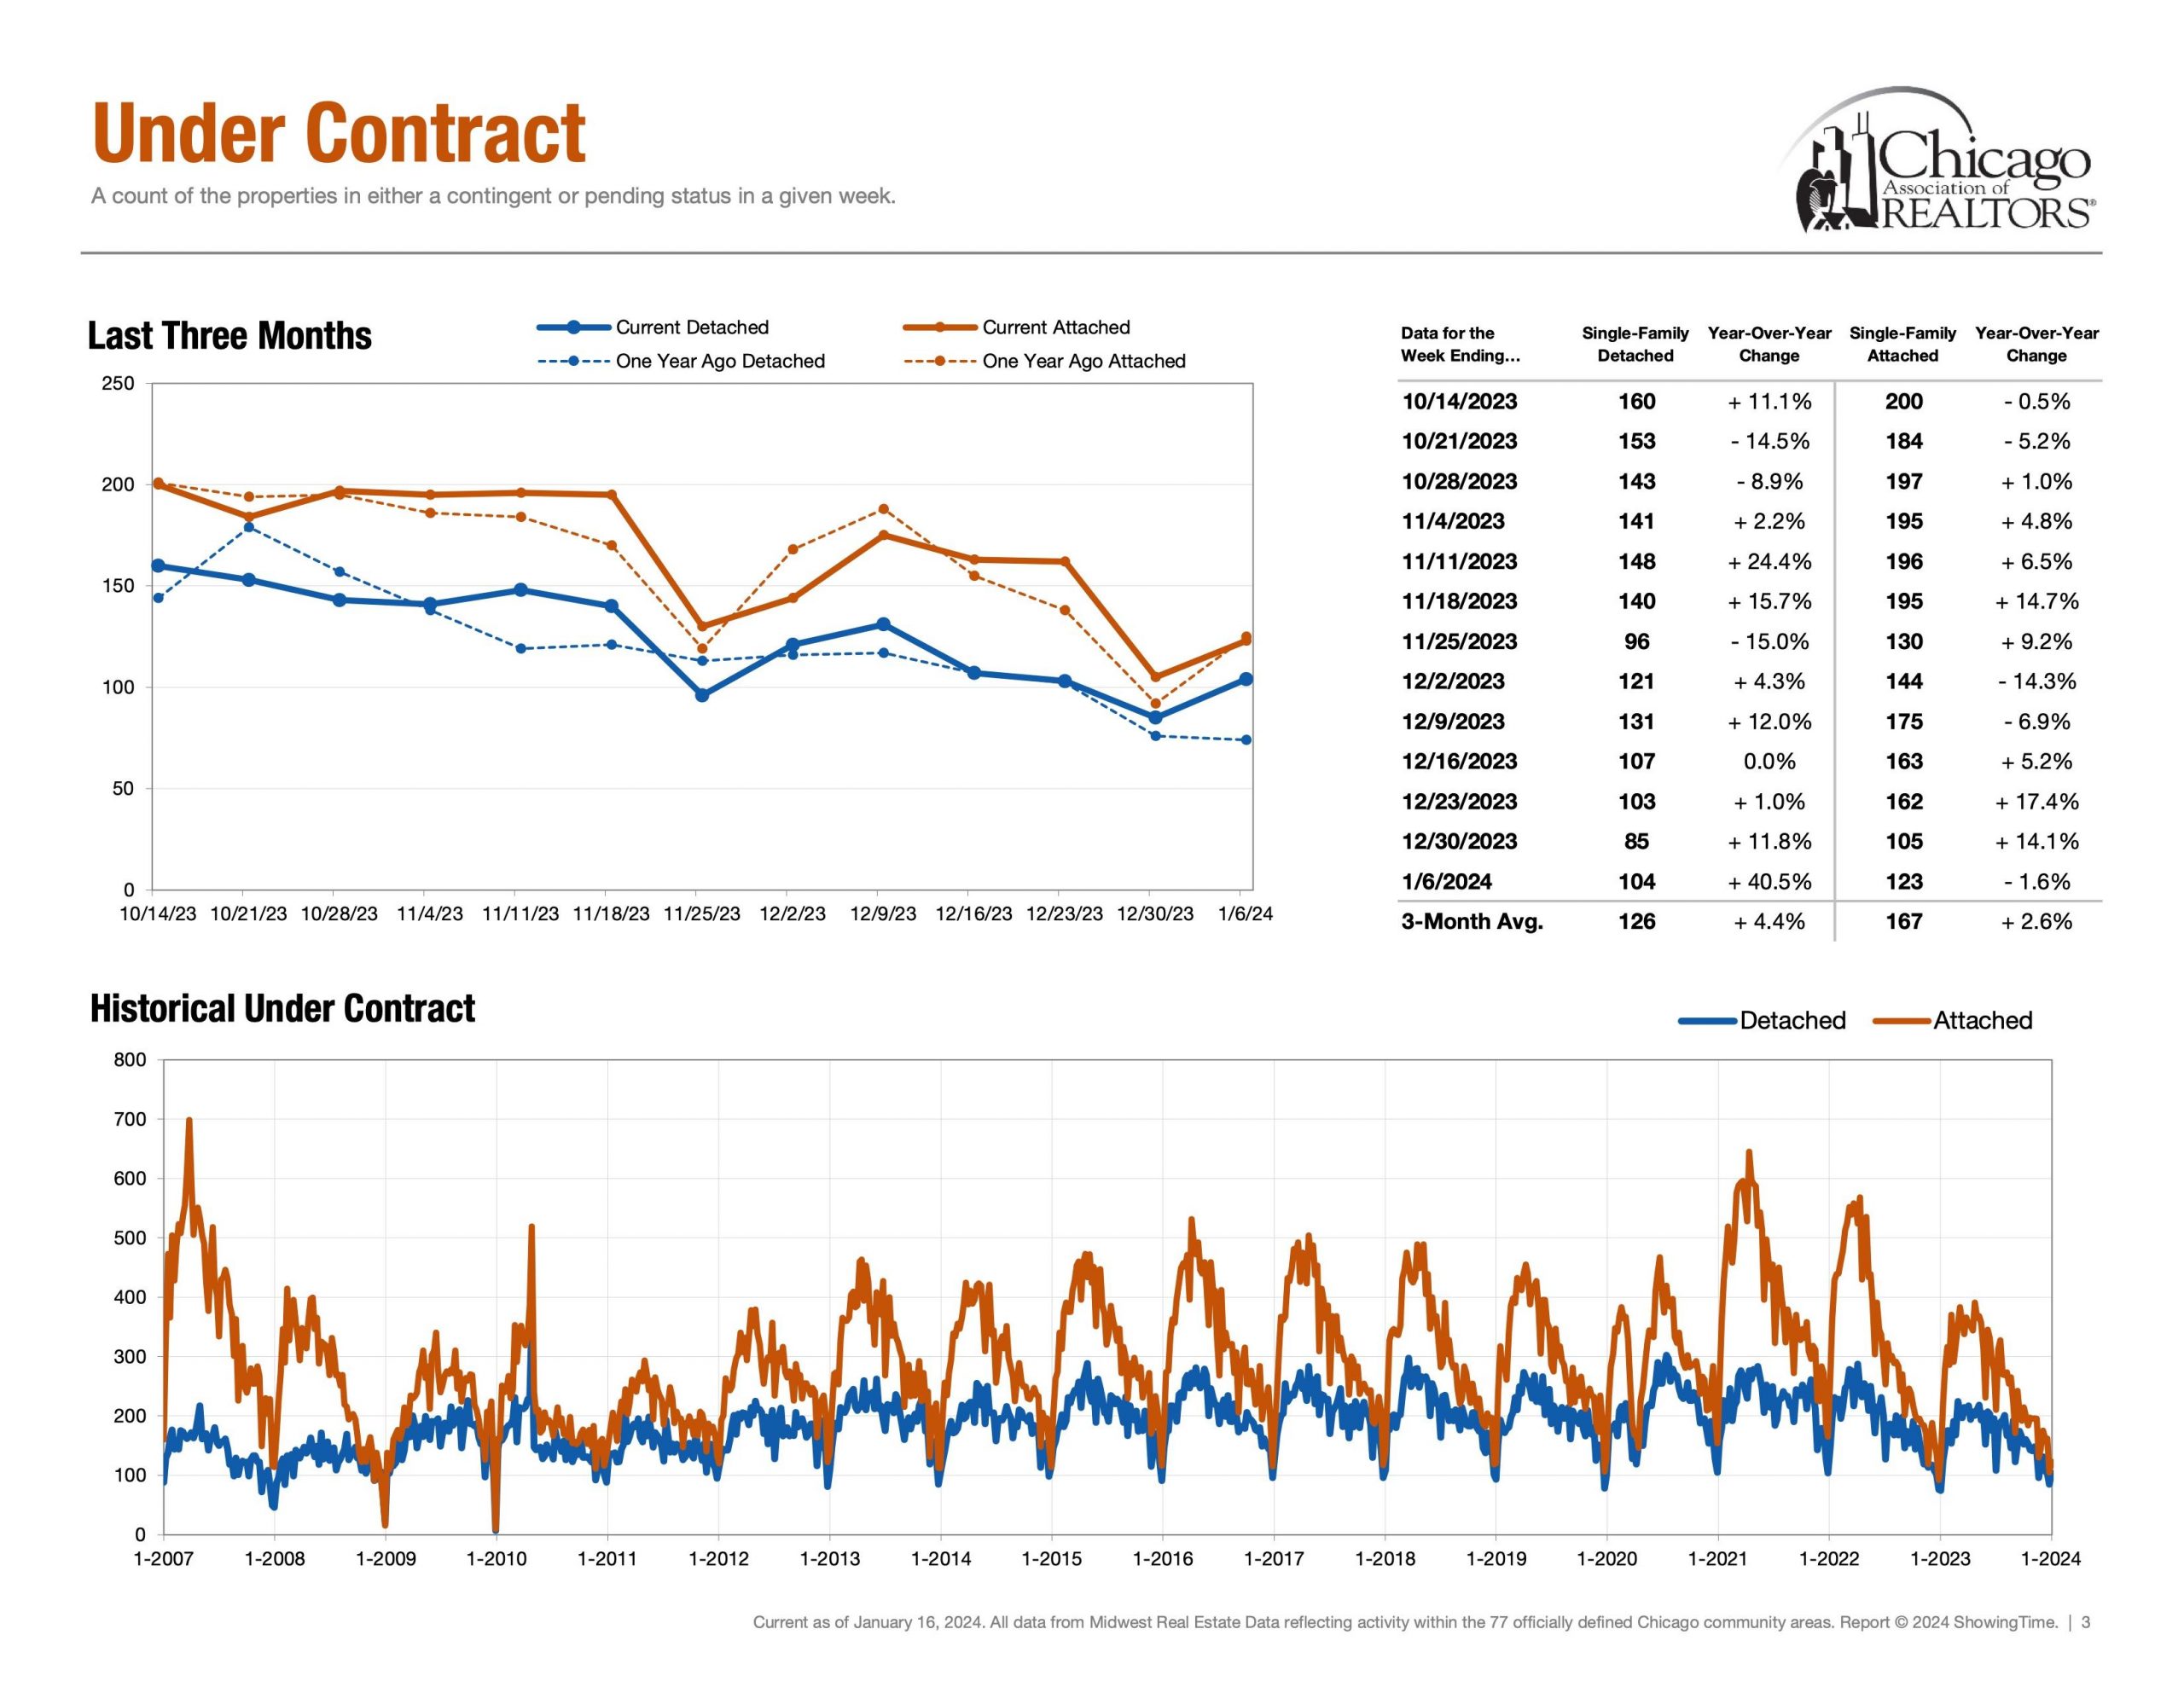
Demand | Under Contract
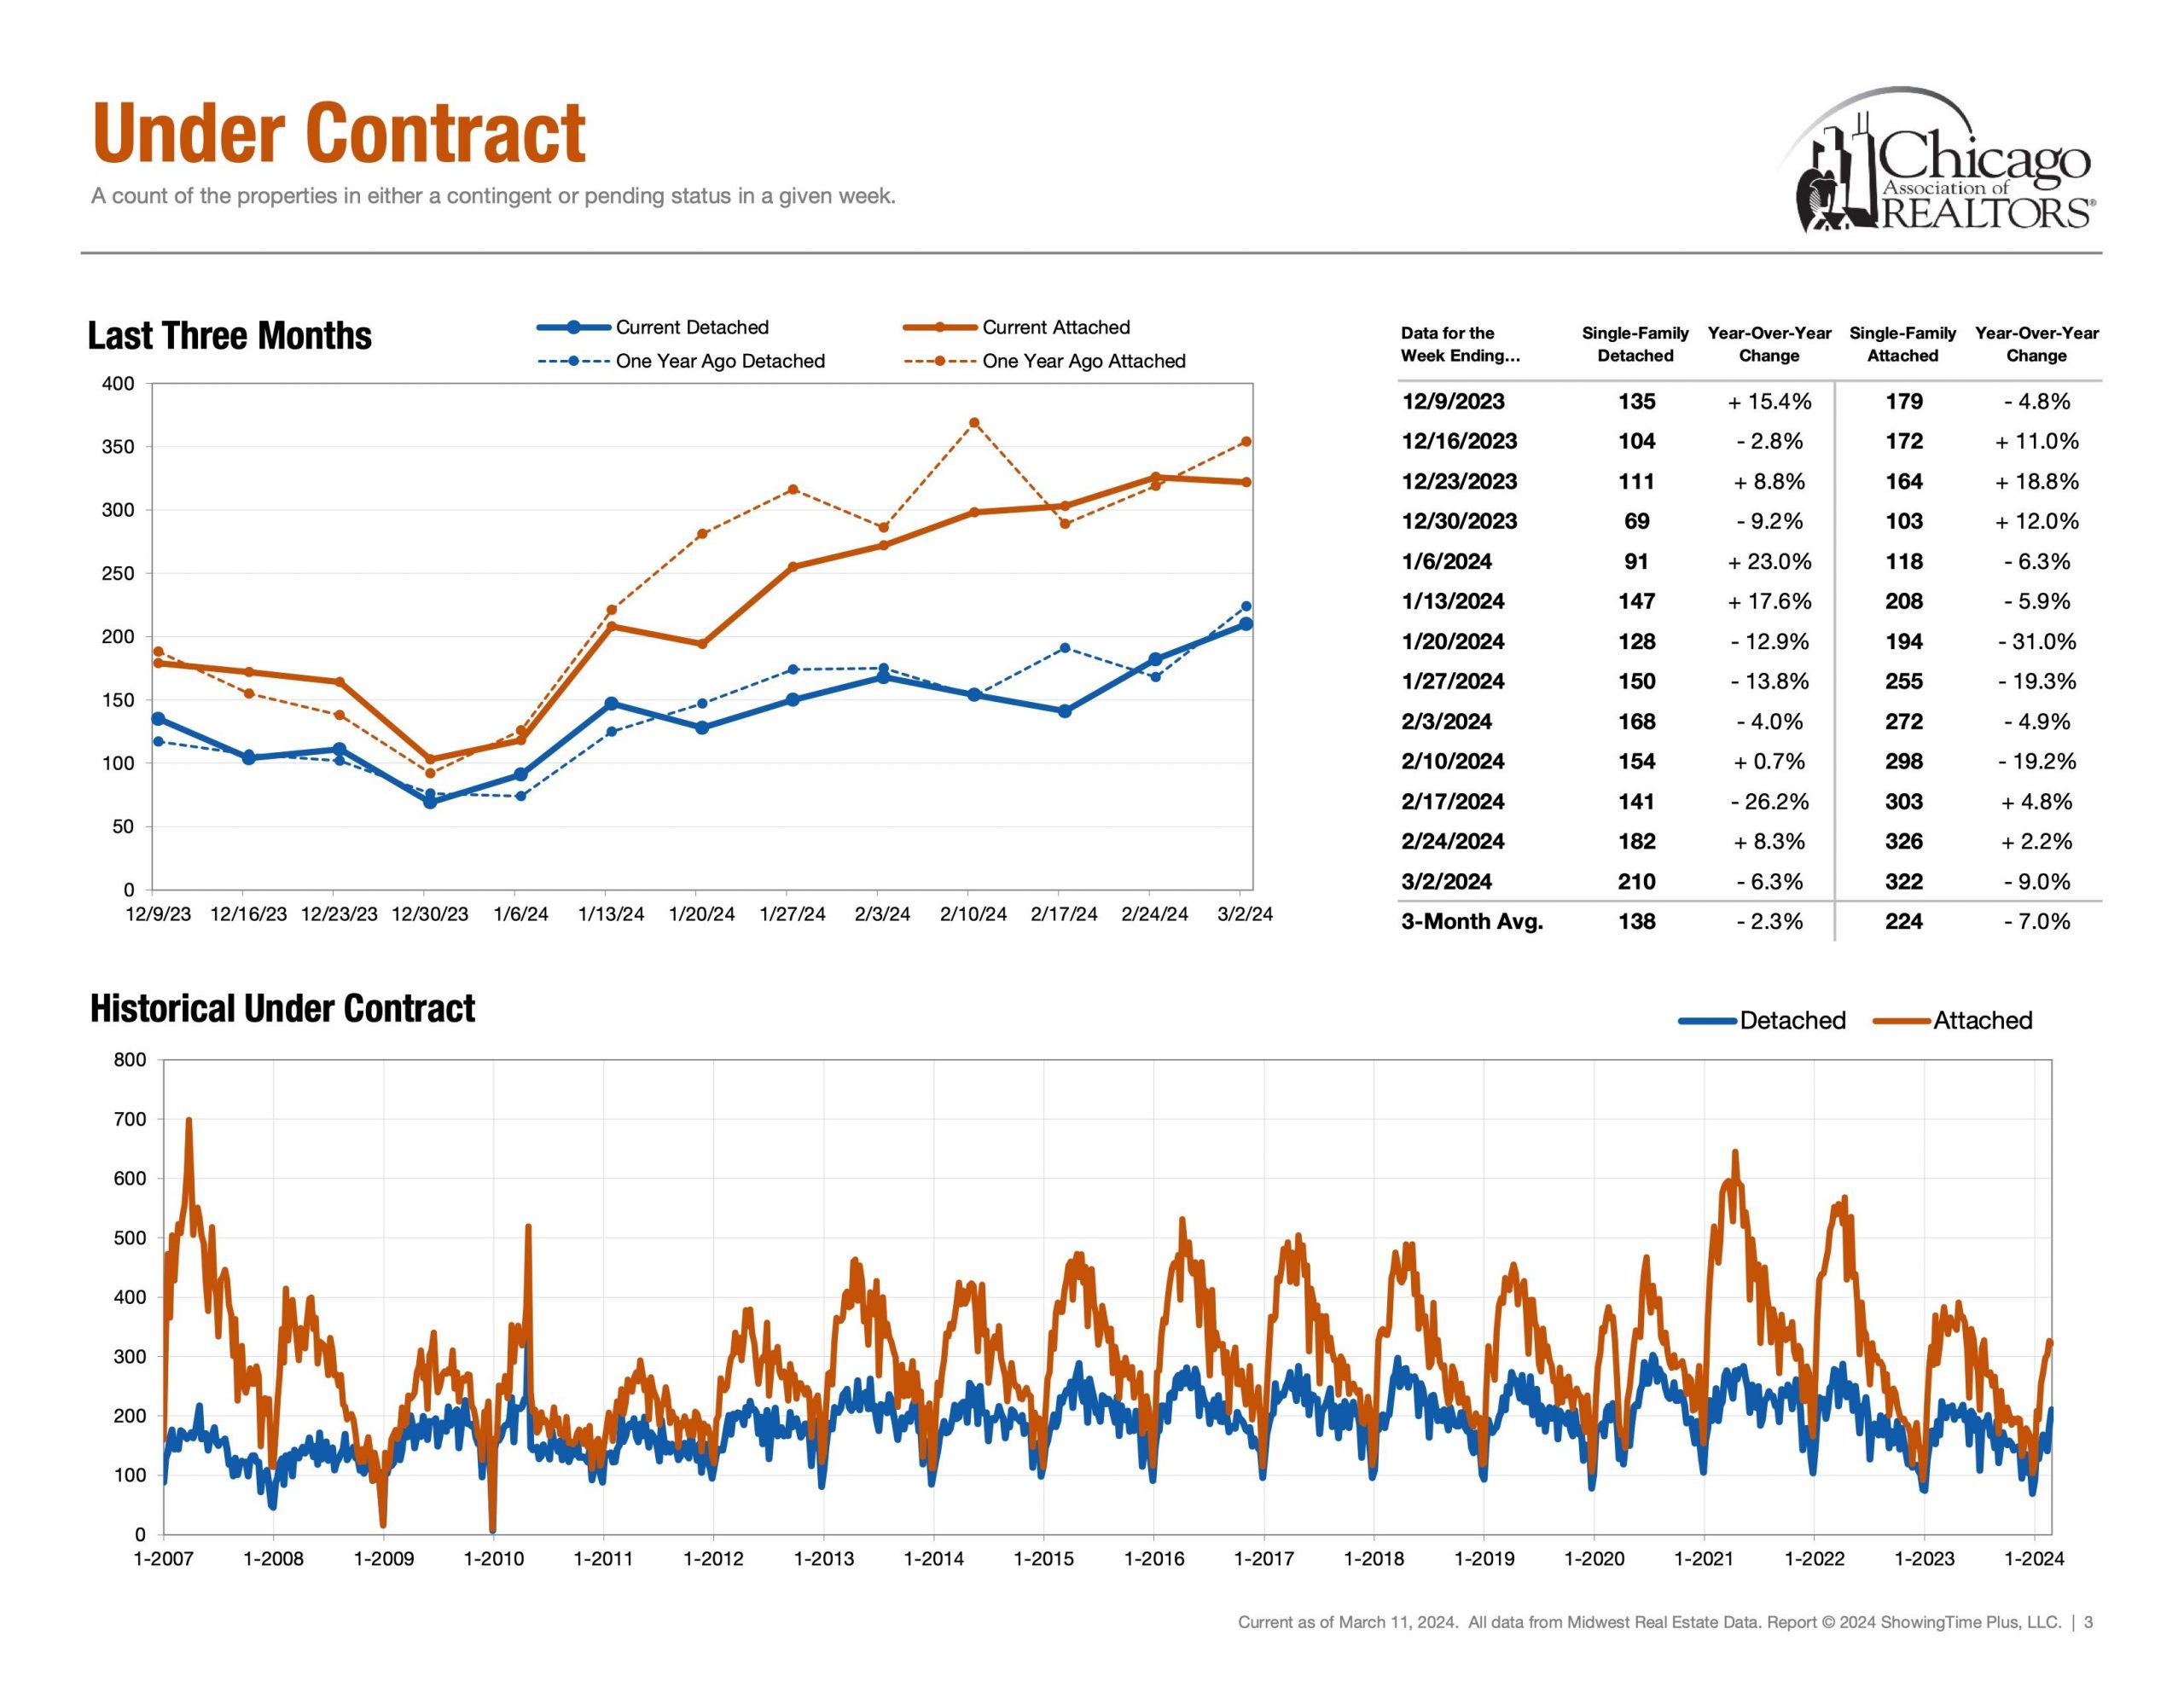
Detached Single = 210 Properties (Feb 25th – March 2nd)
Attached Single = 322 Properties (Feb 25th – March 2nd)
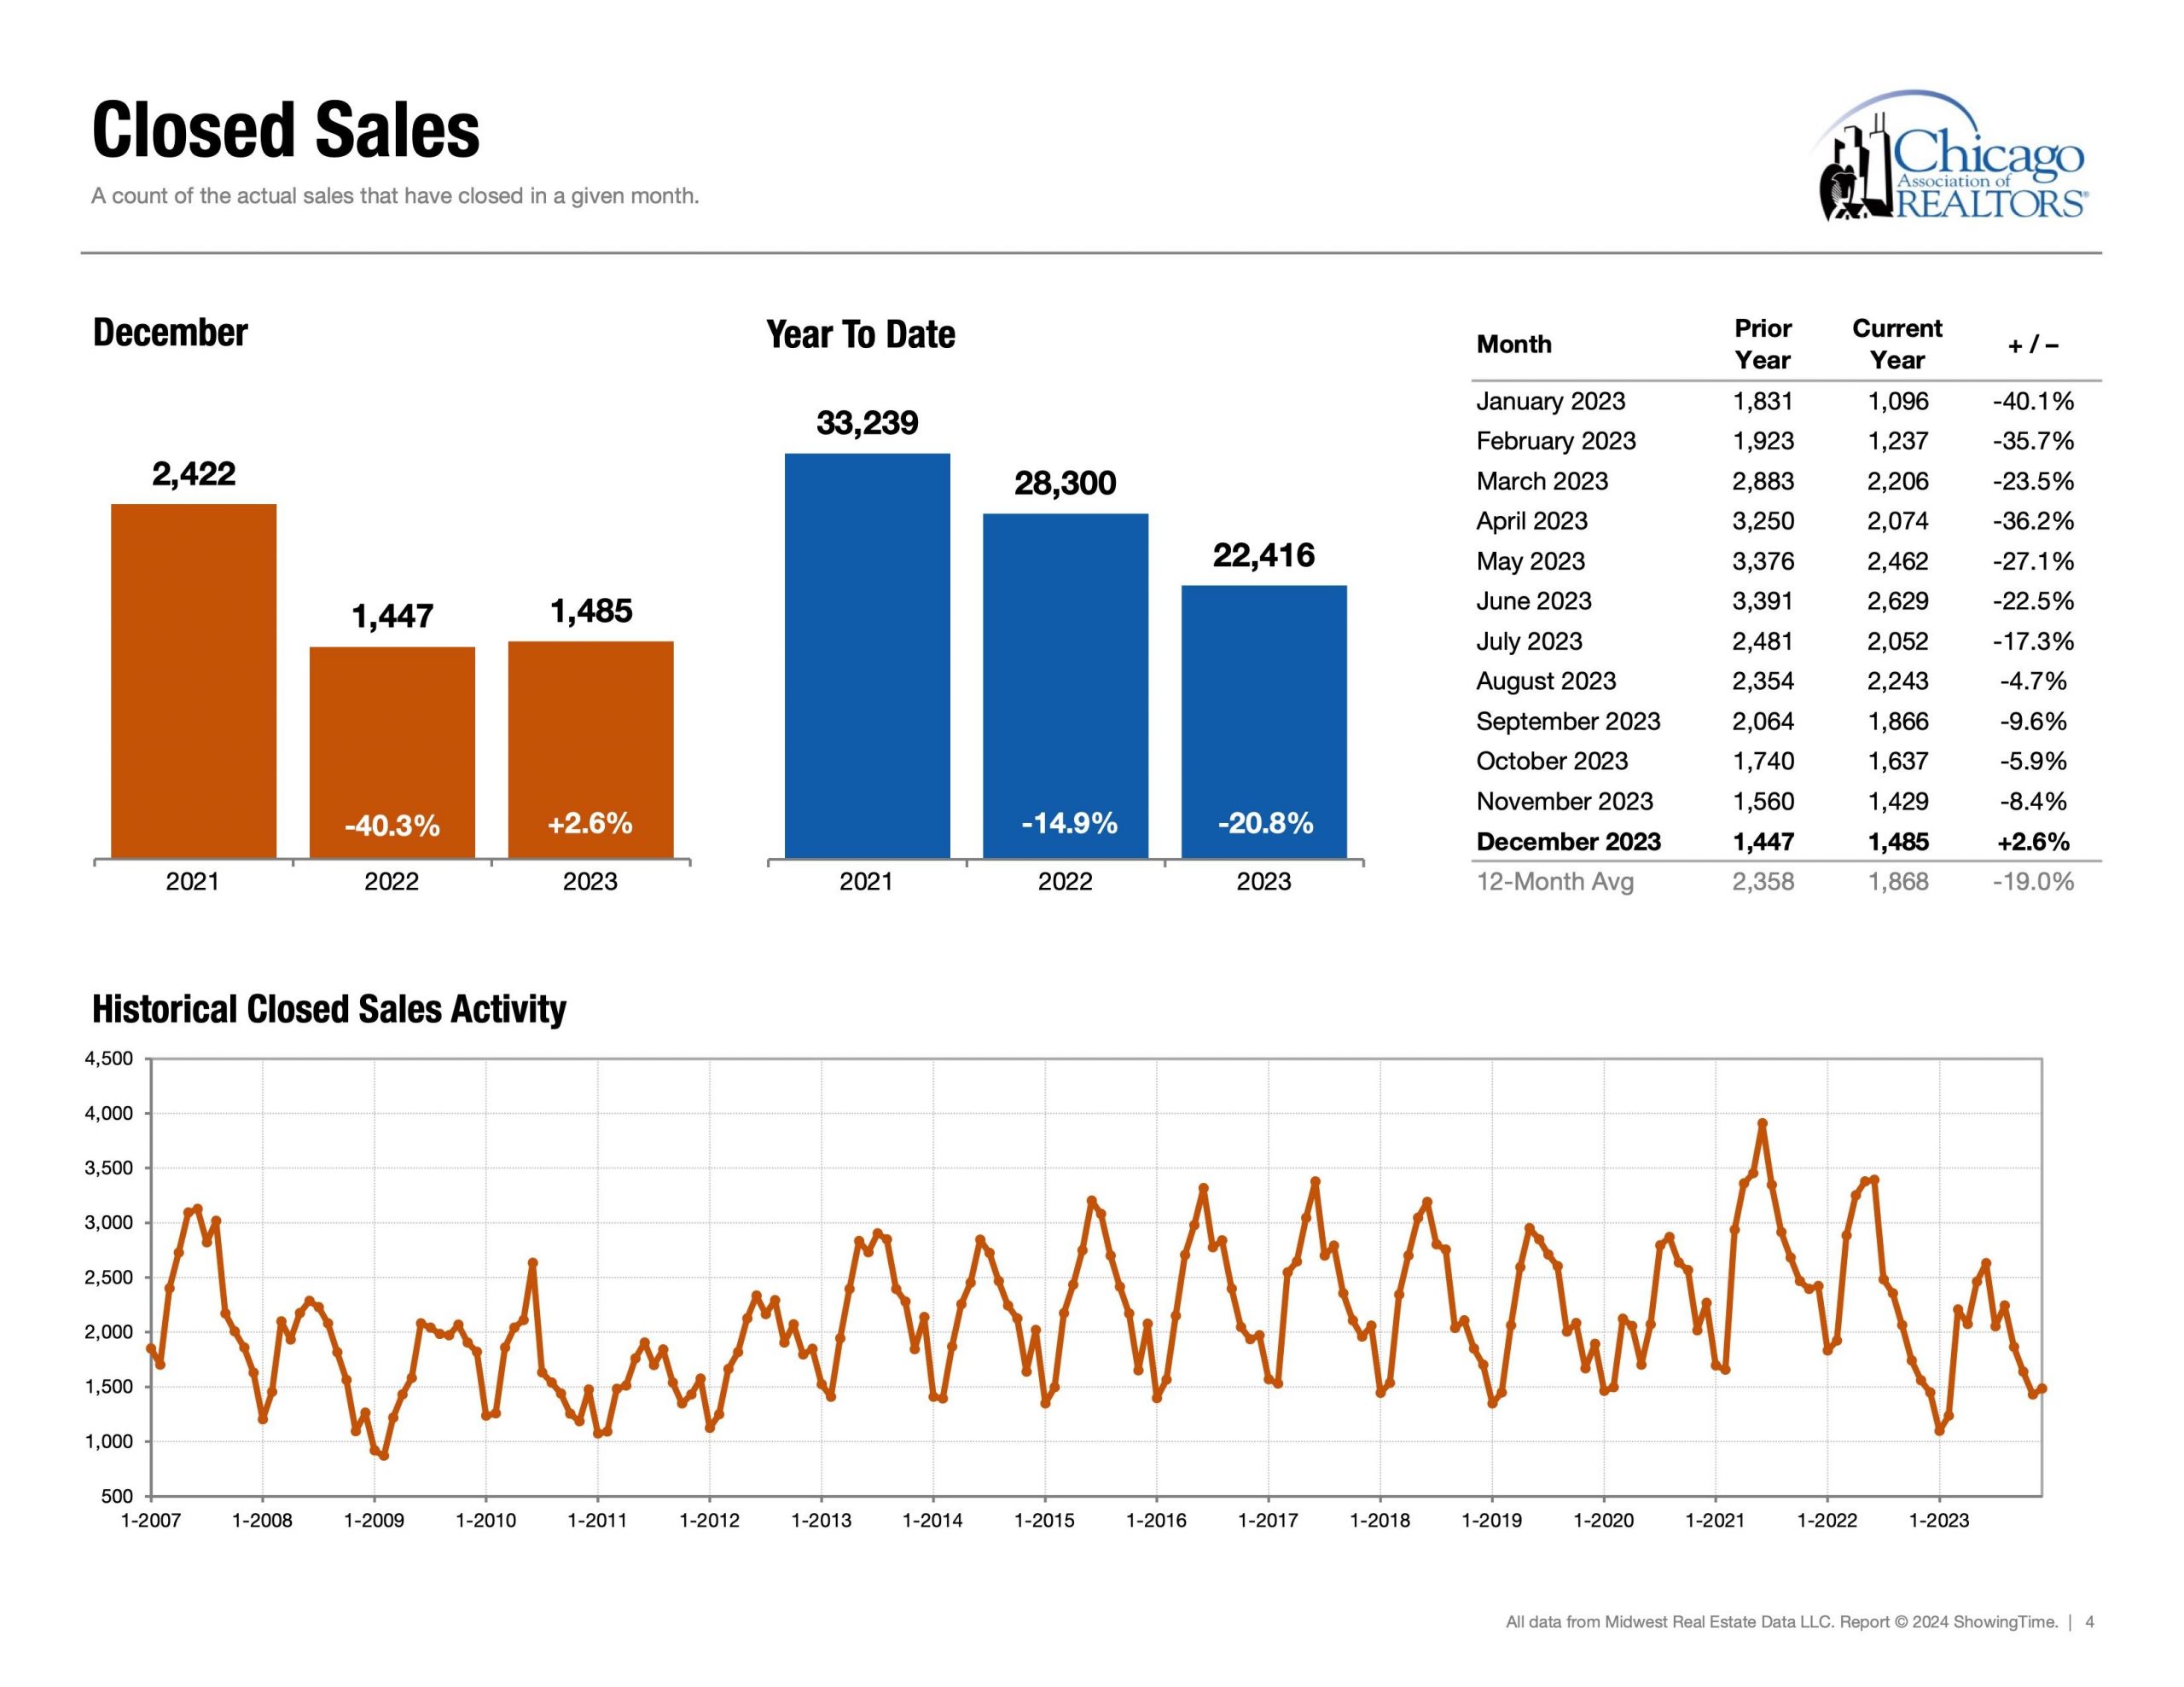
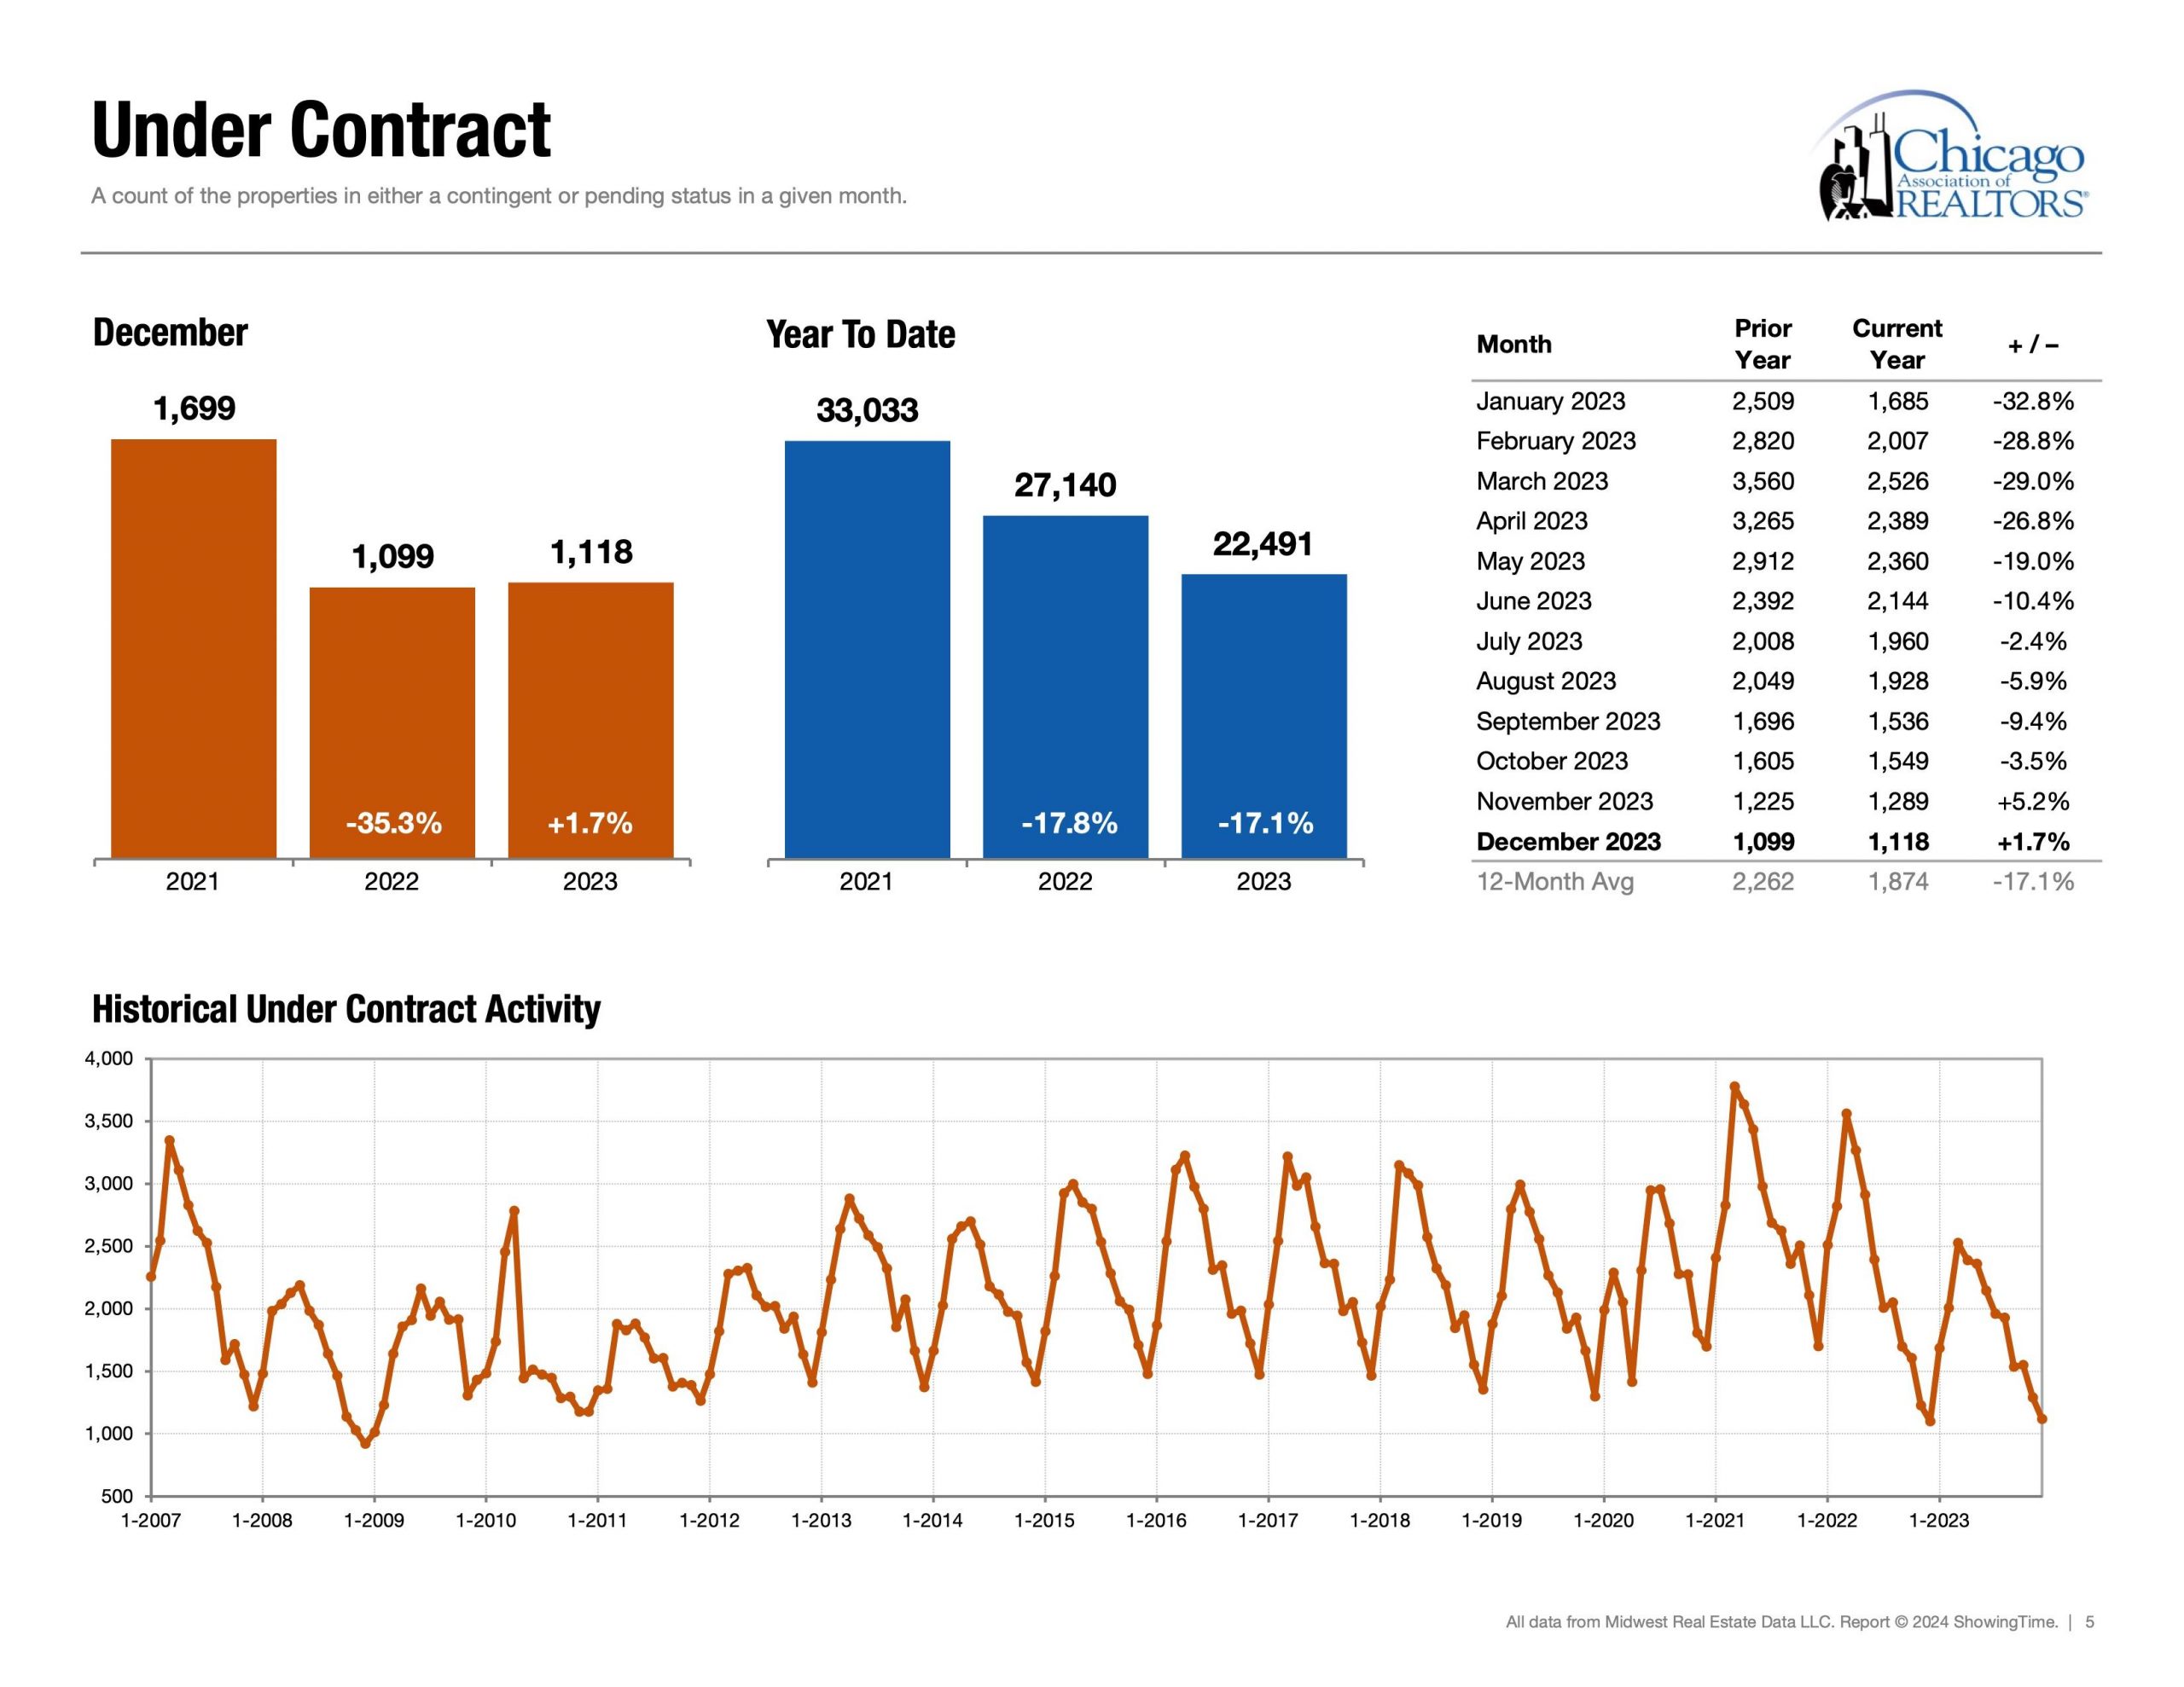
Secondly, under contract helps answer the question, “In our current market, how many buyers are buying?” Showcasing the heartbeat of the real estate market. Interestingly, demand metrics become more insightful when compared and contrasted with supply/inventory metrics.
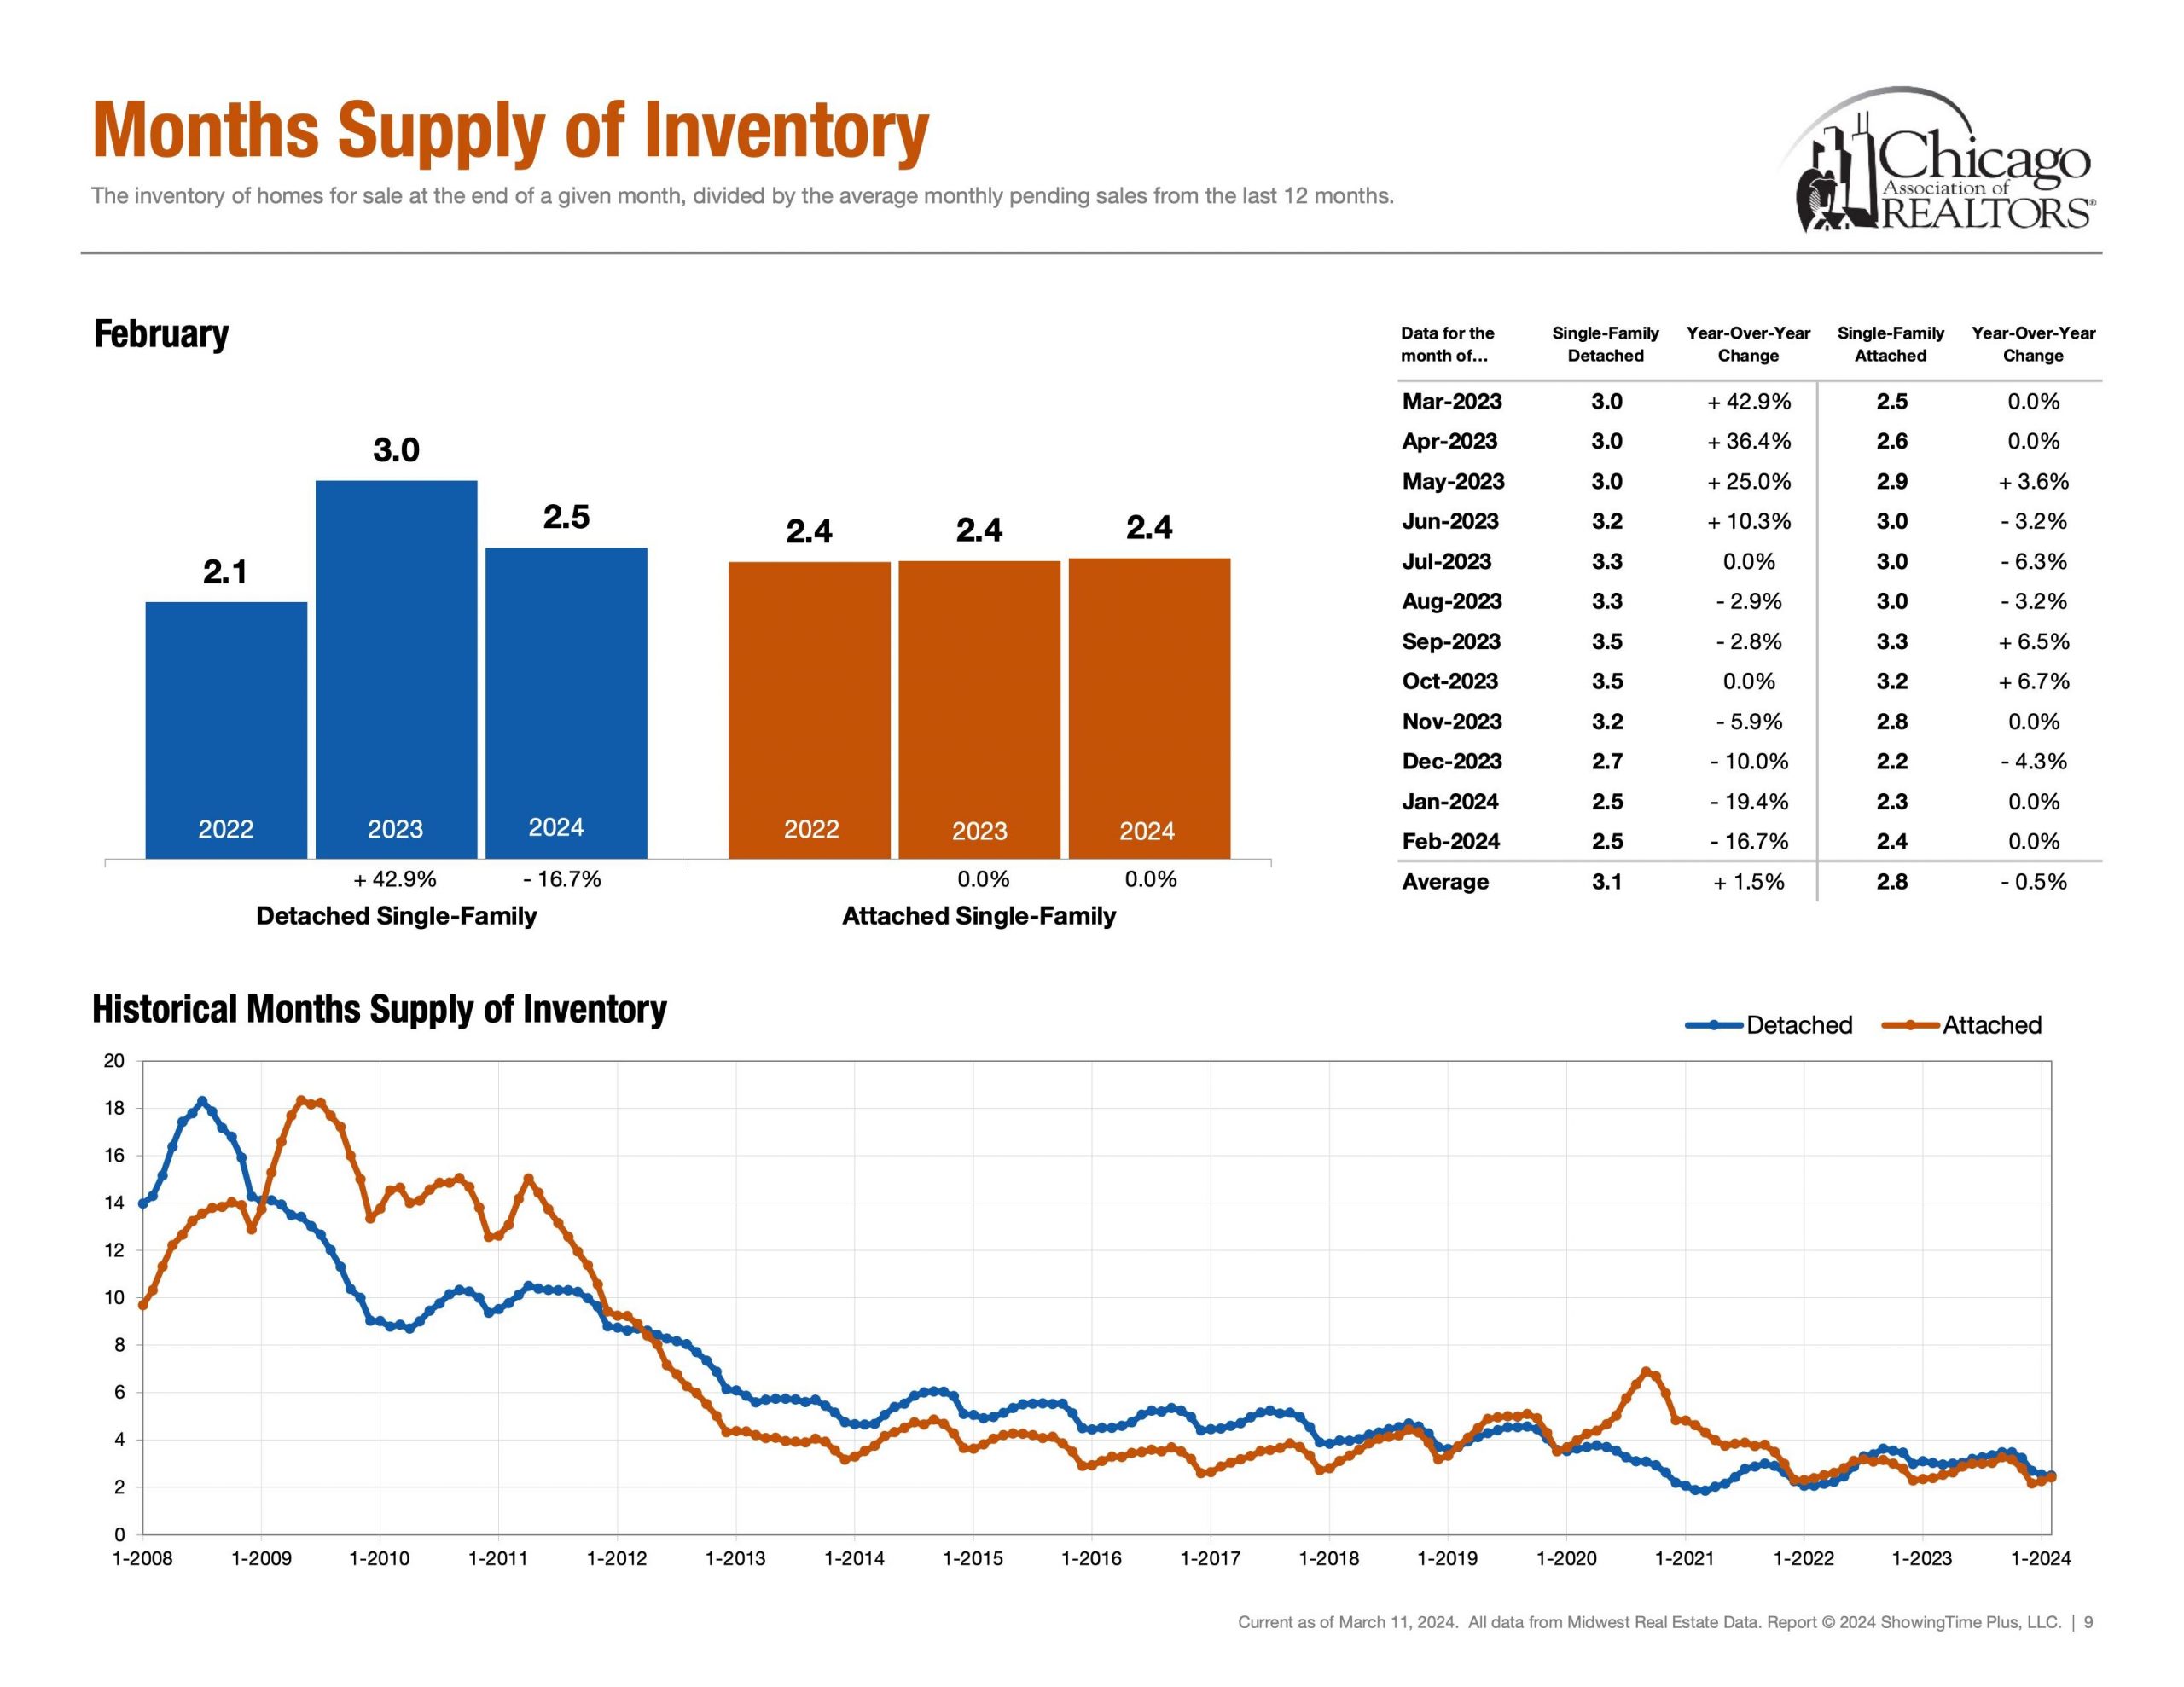
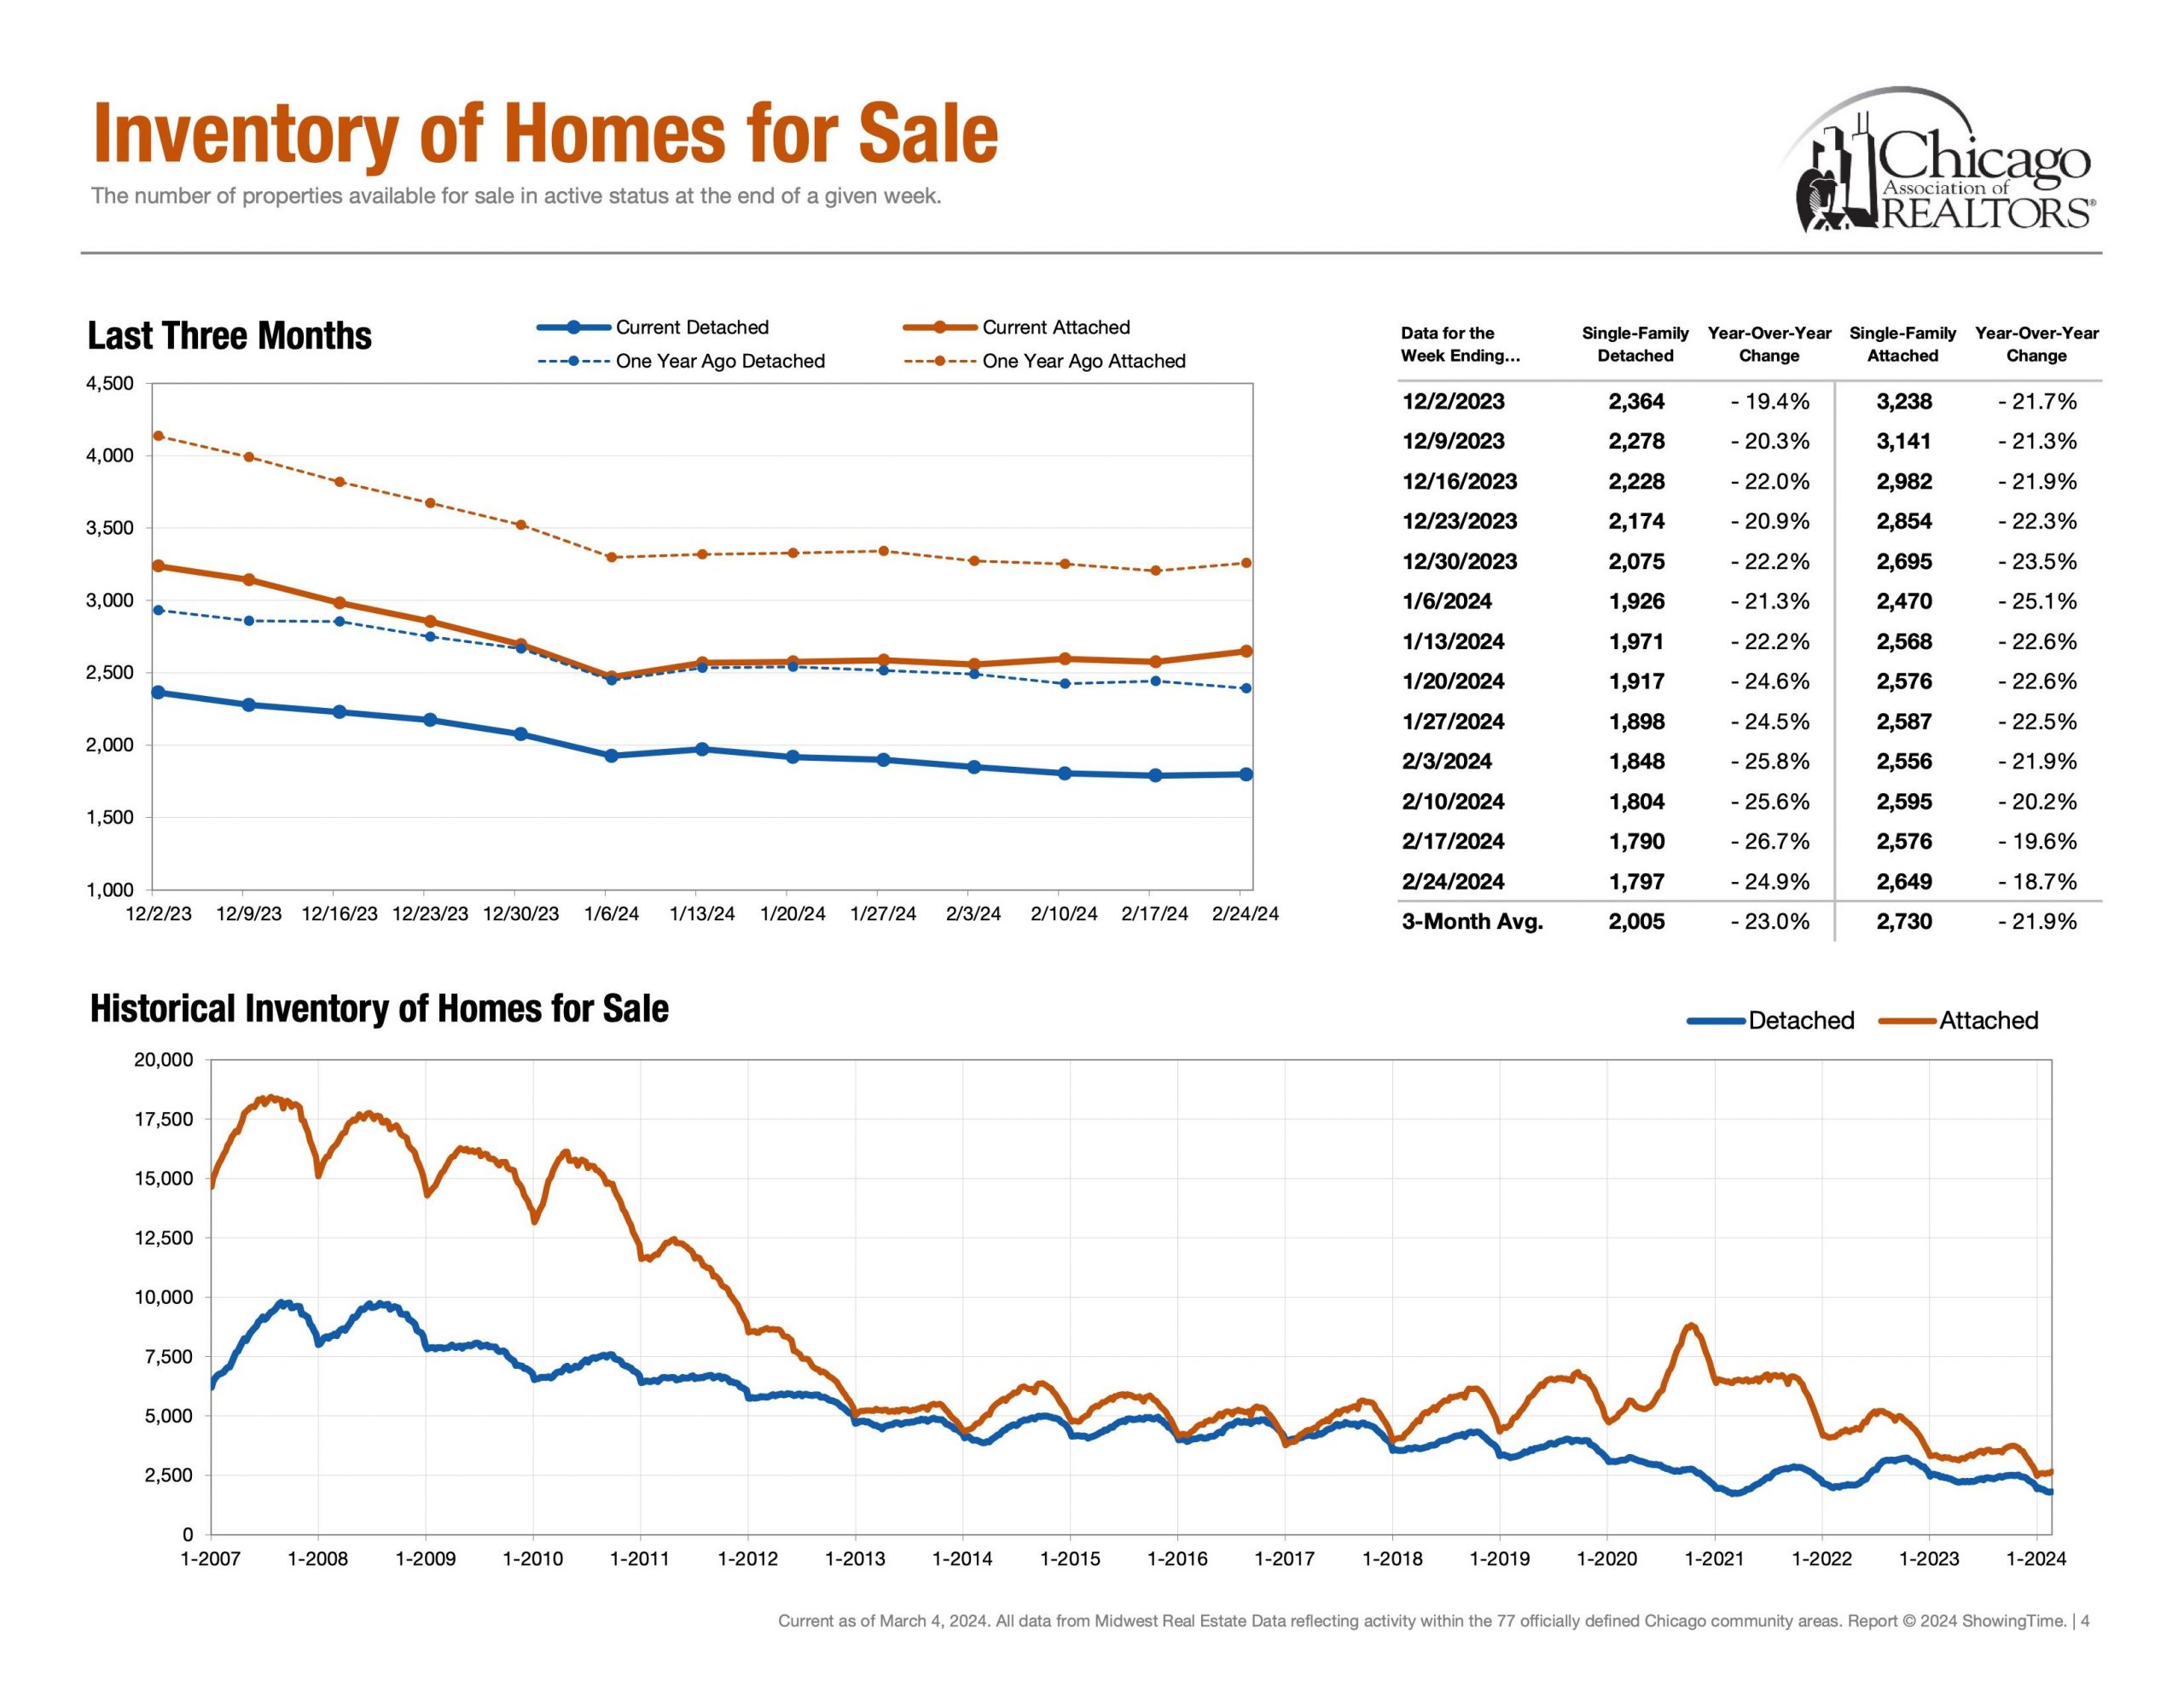
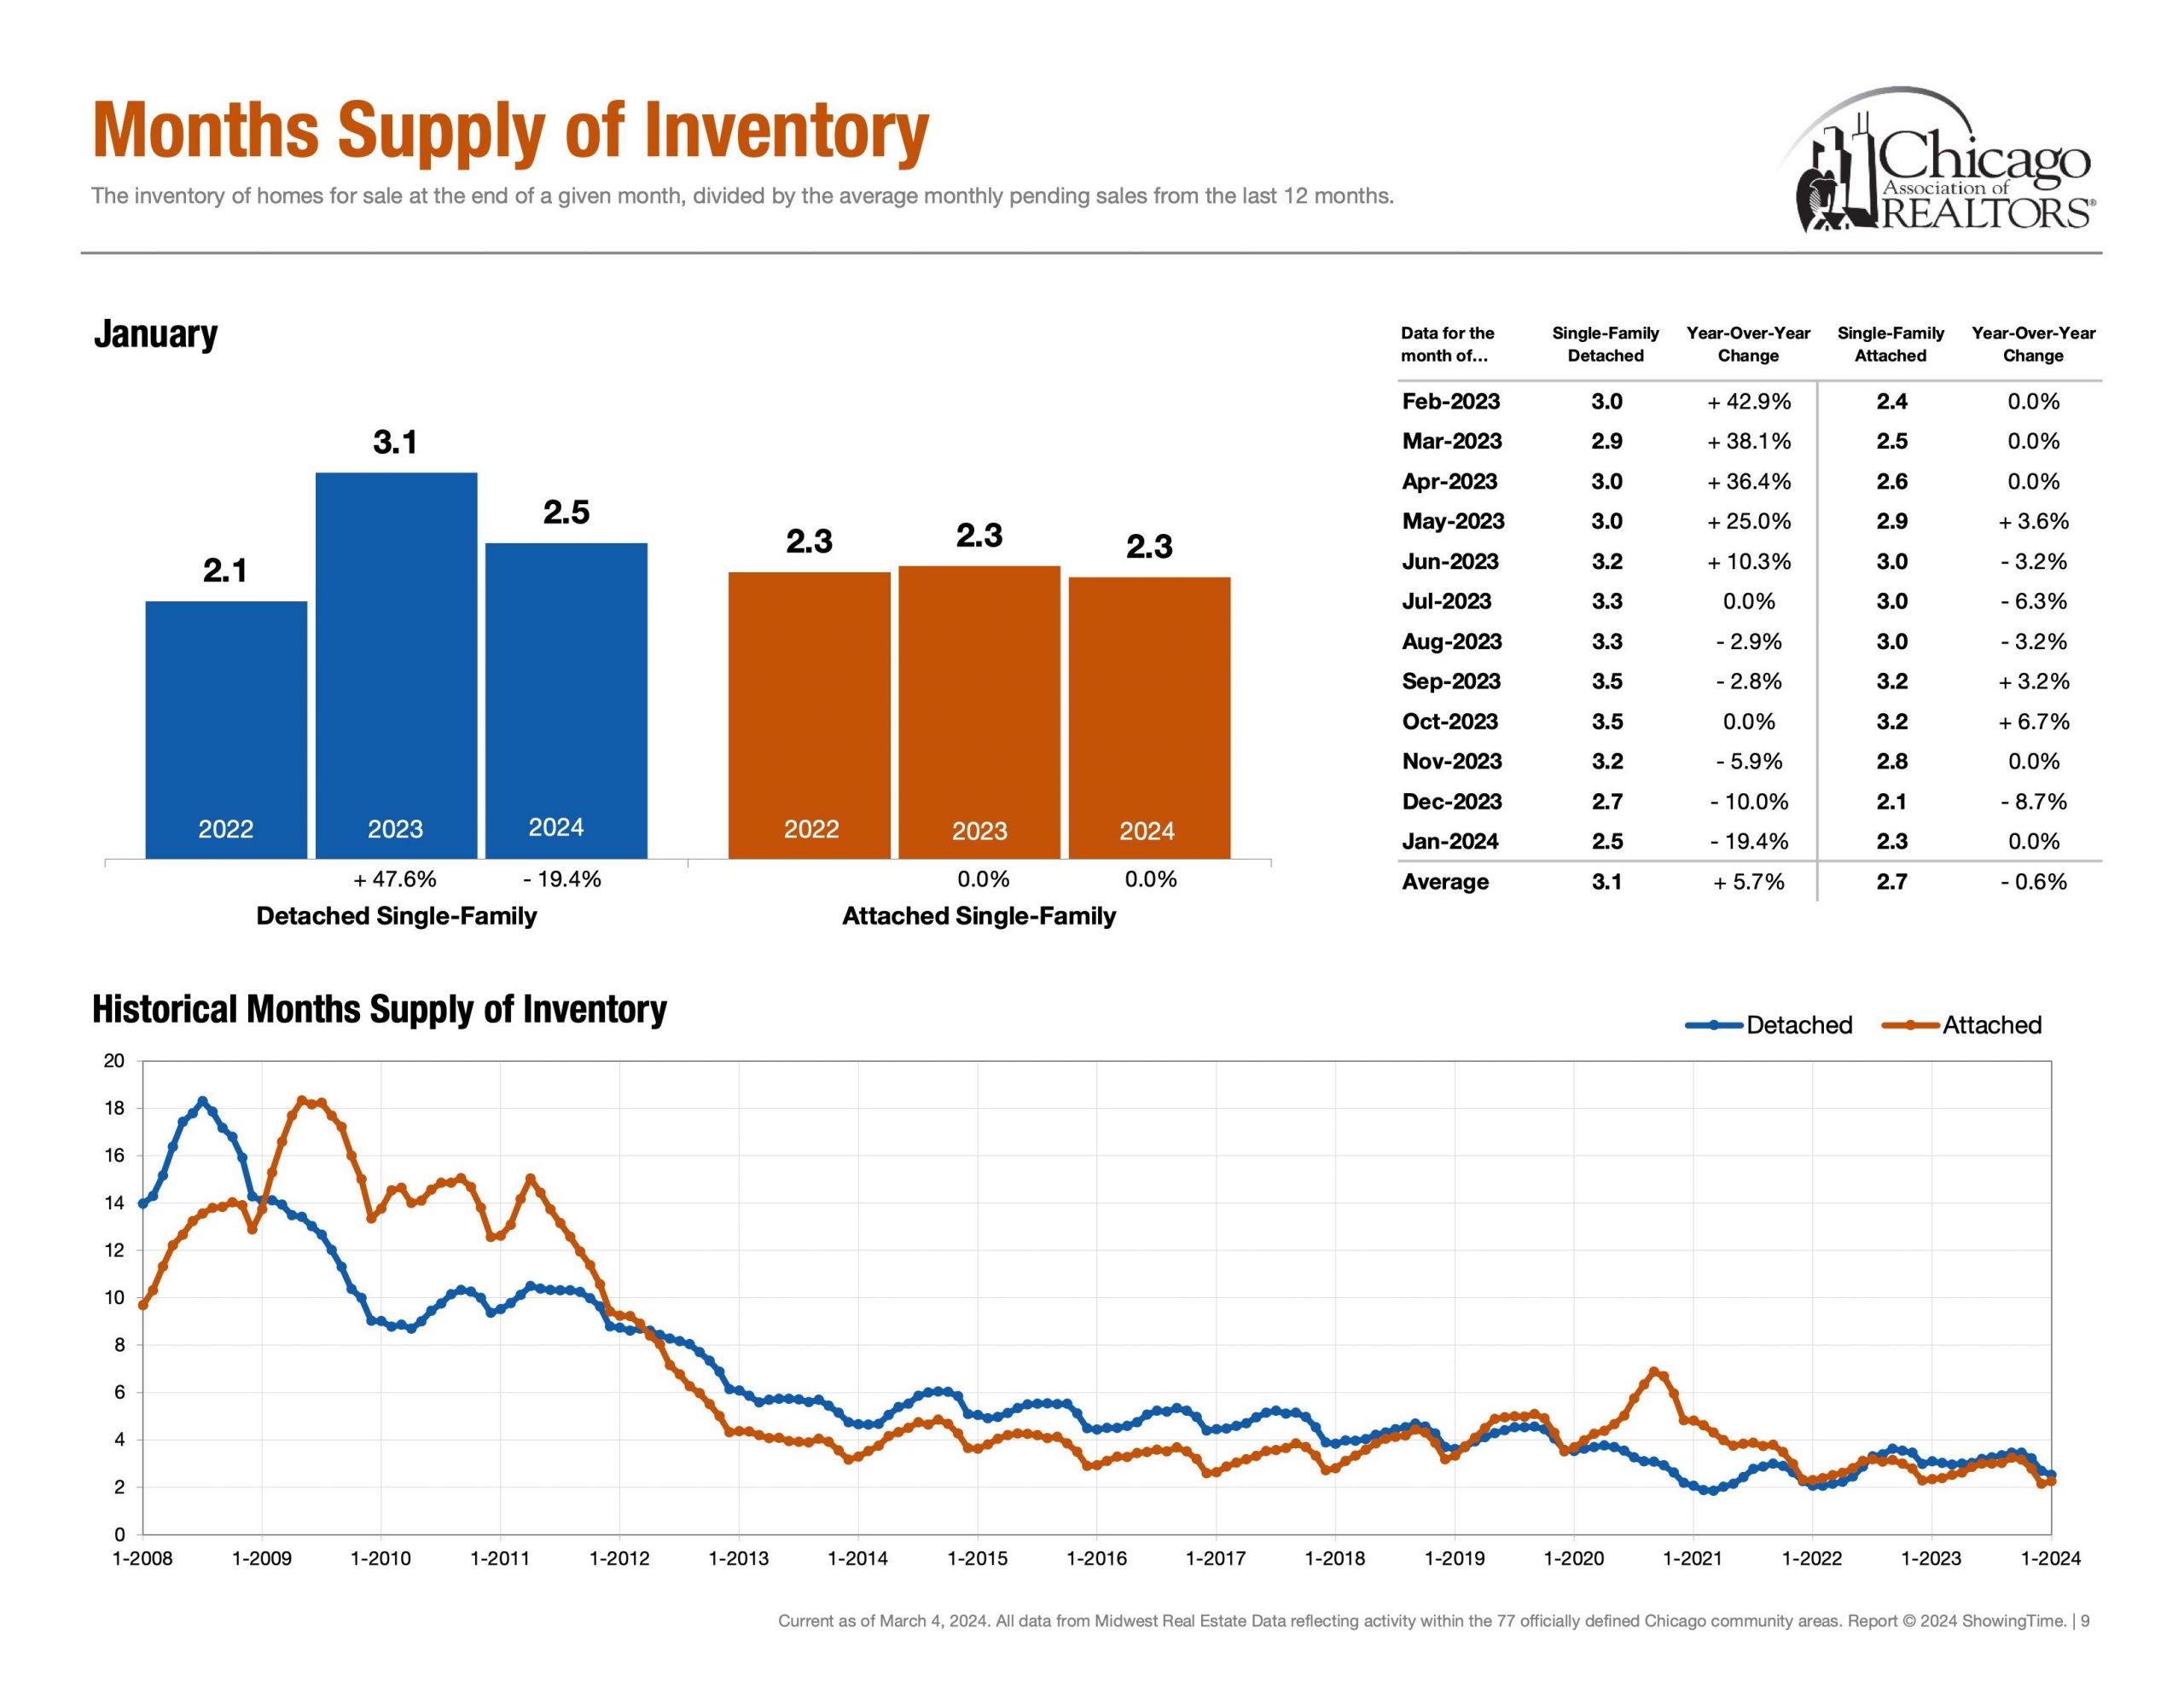
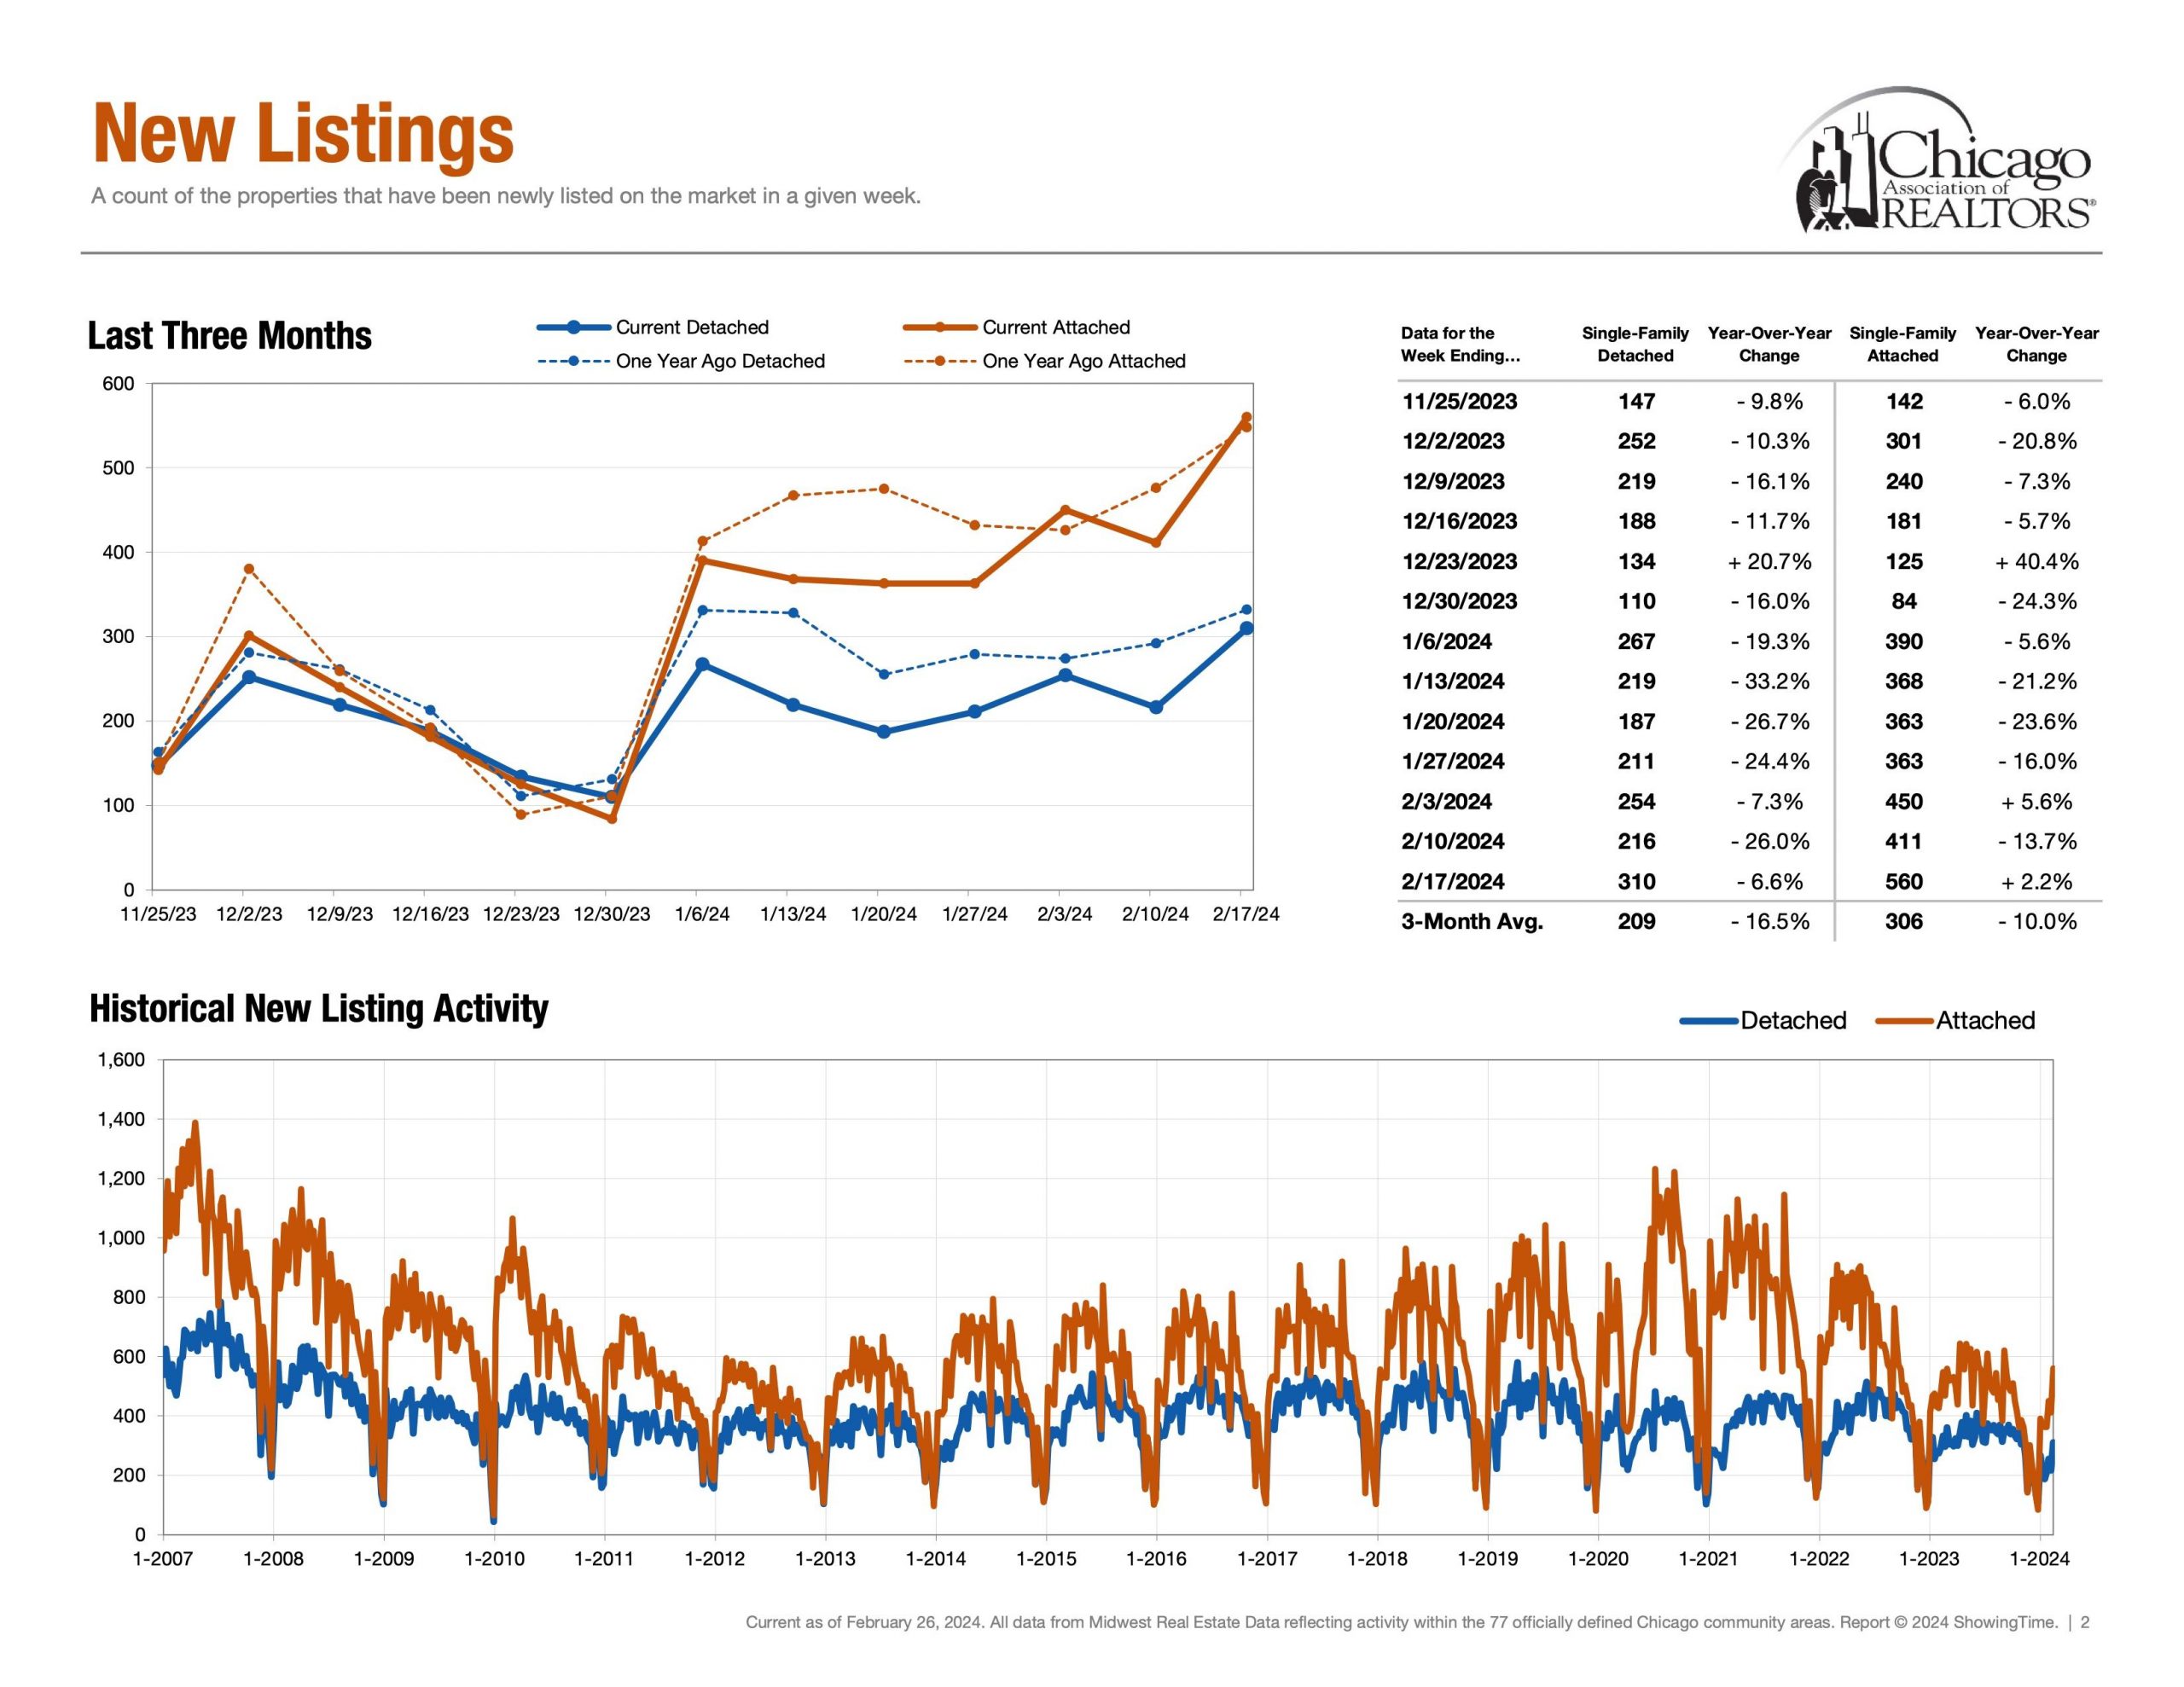
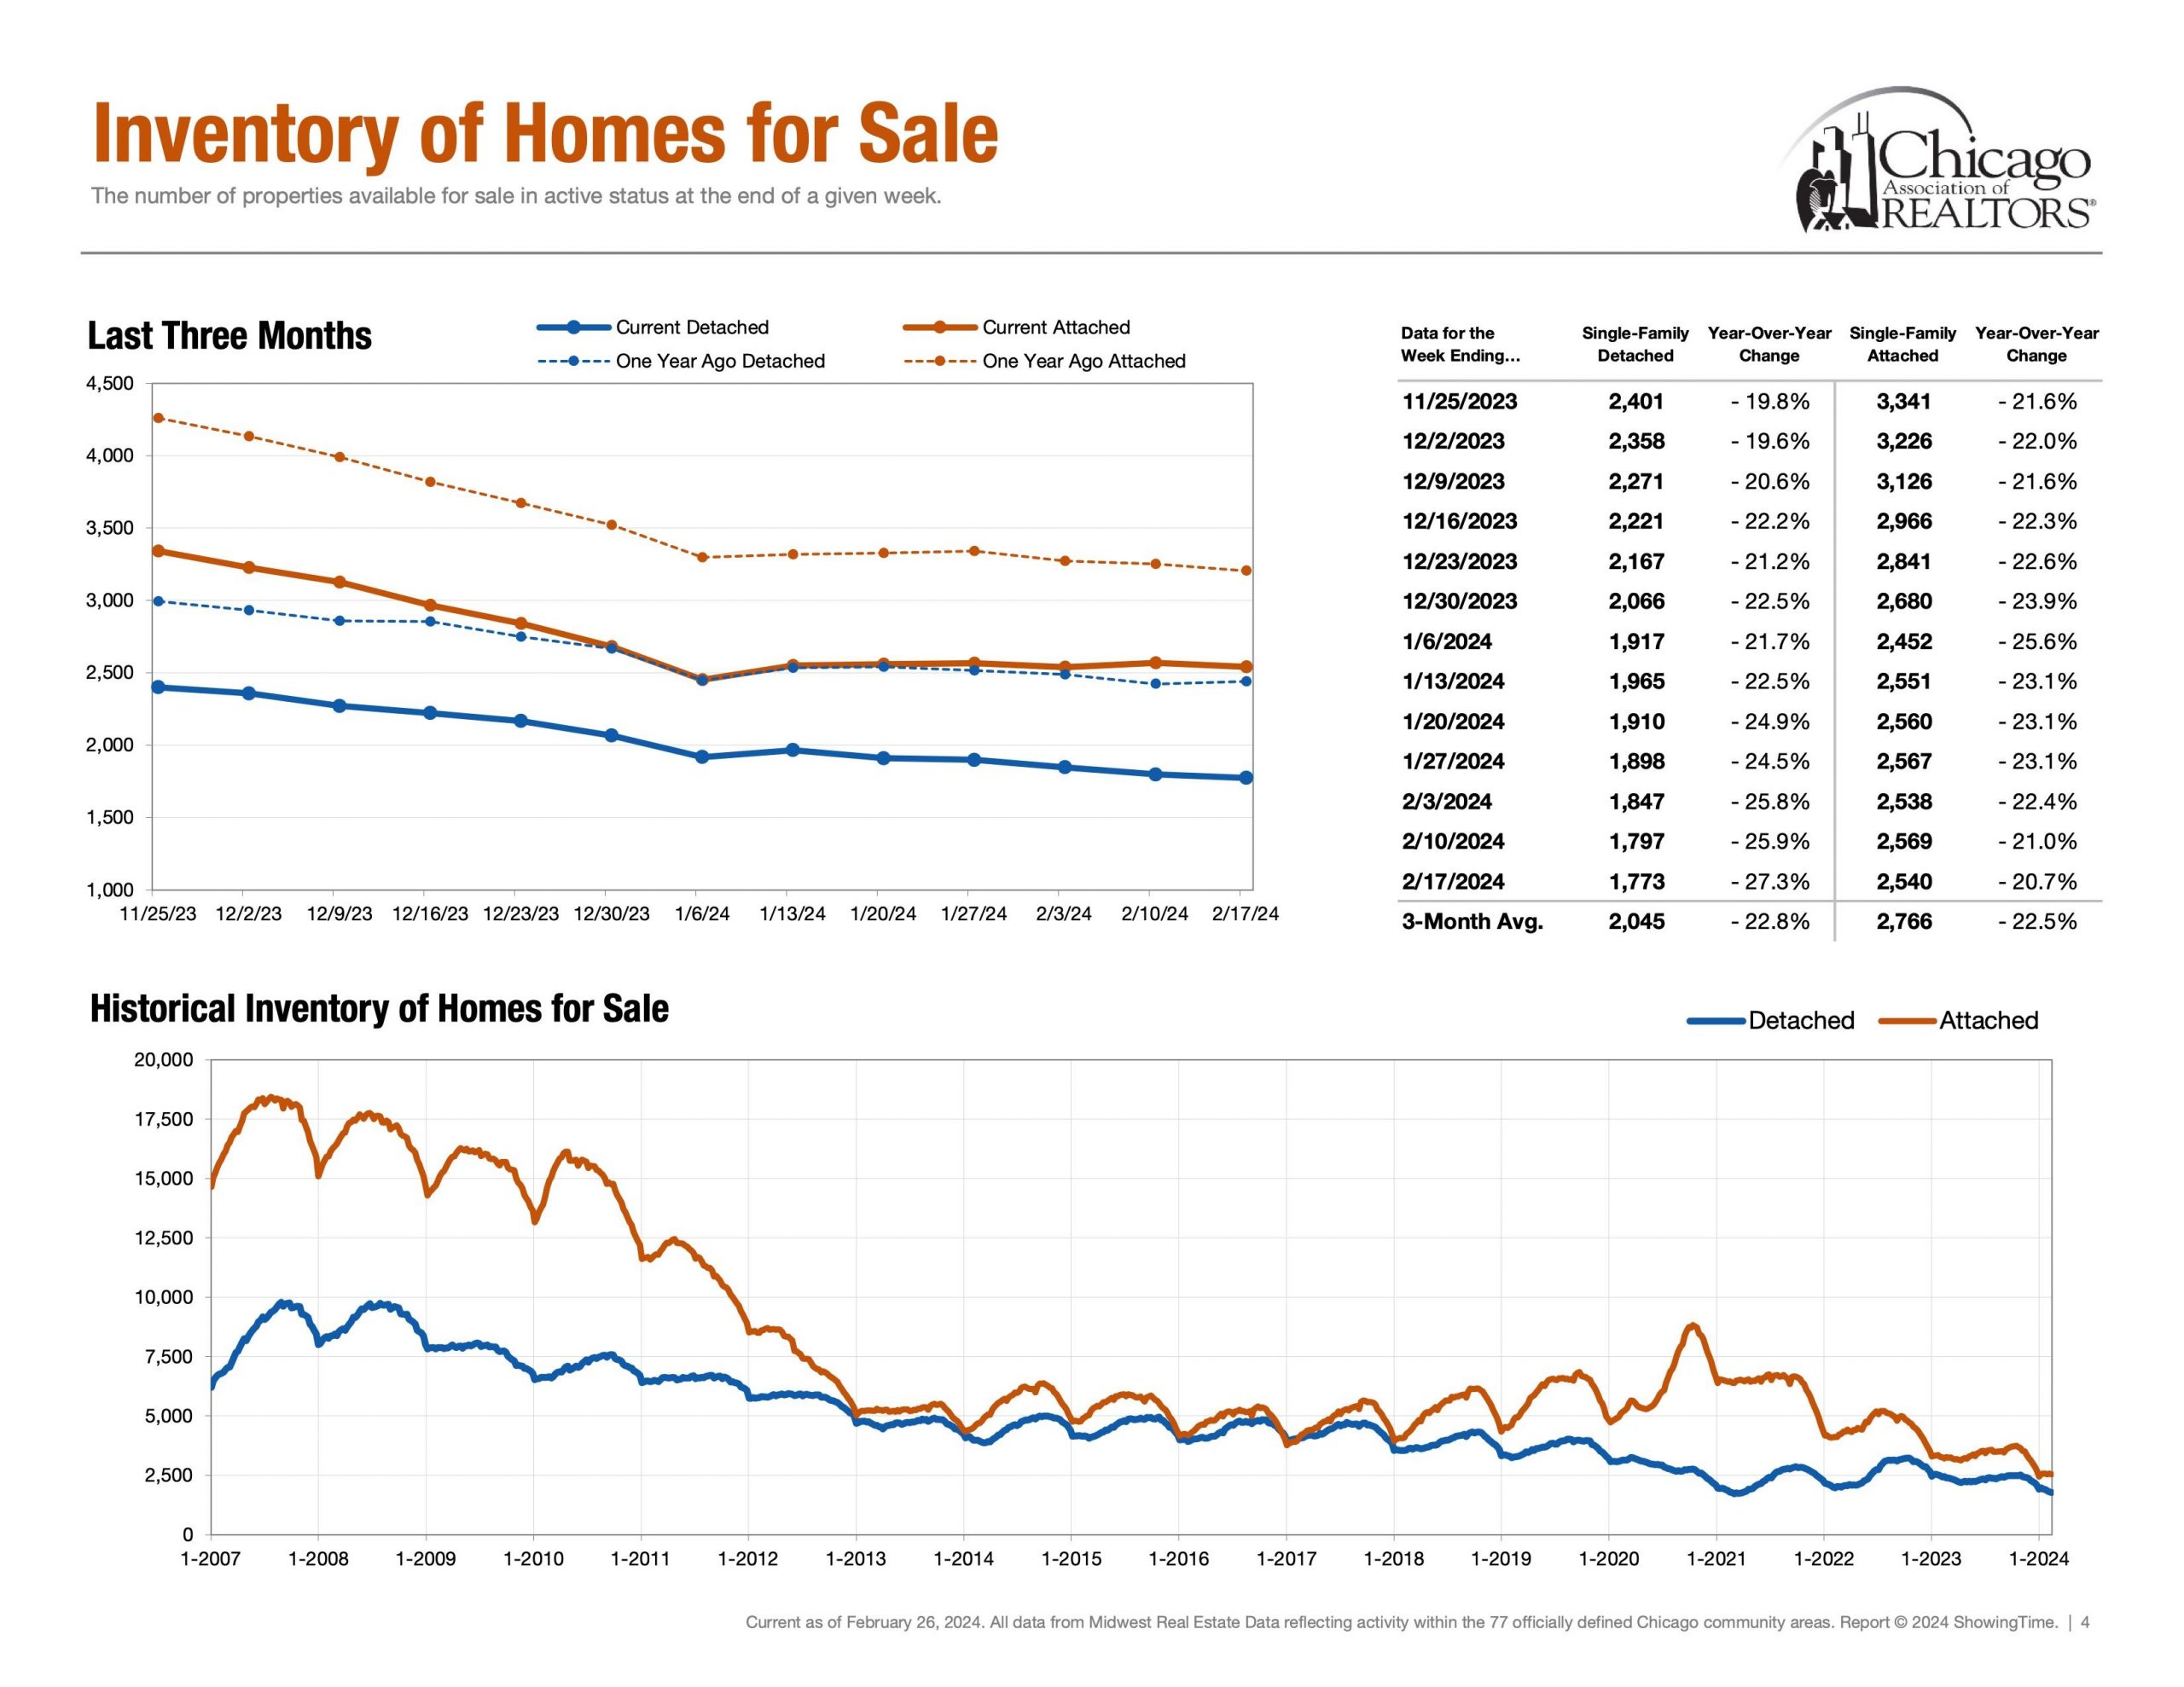
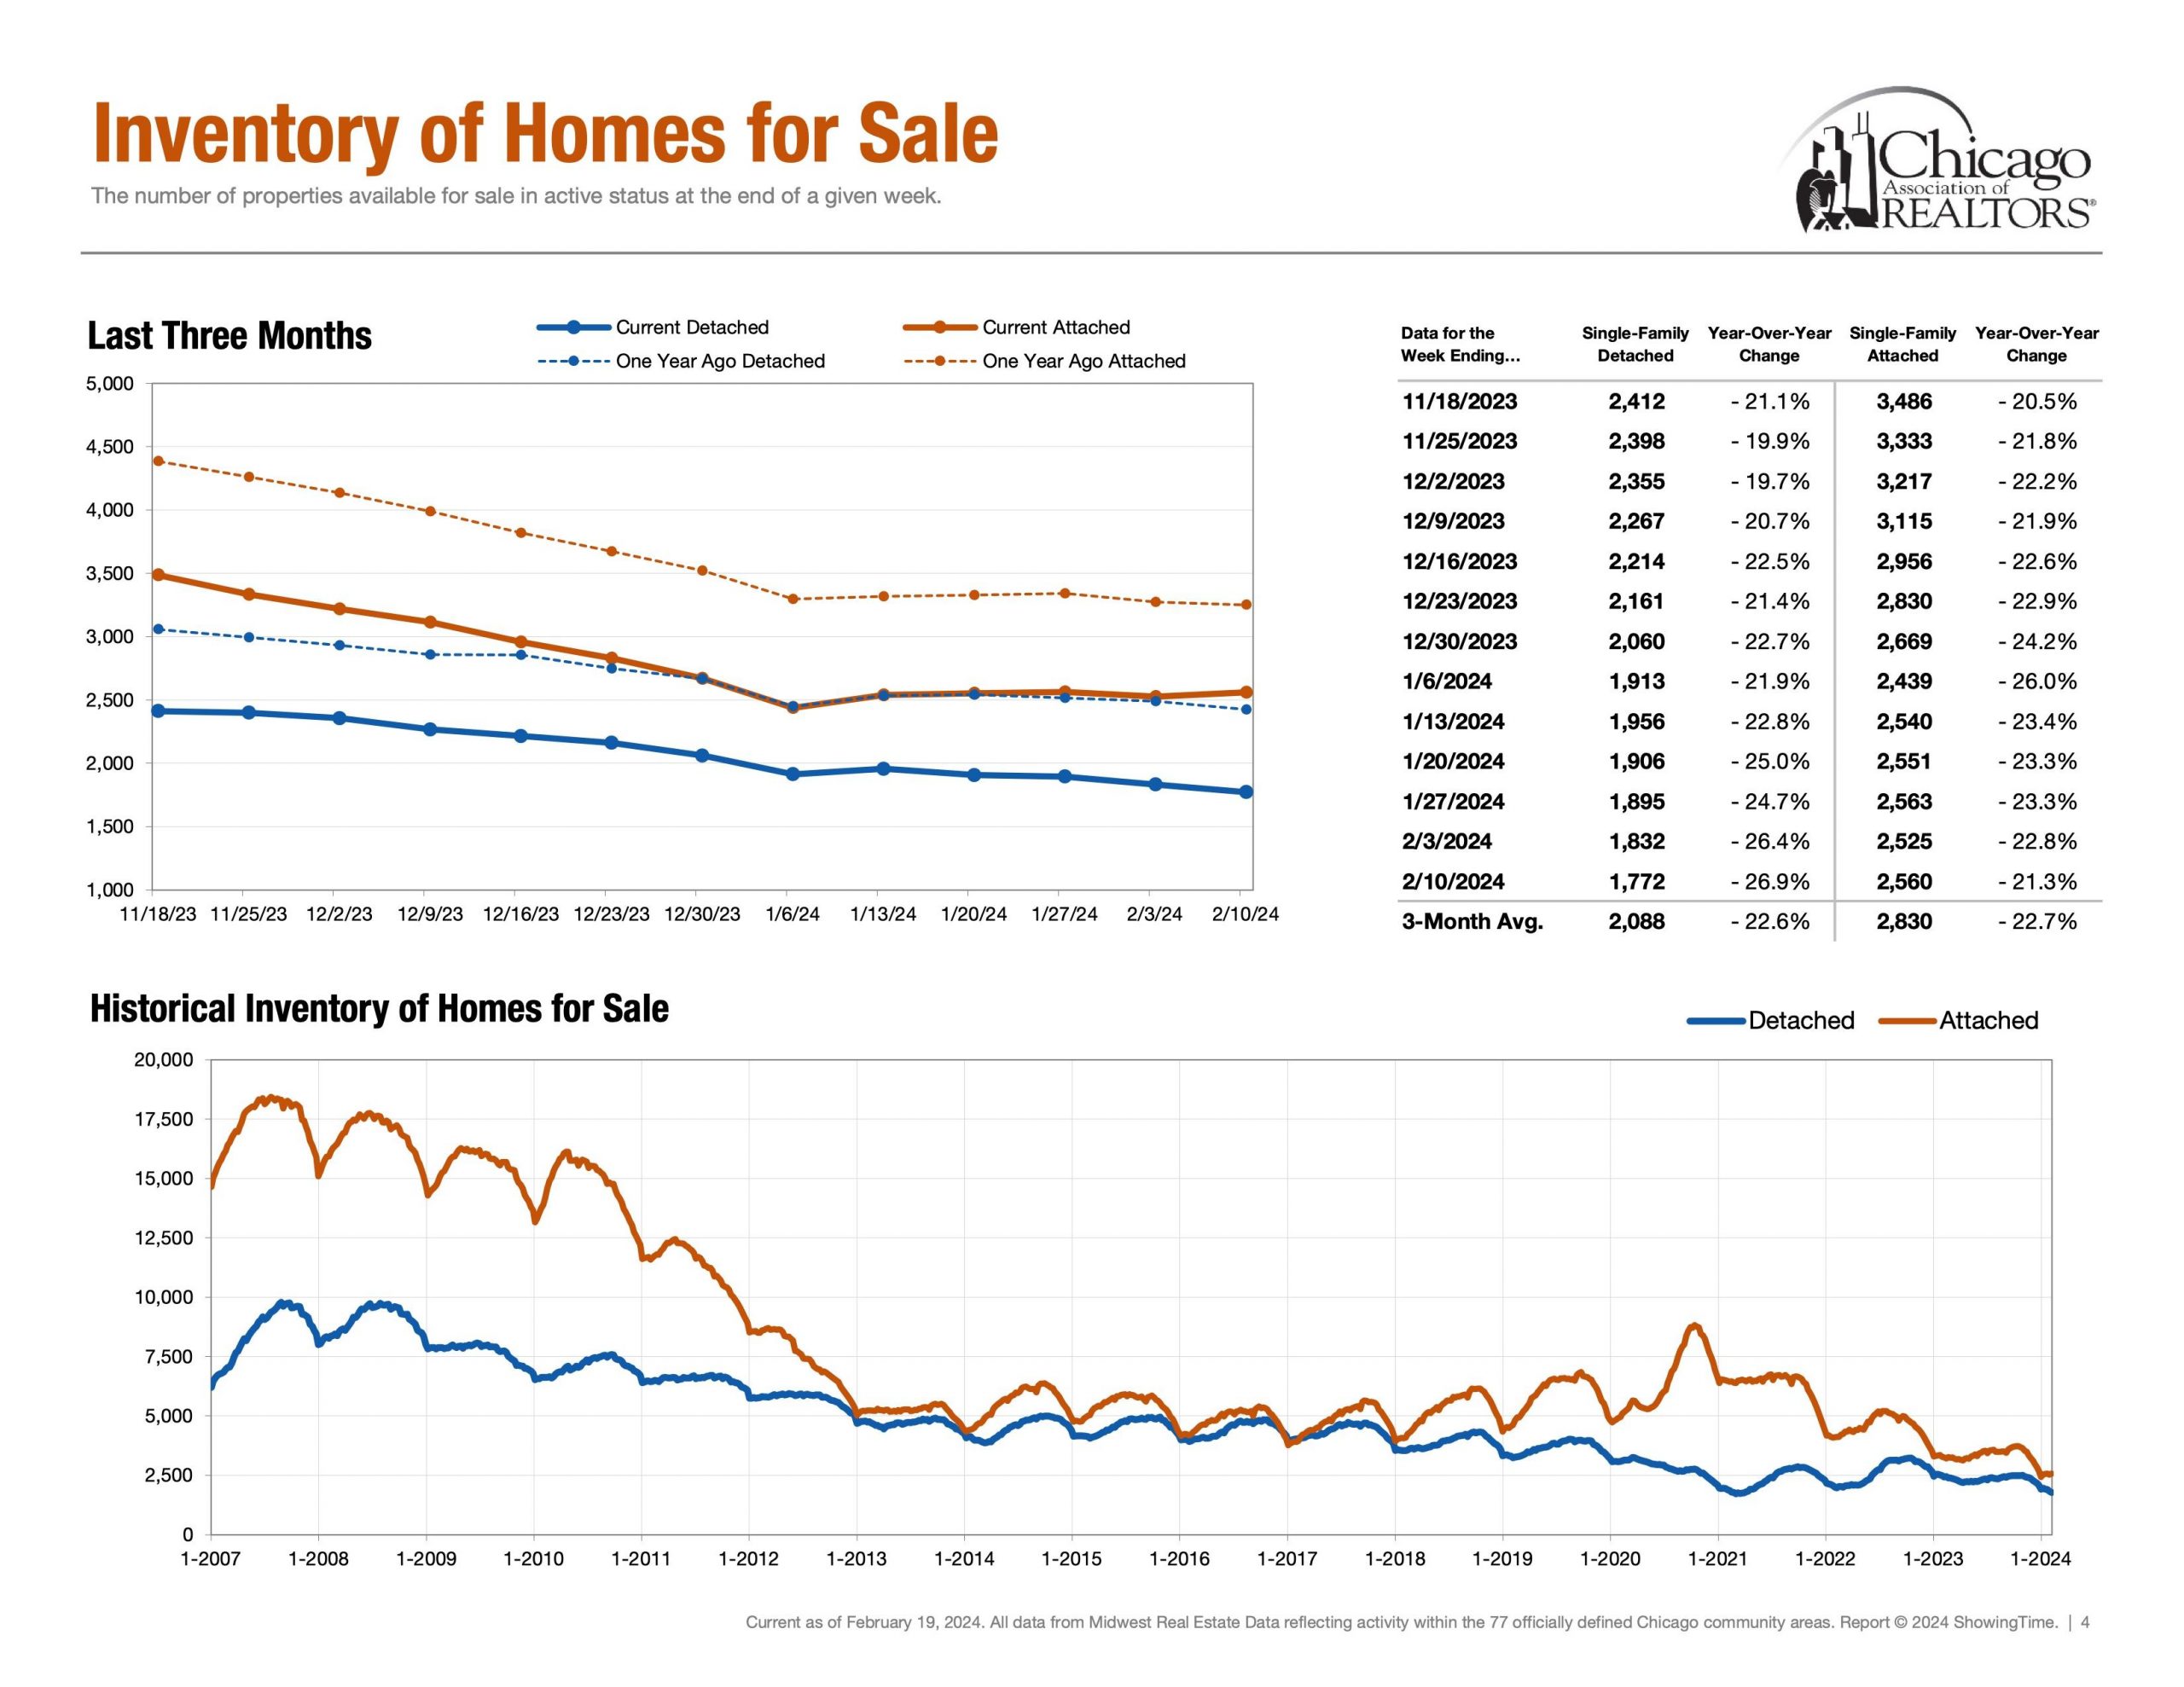
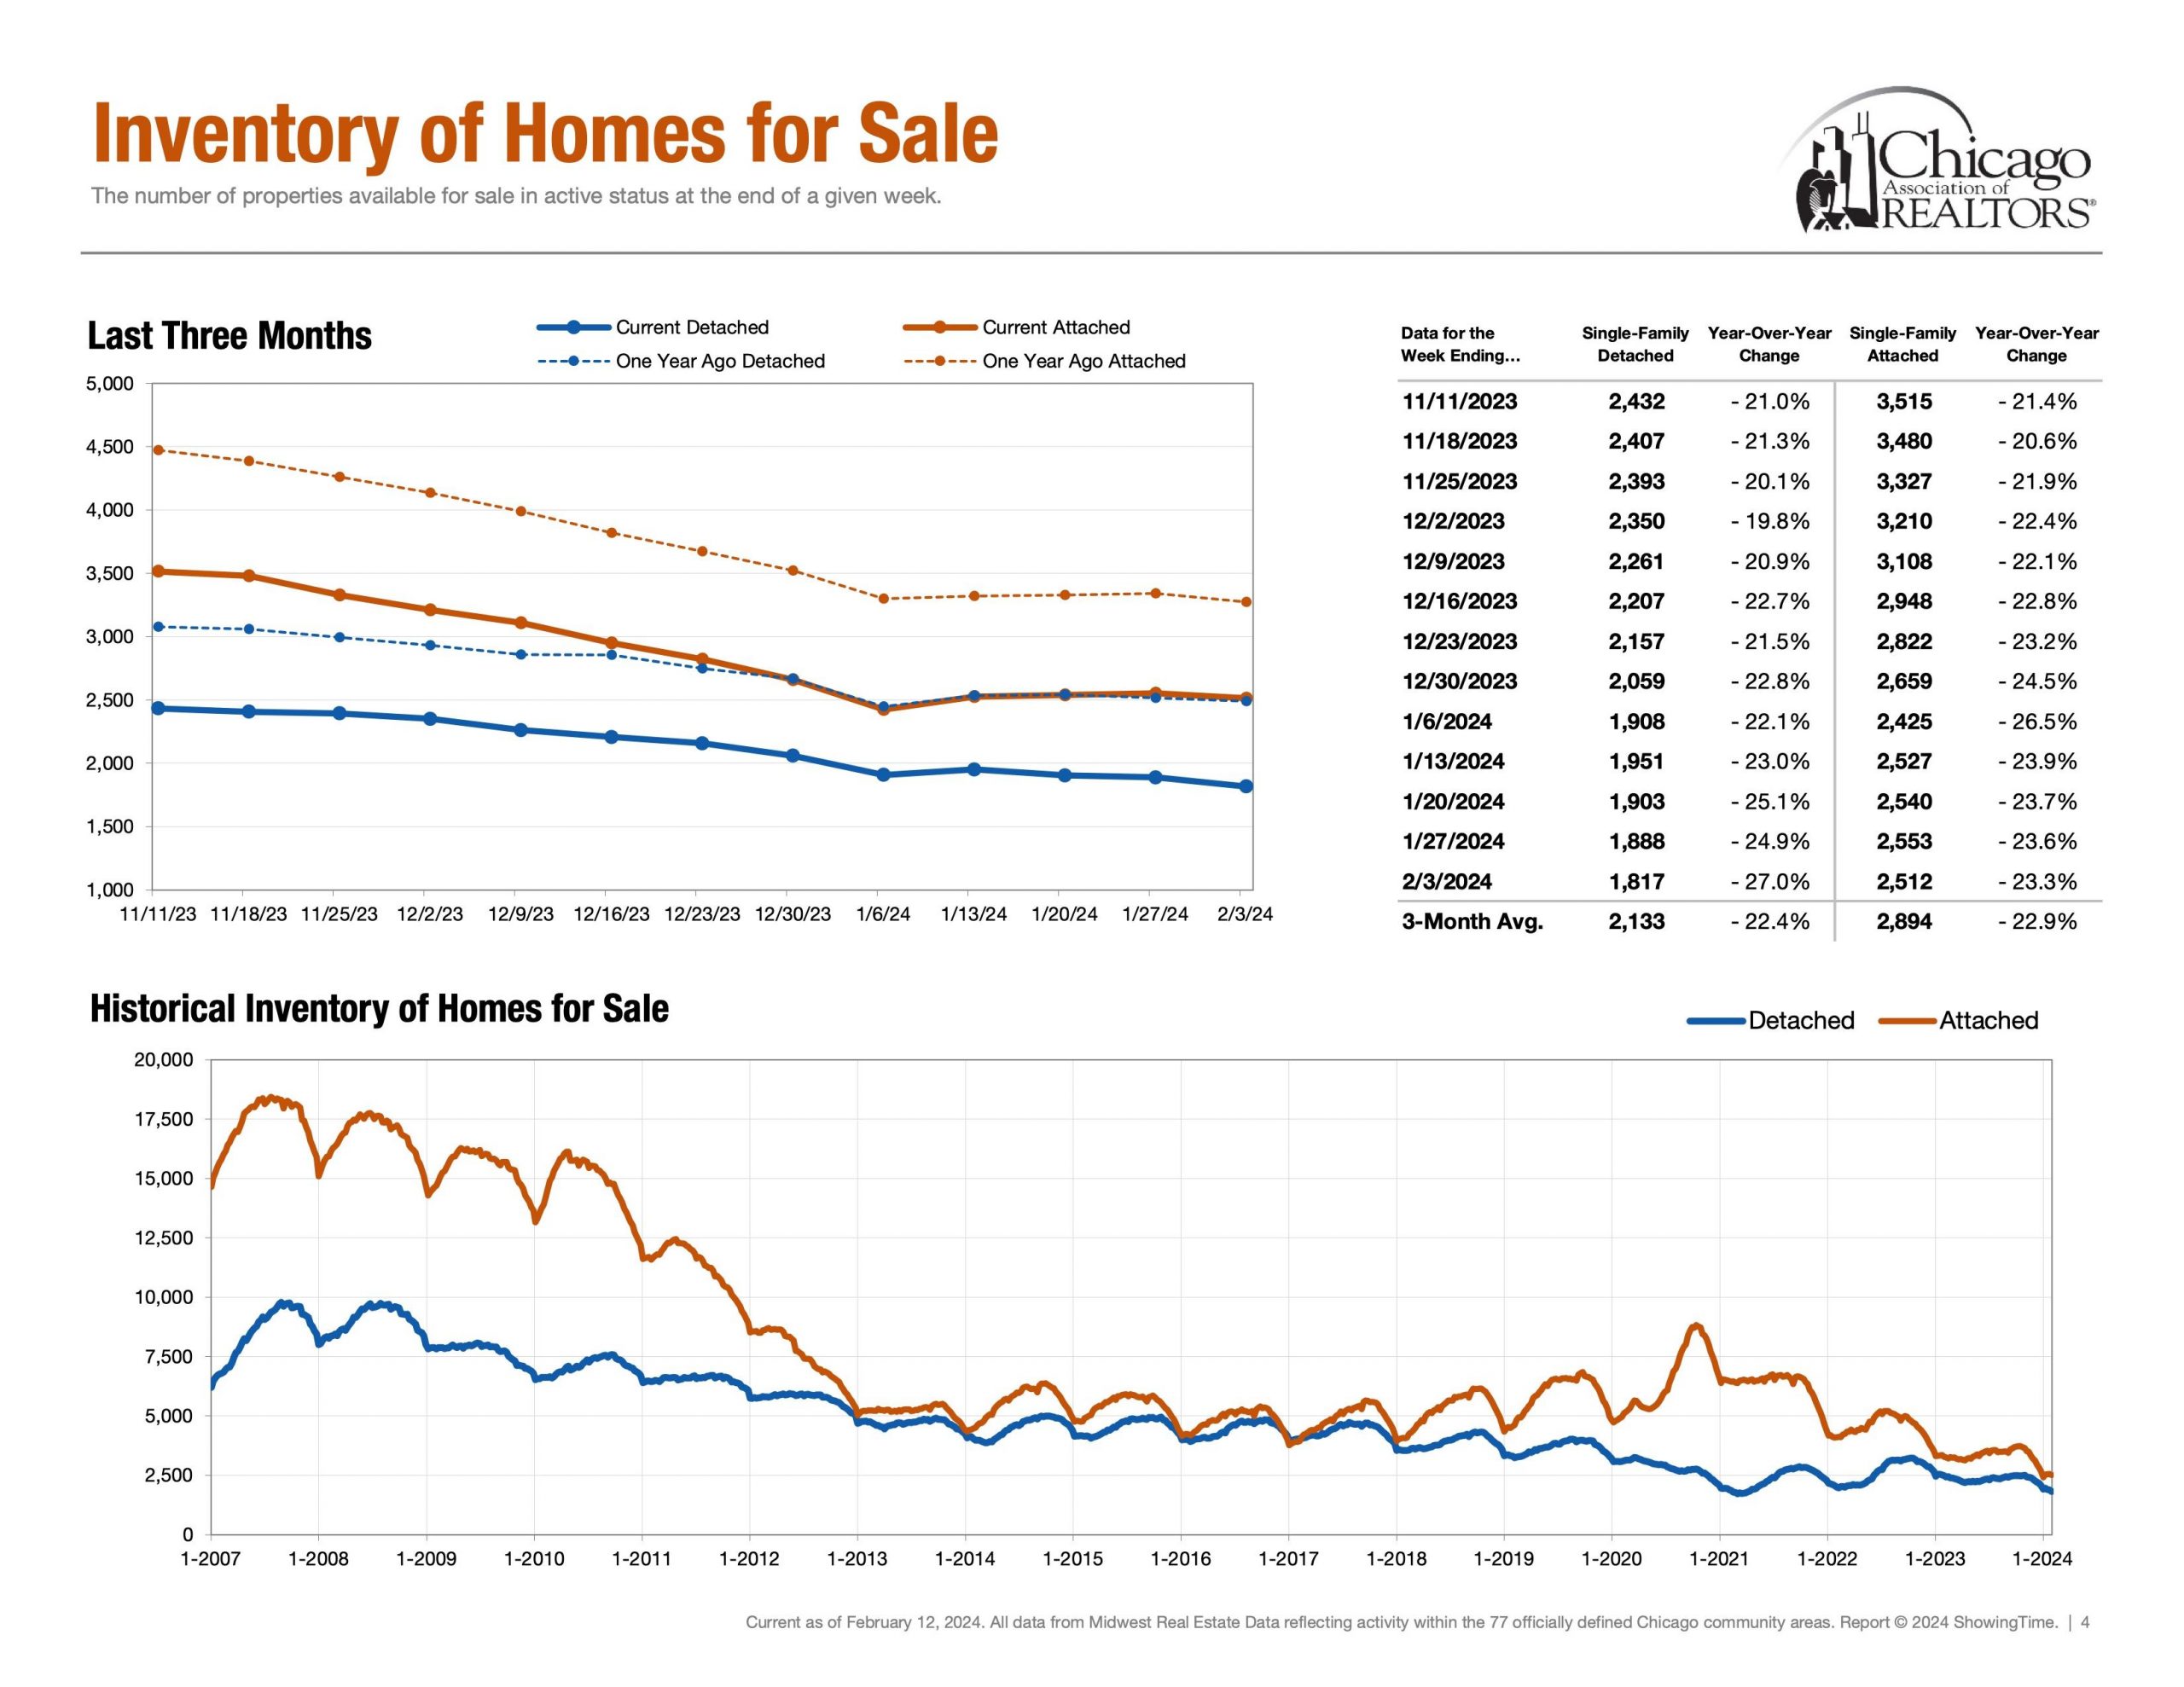
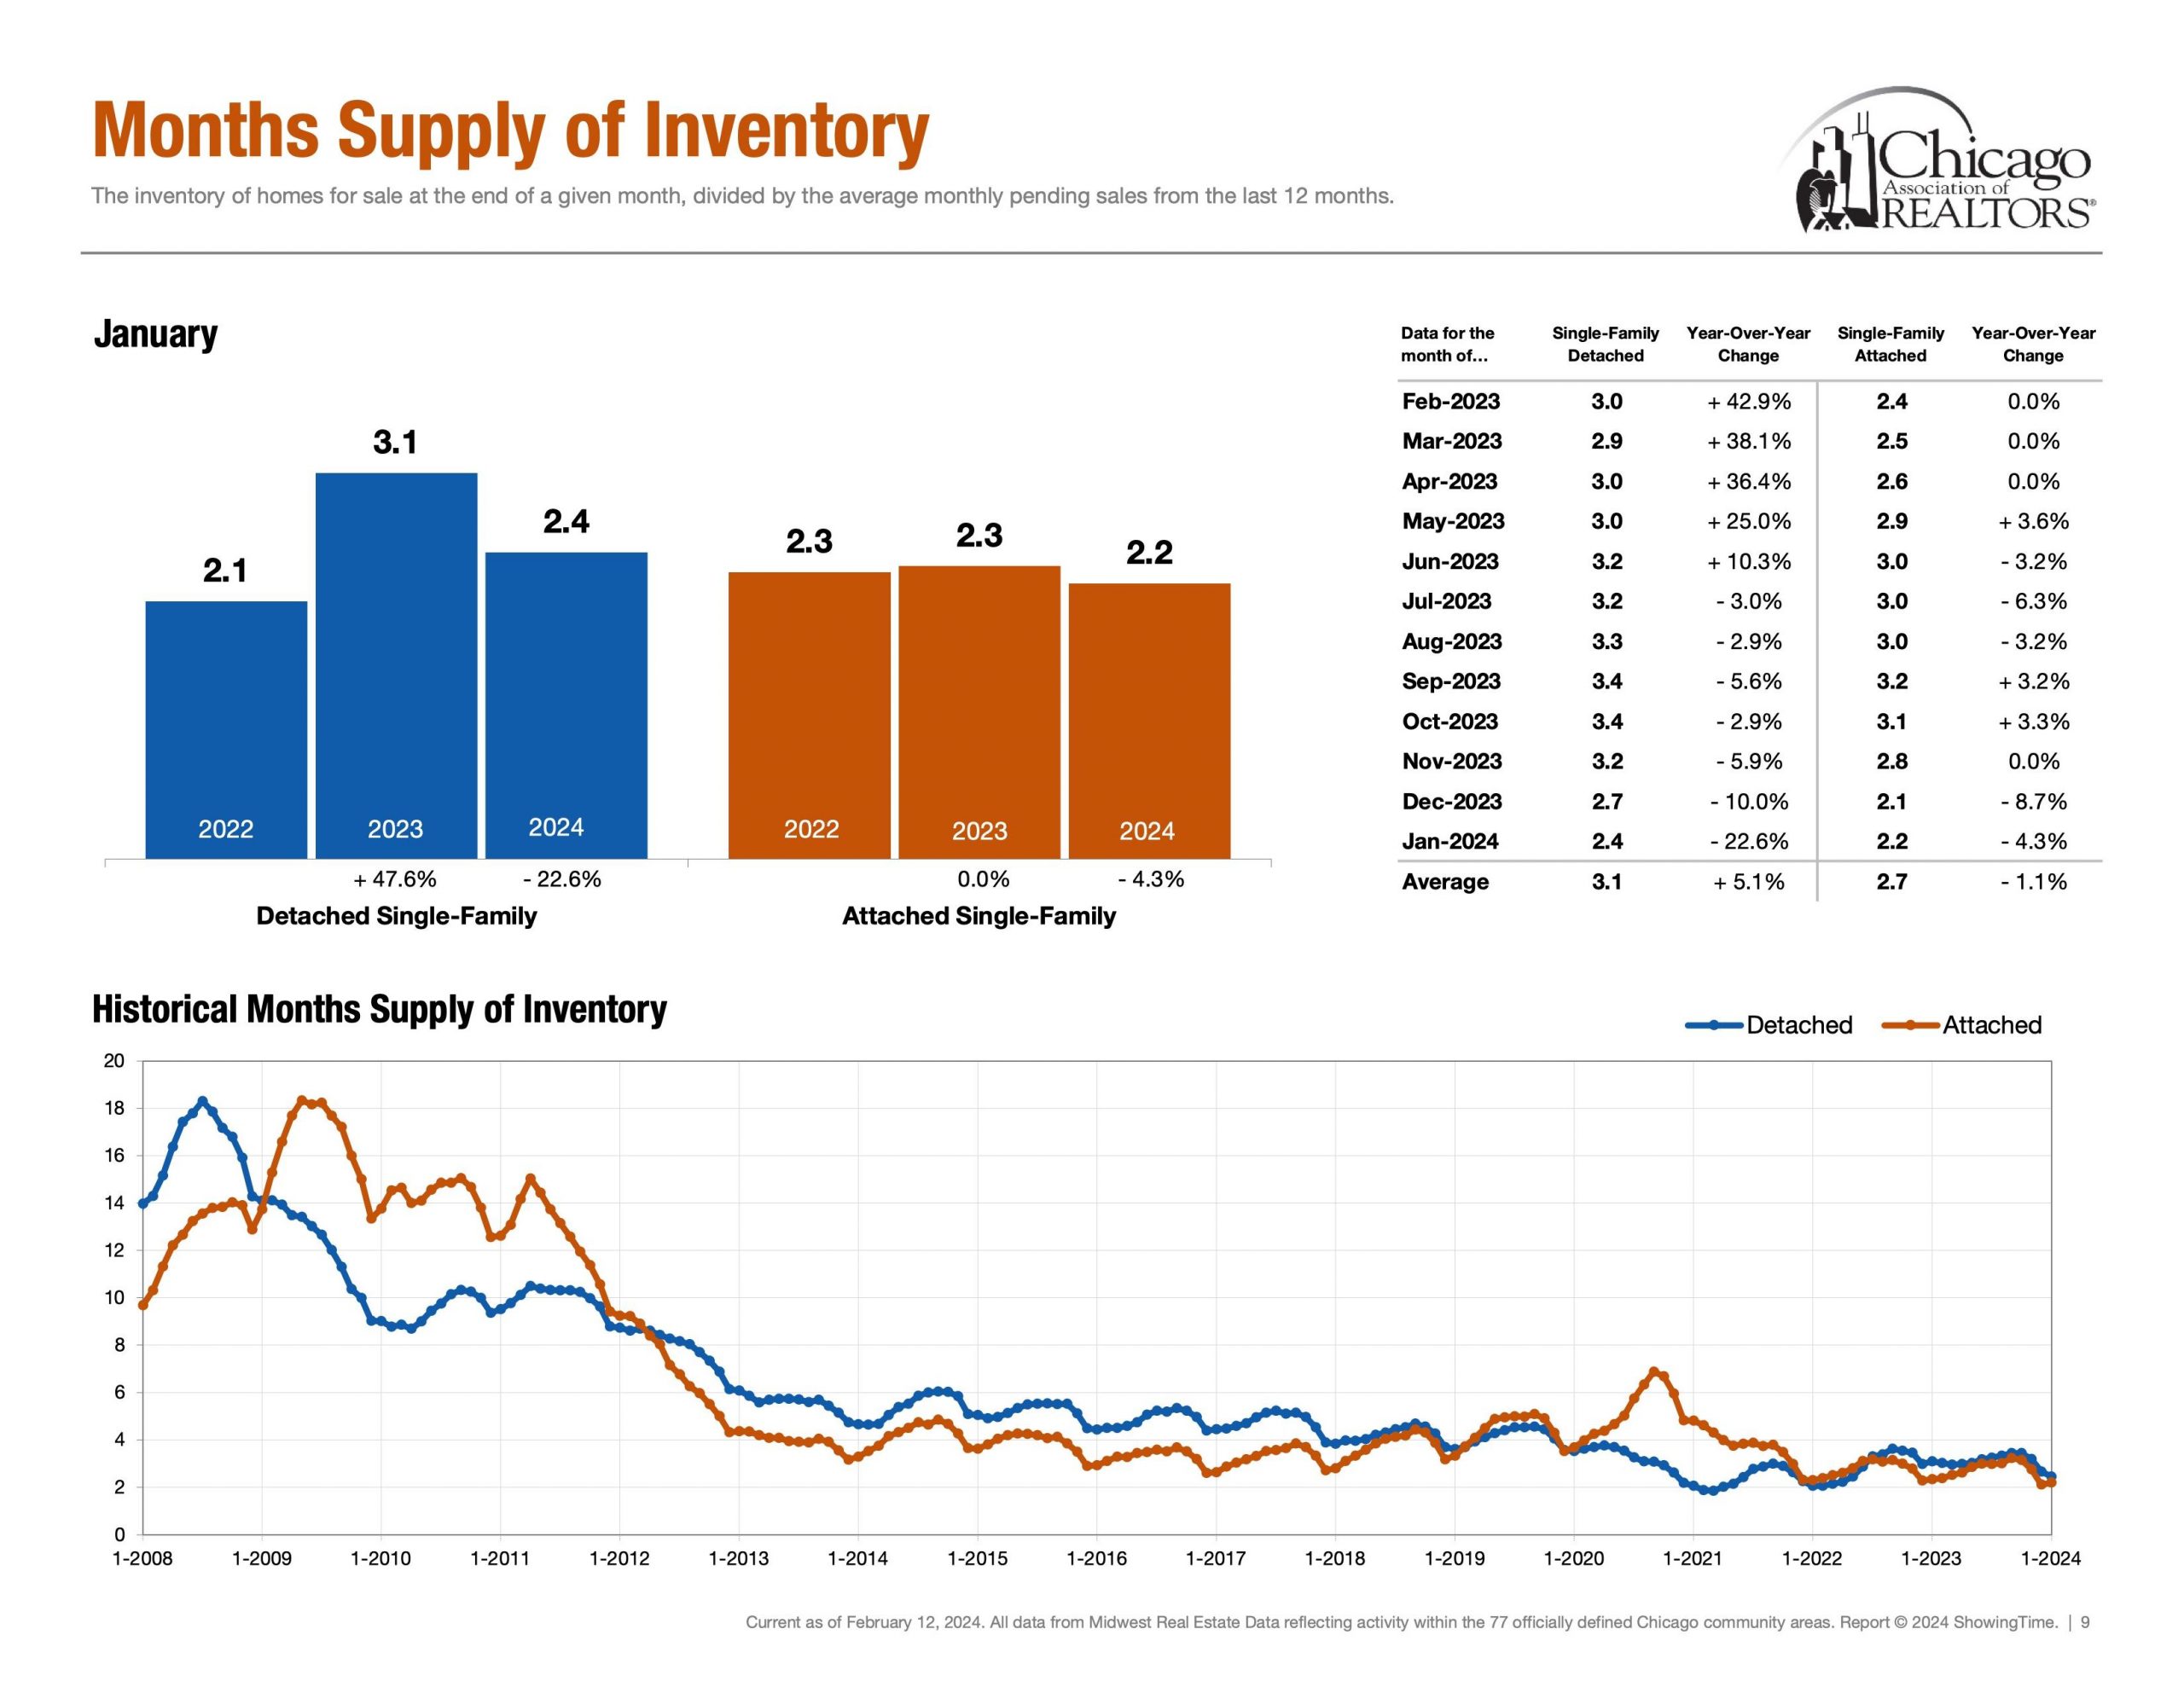
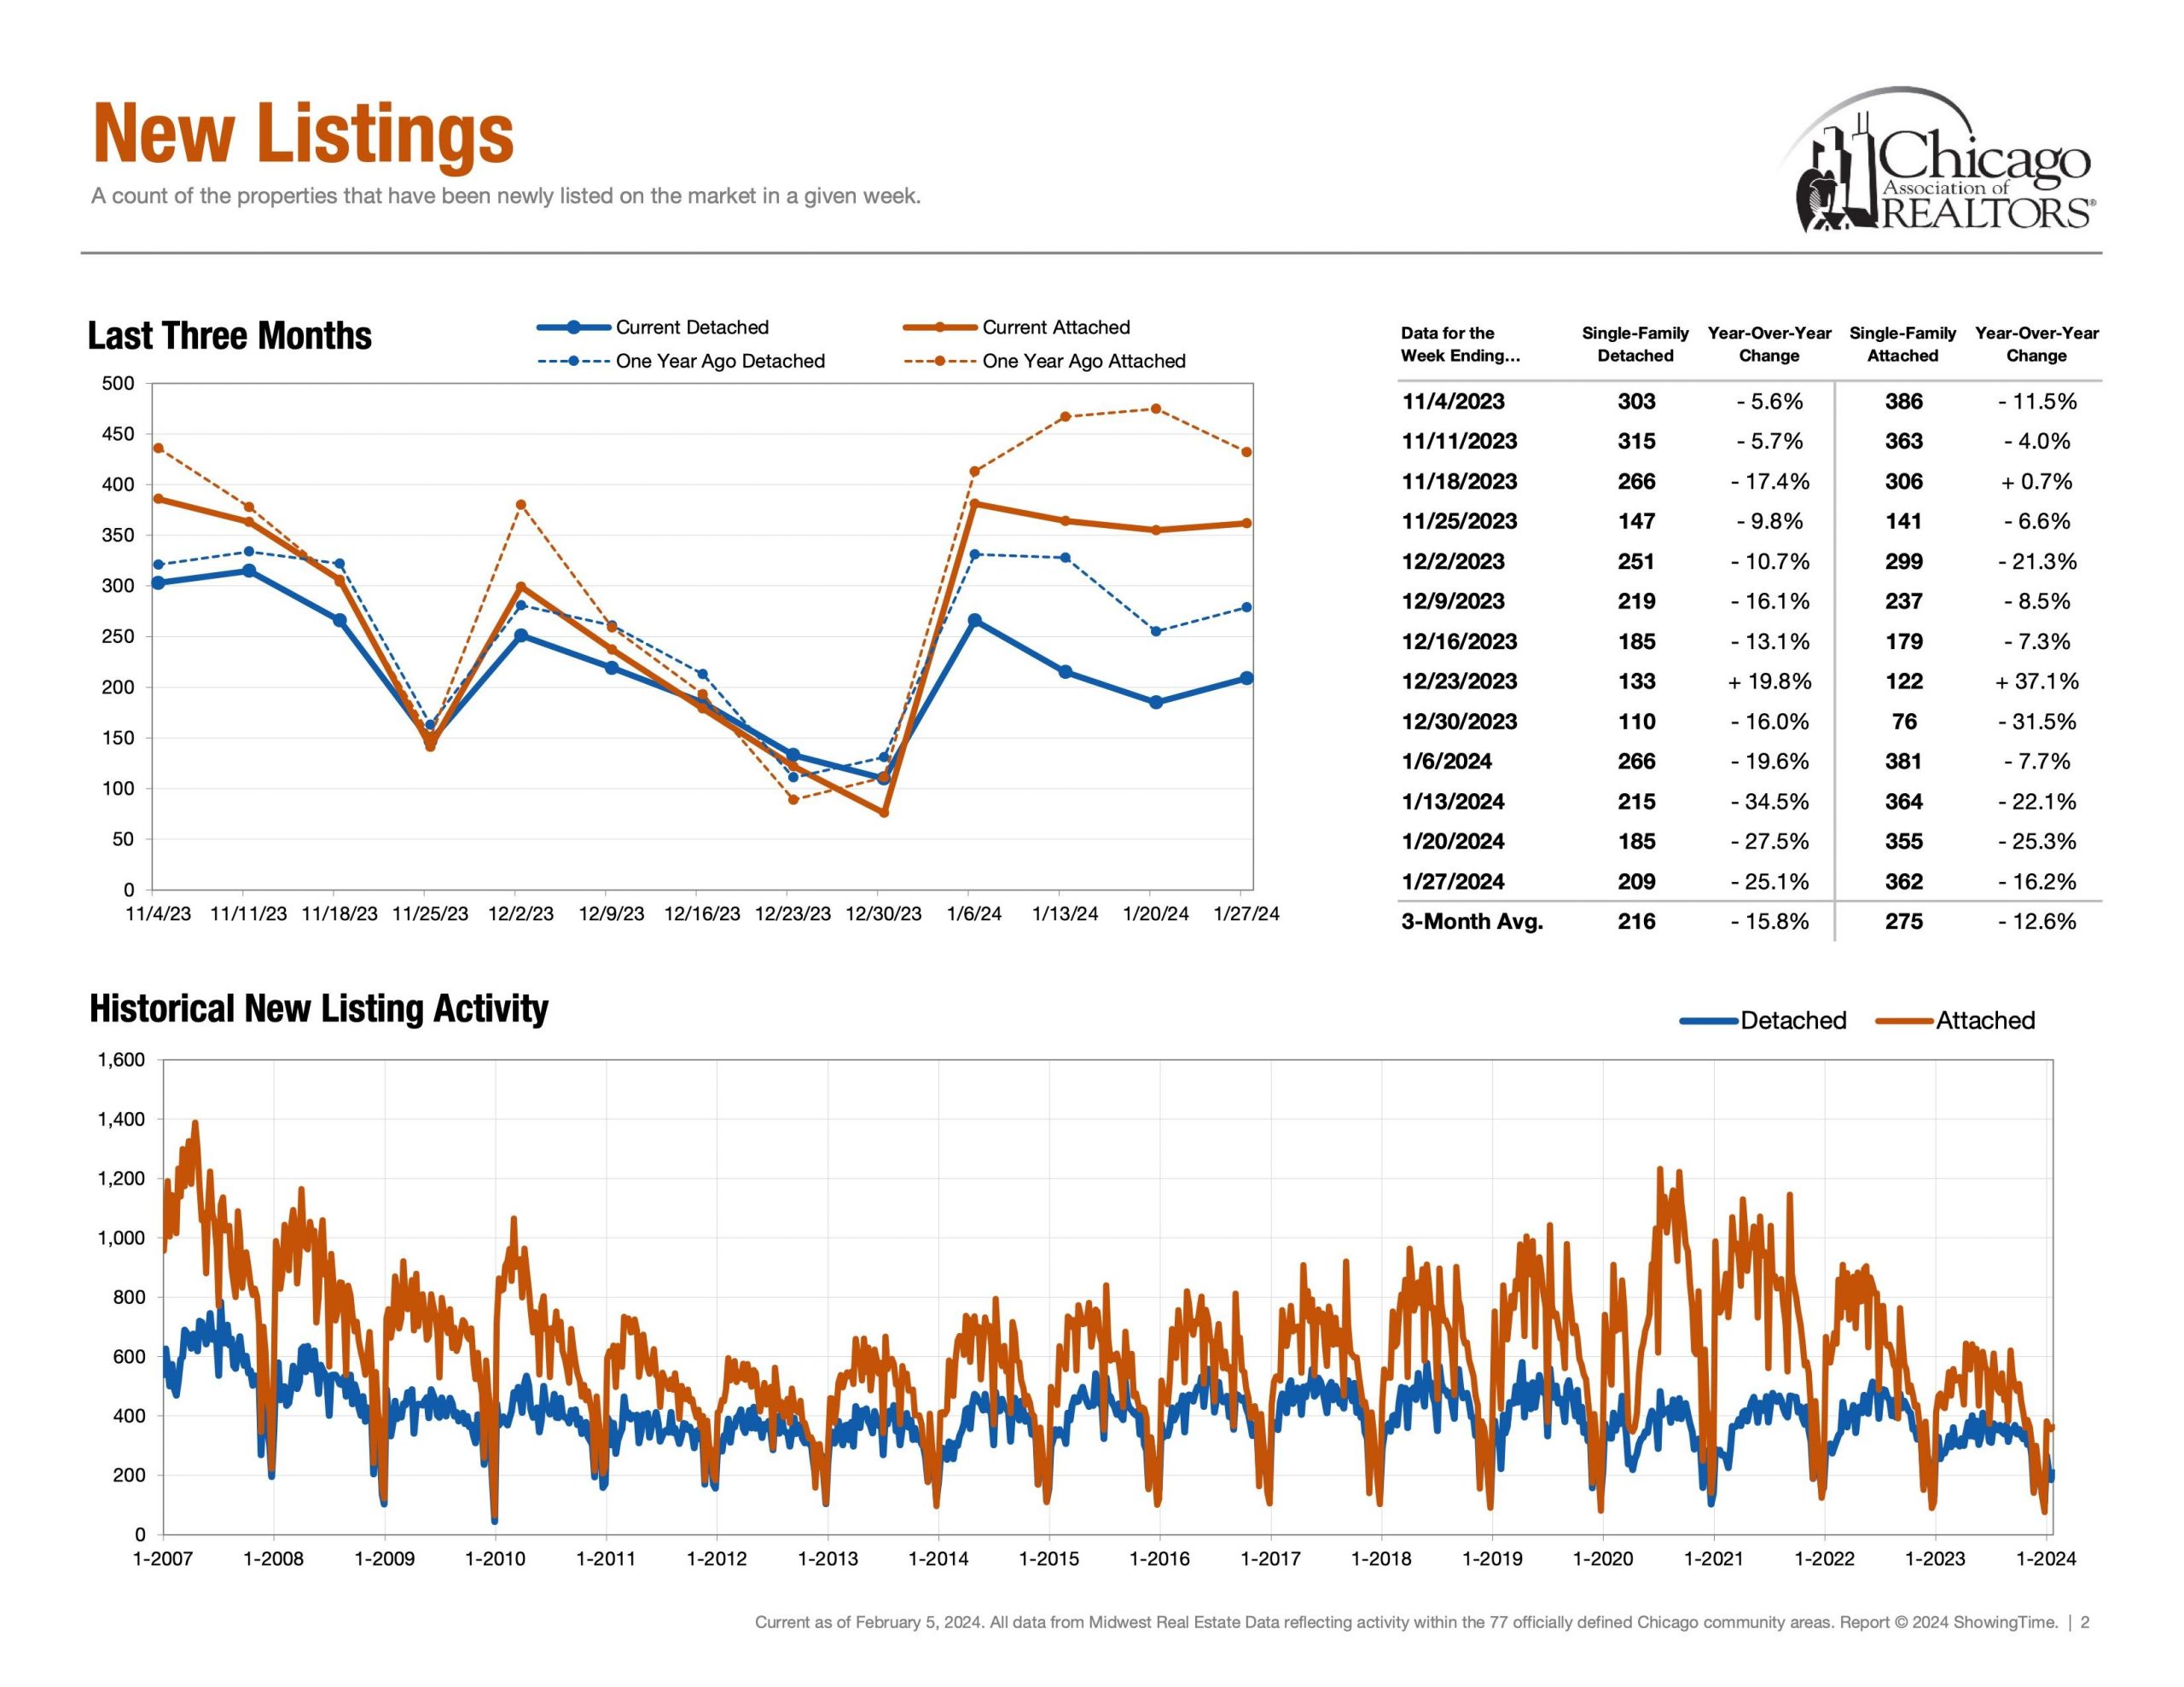
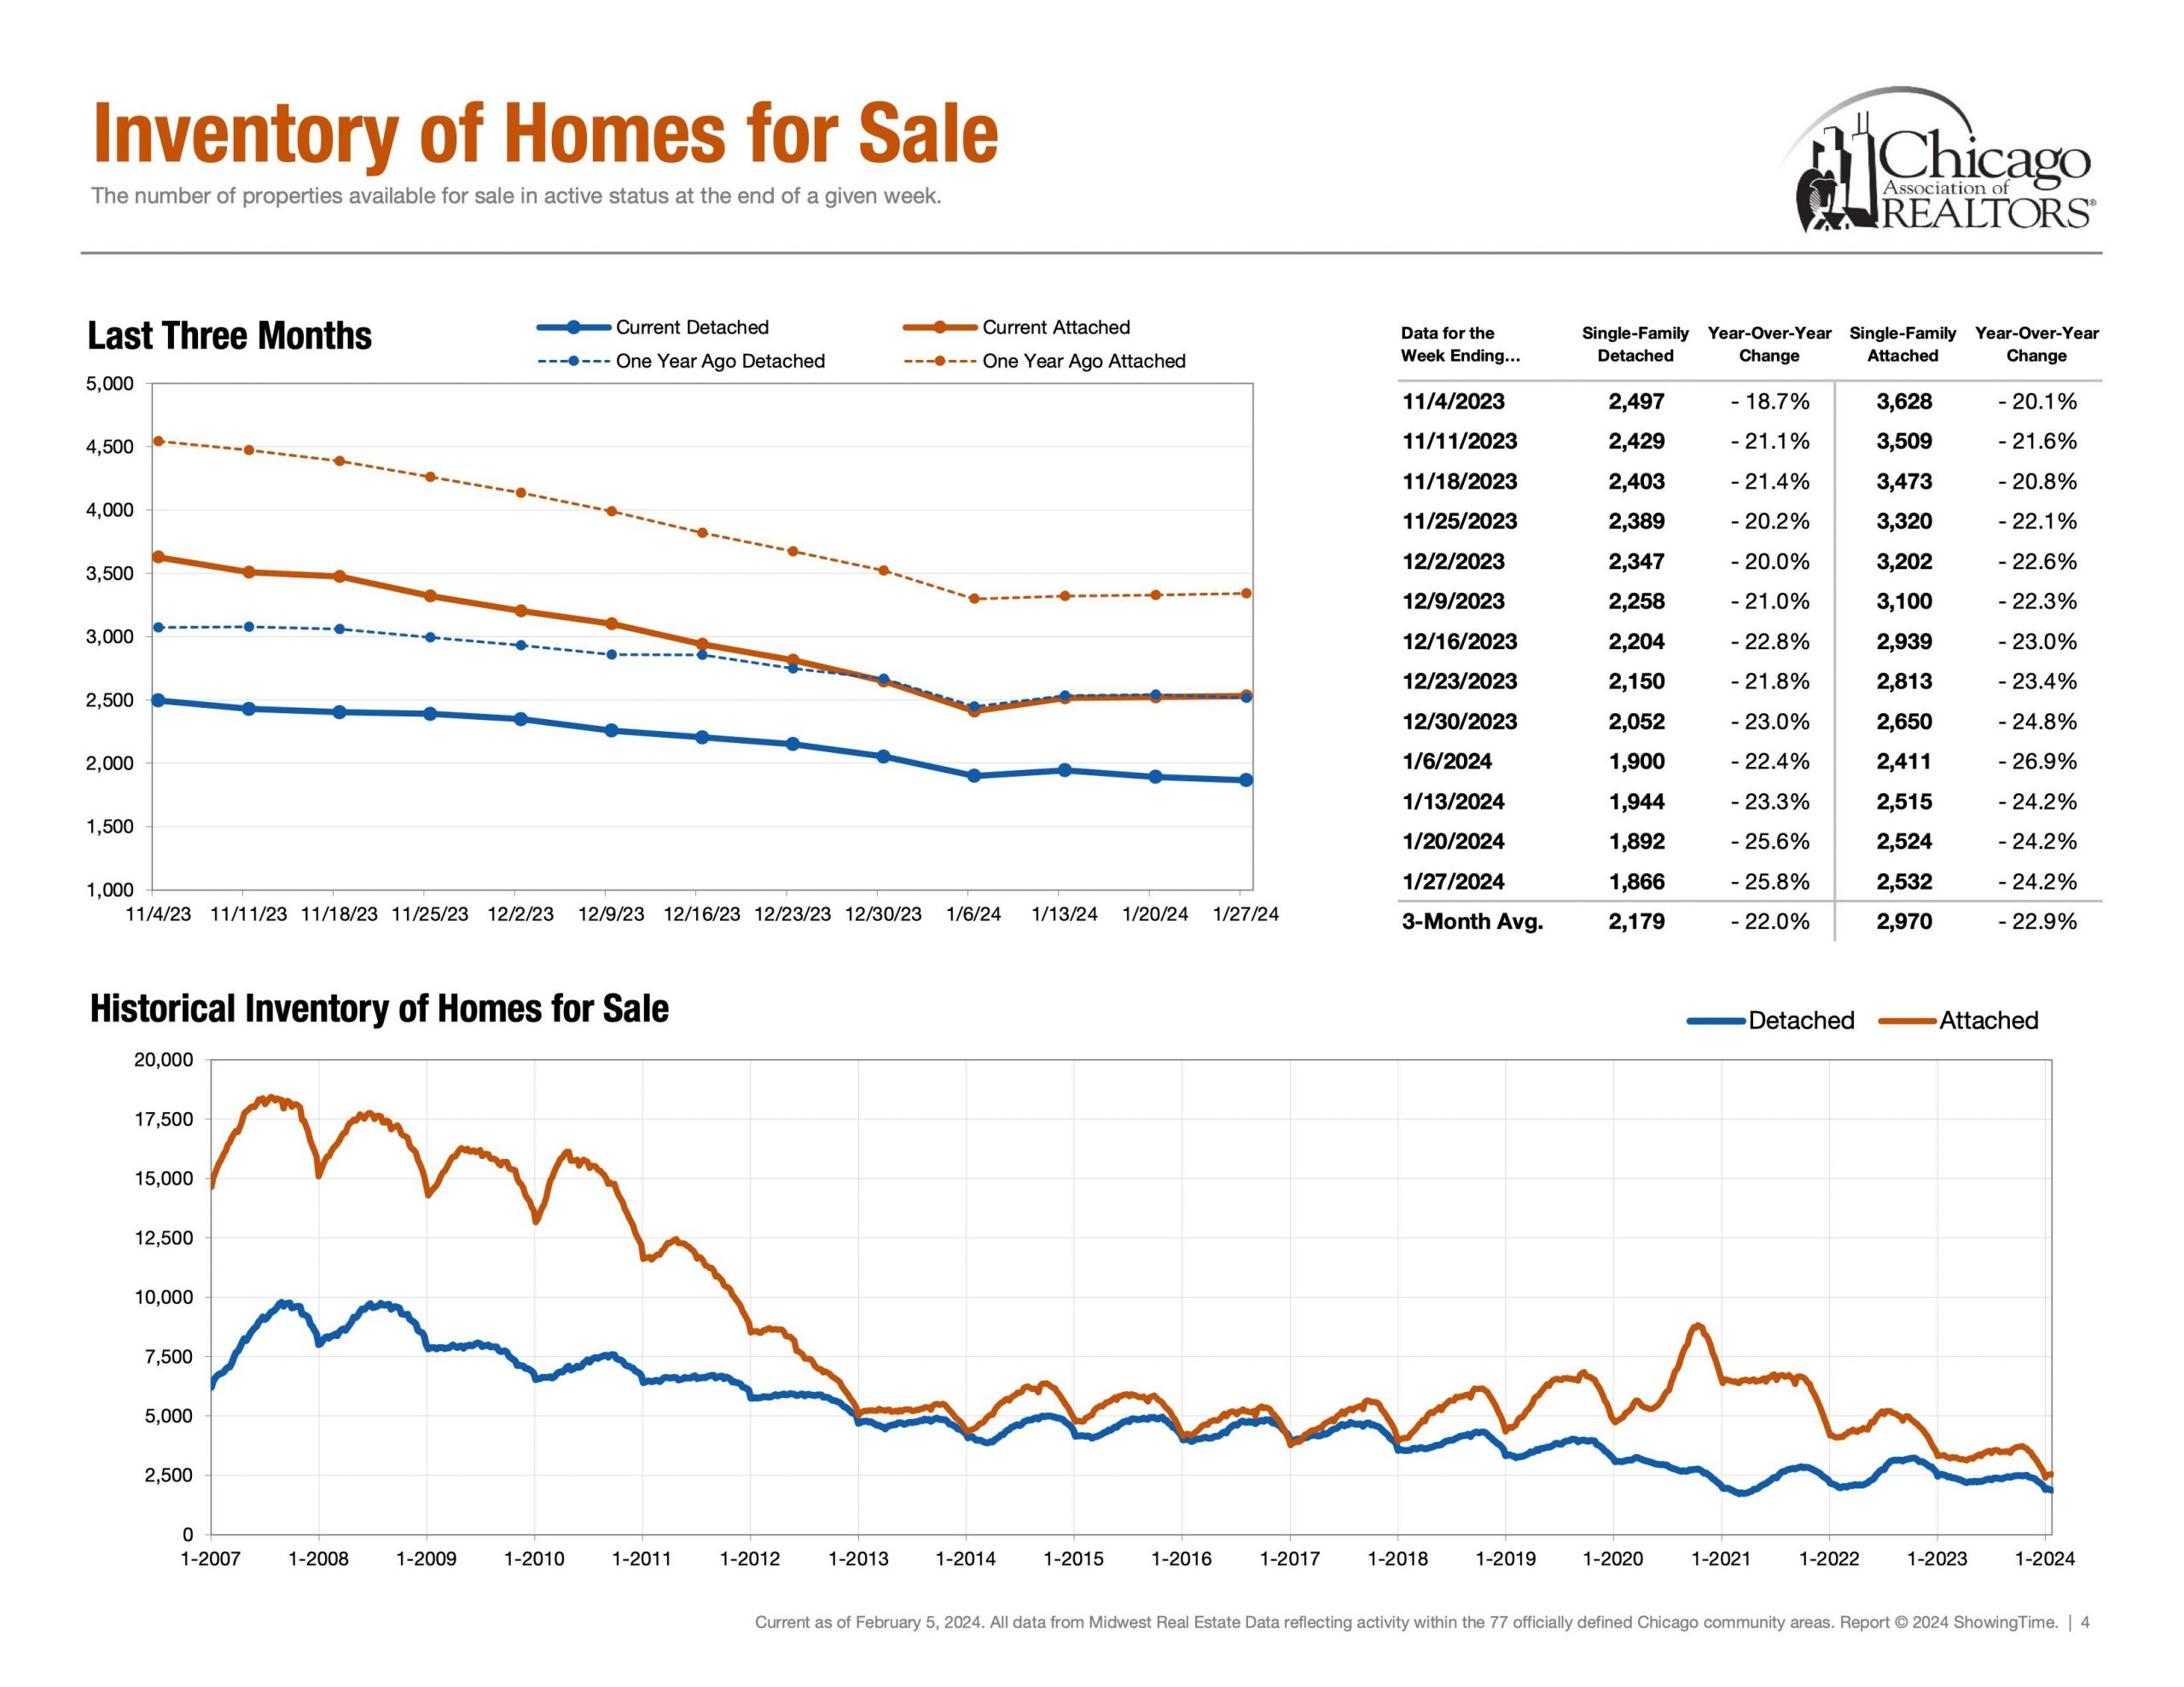
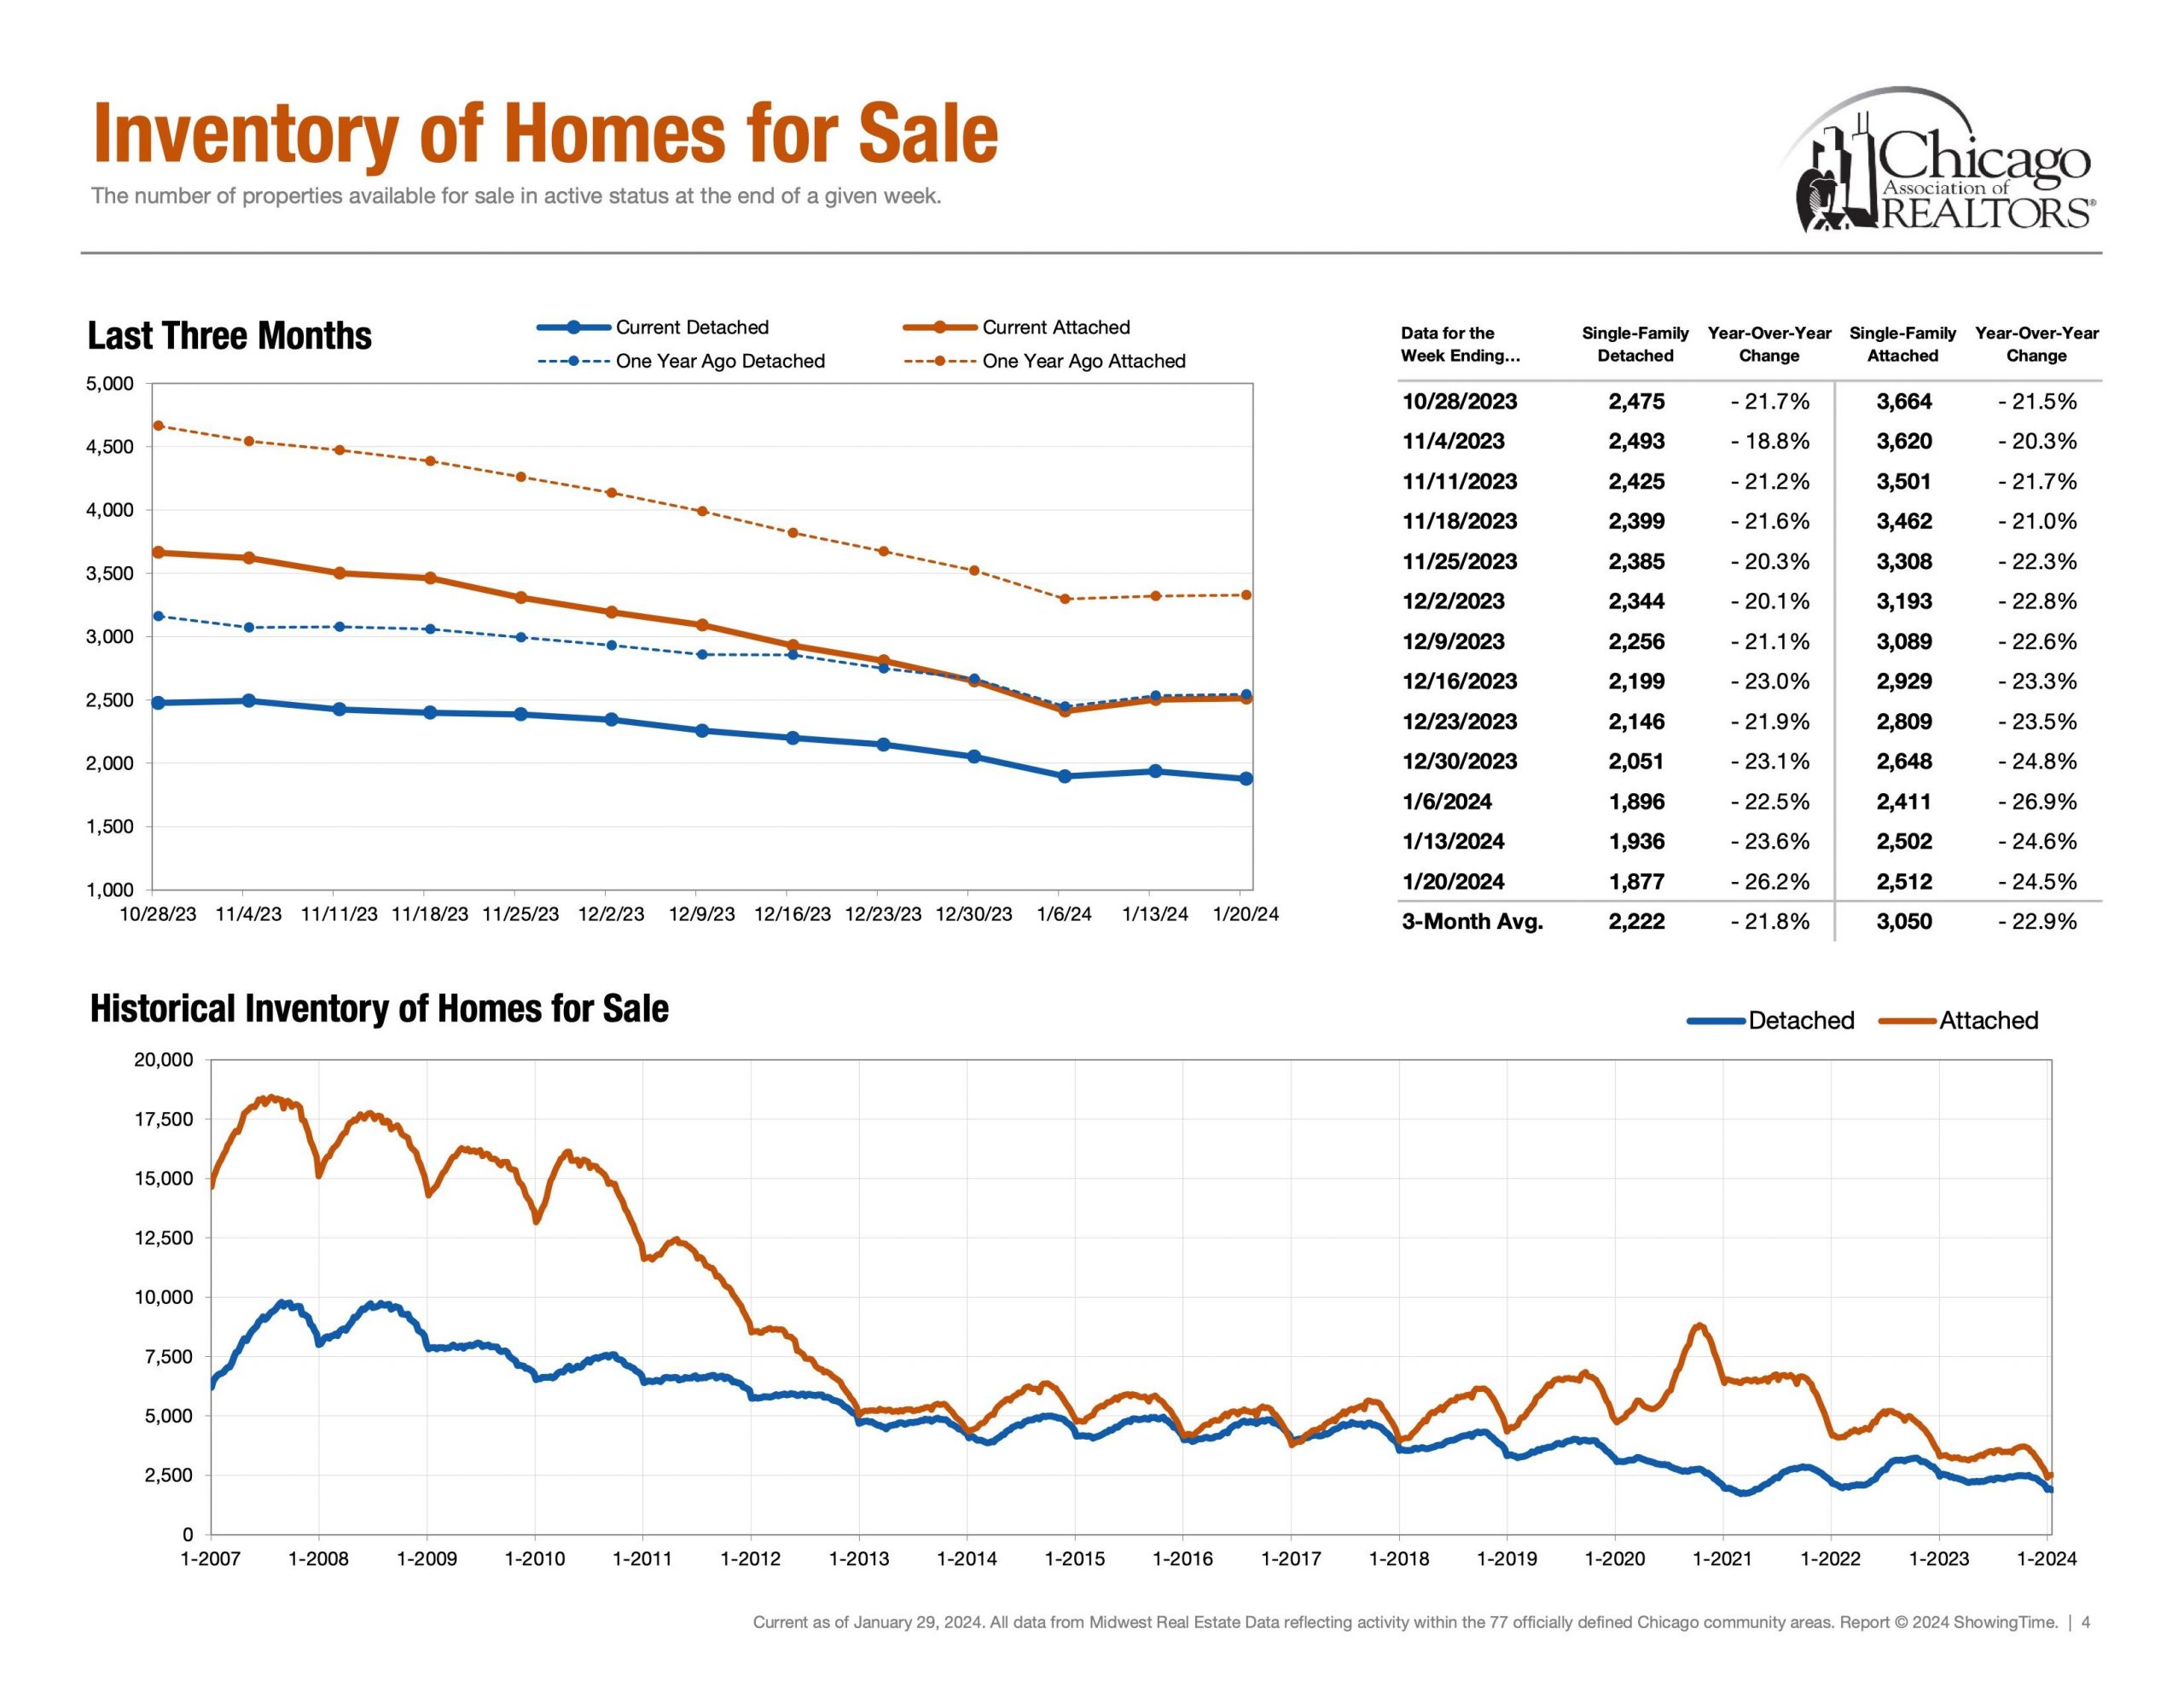
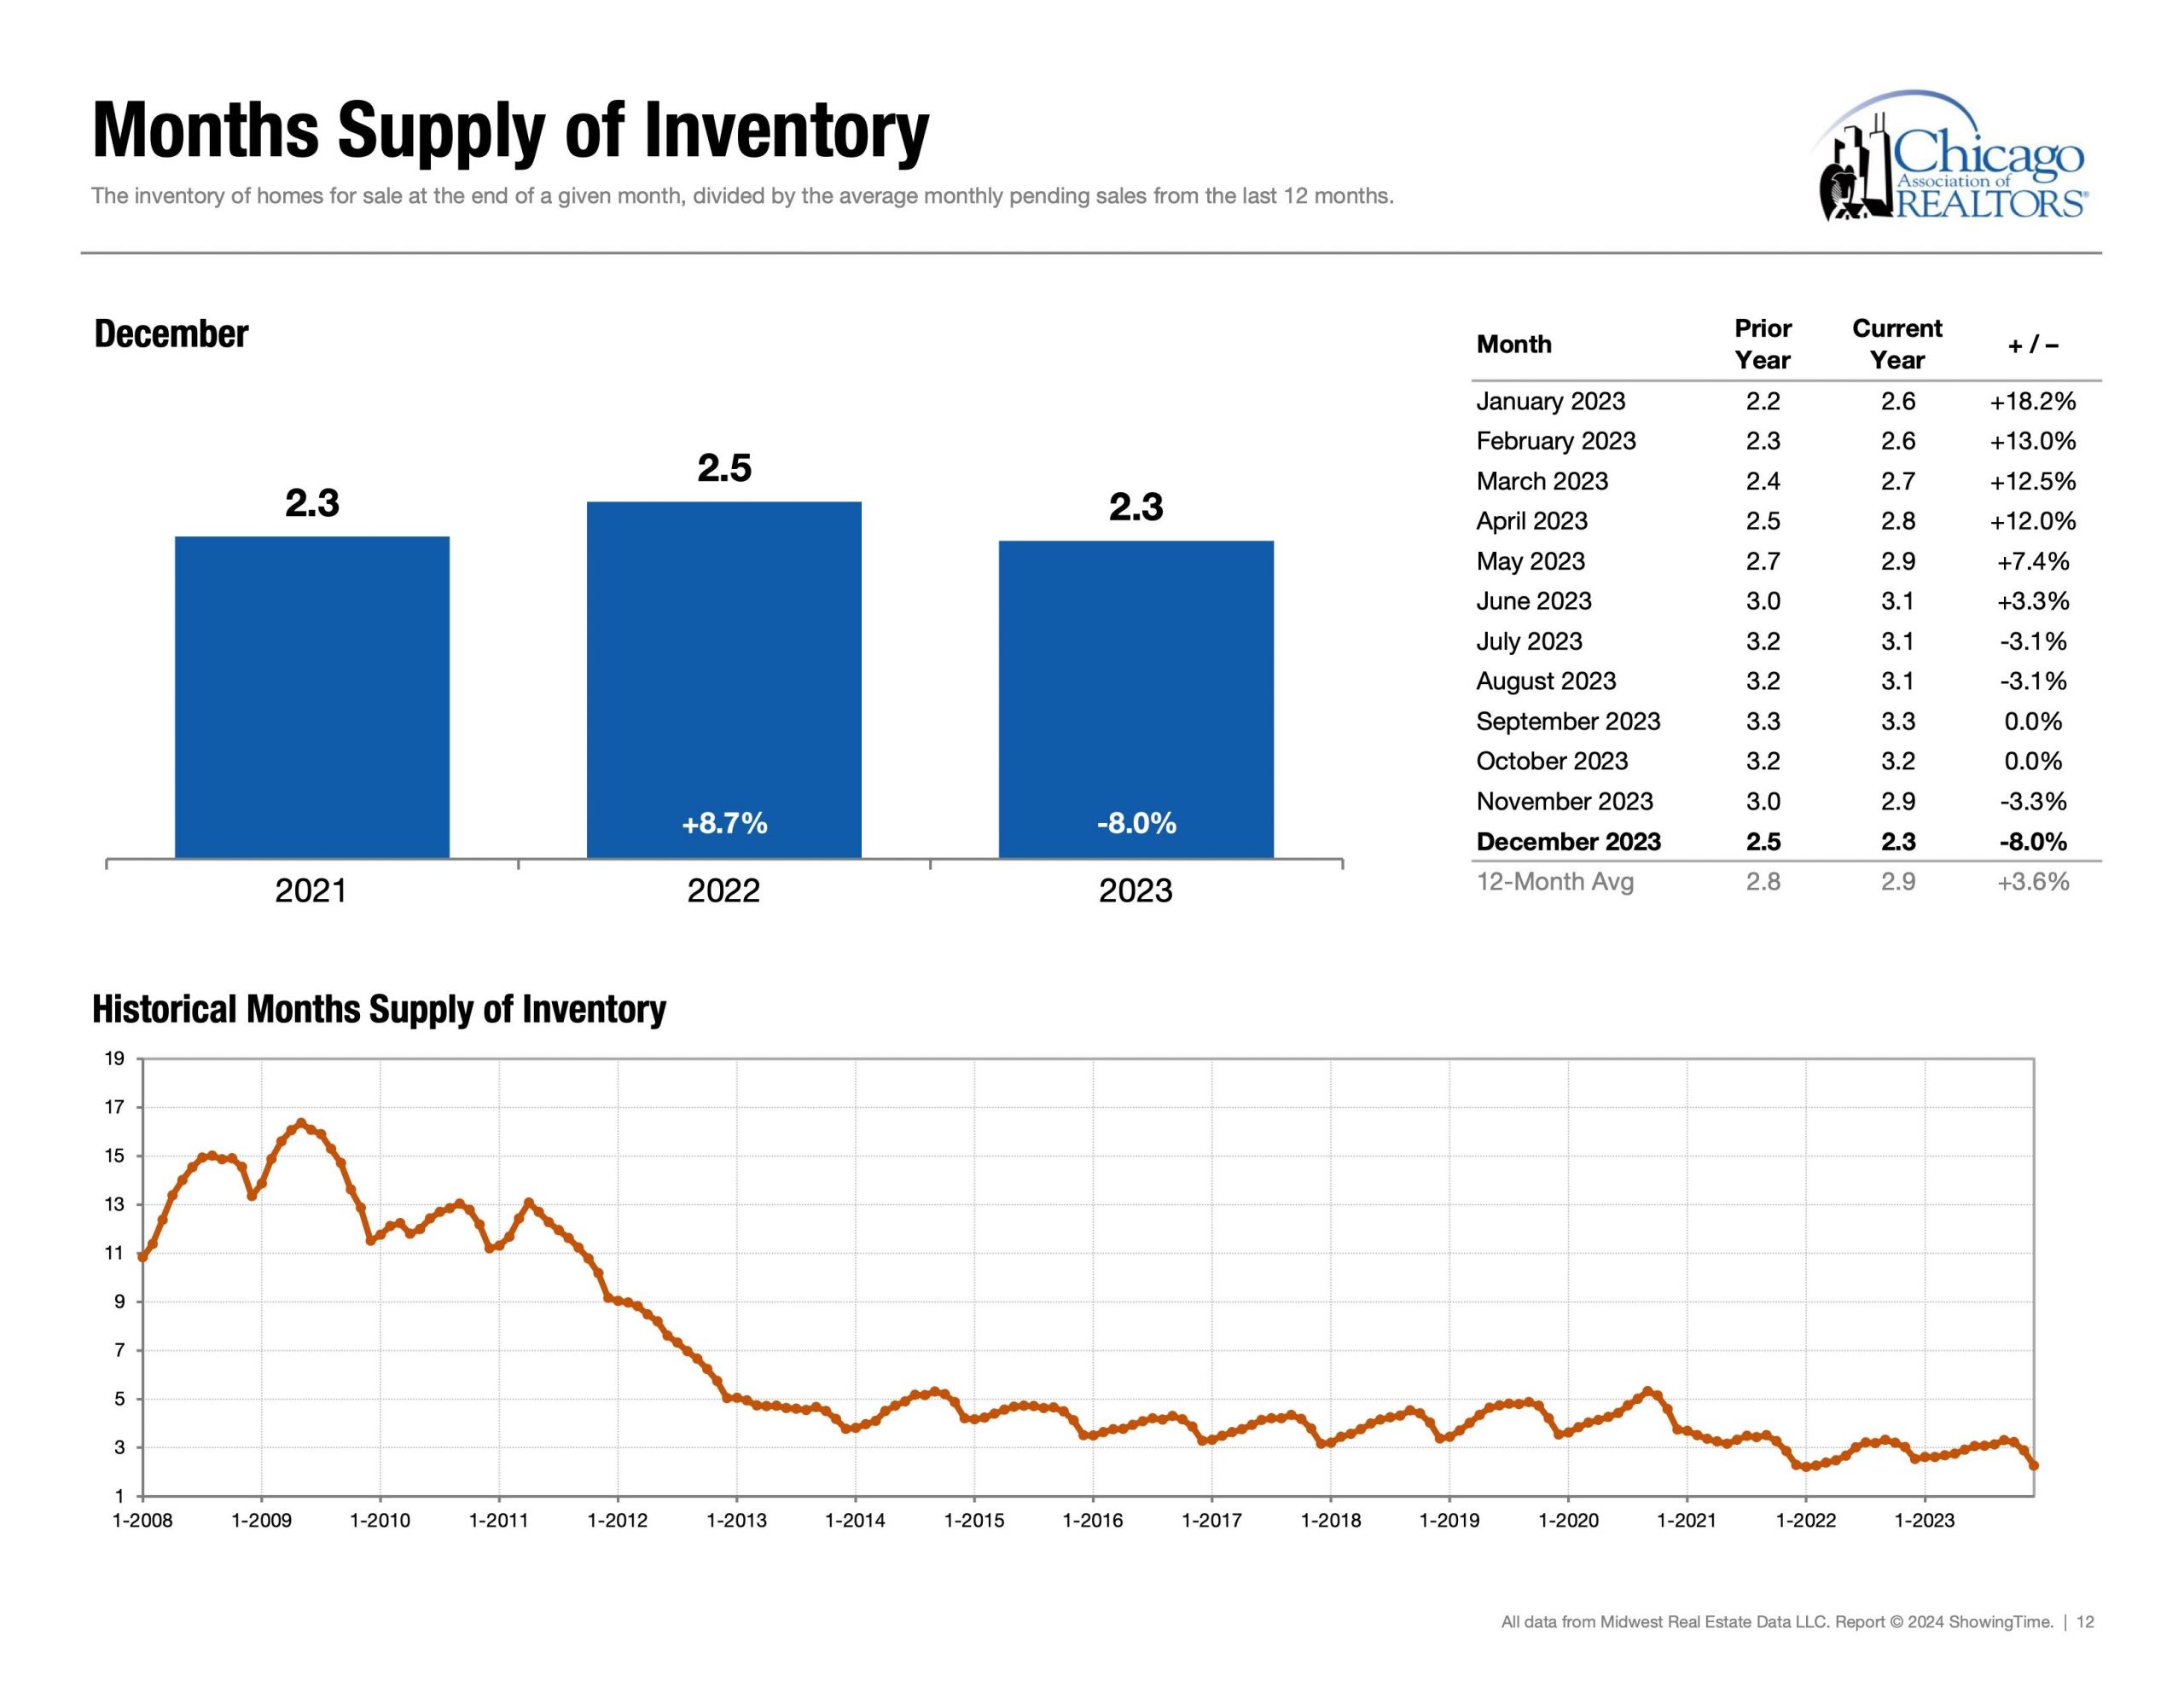
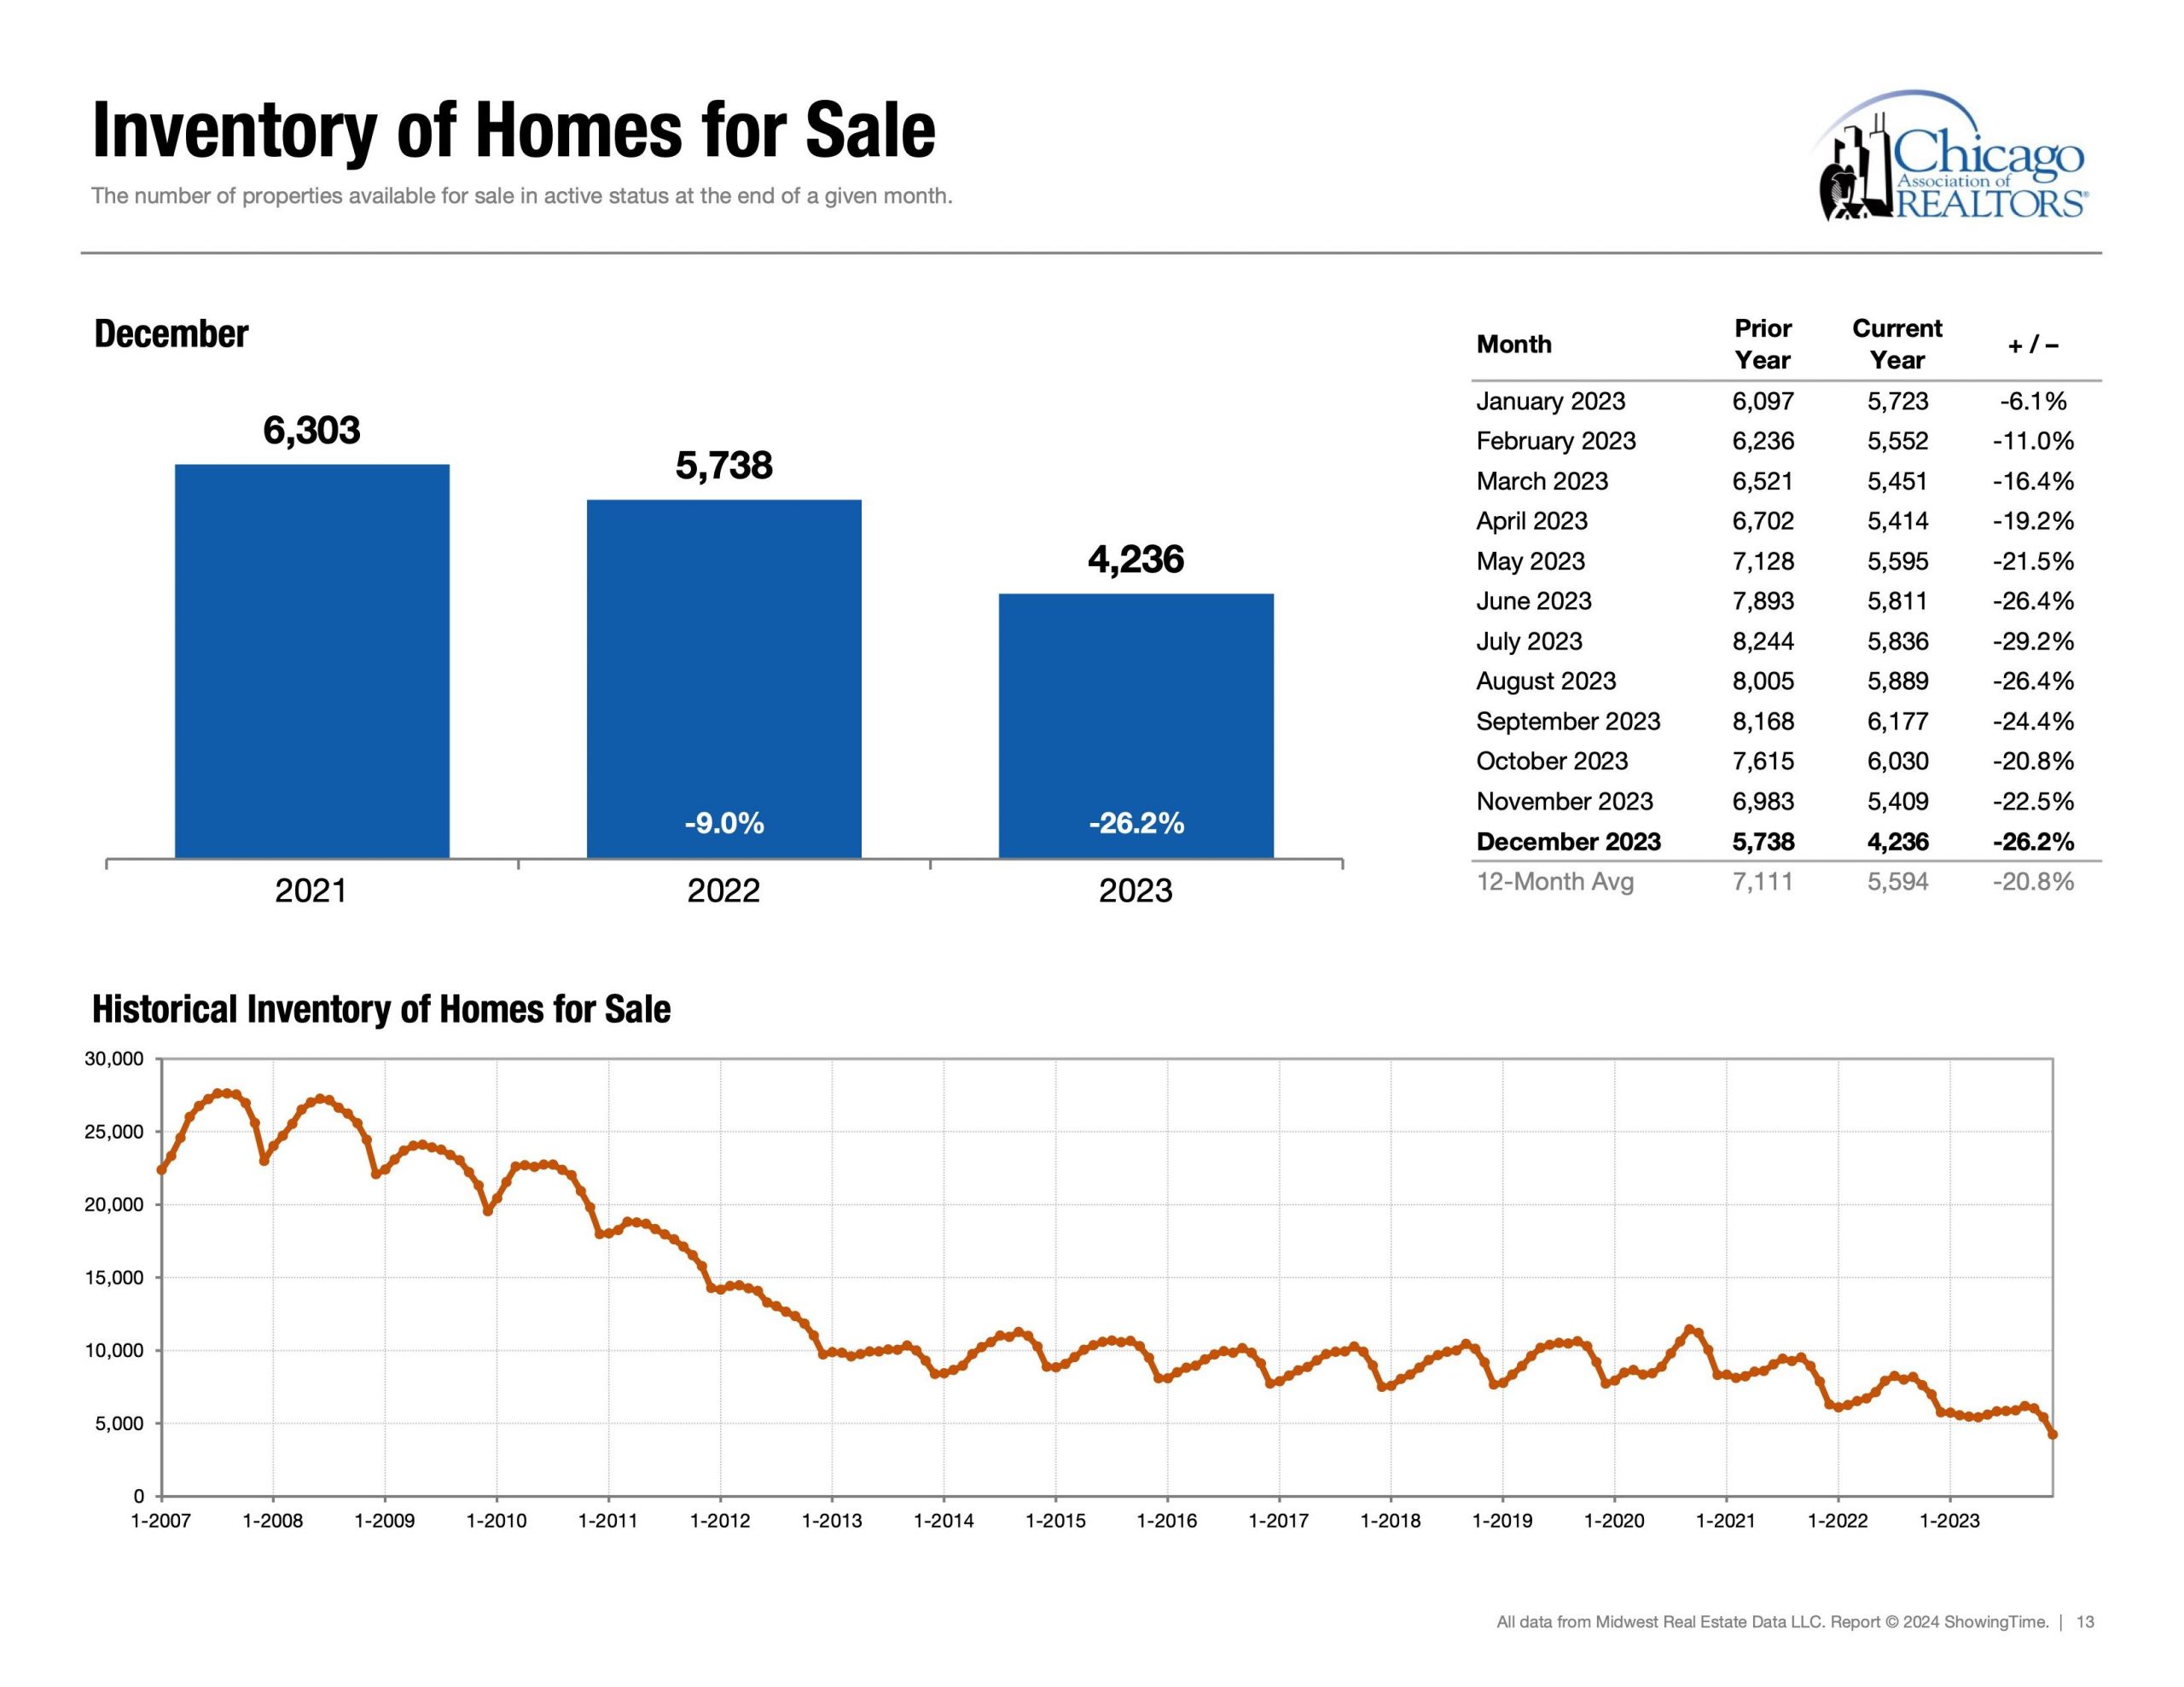
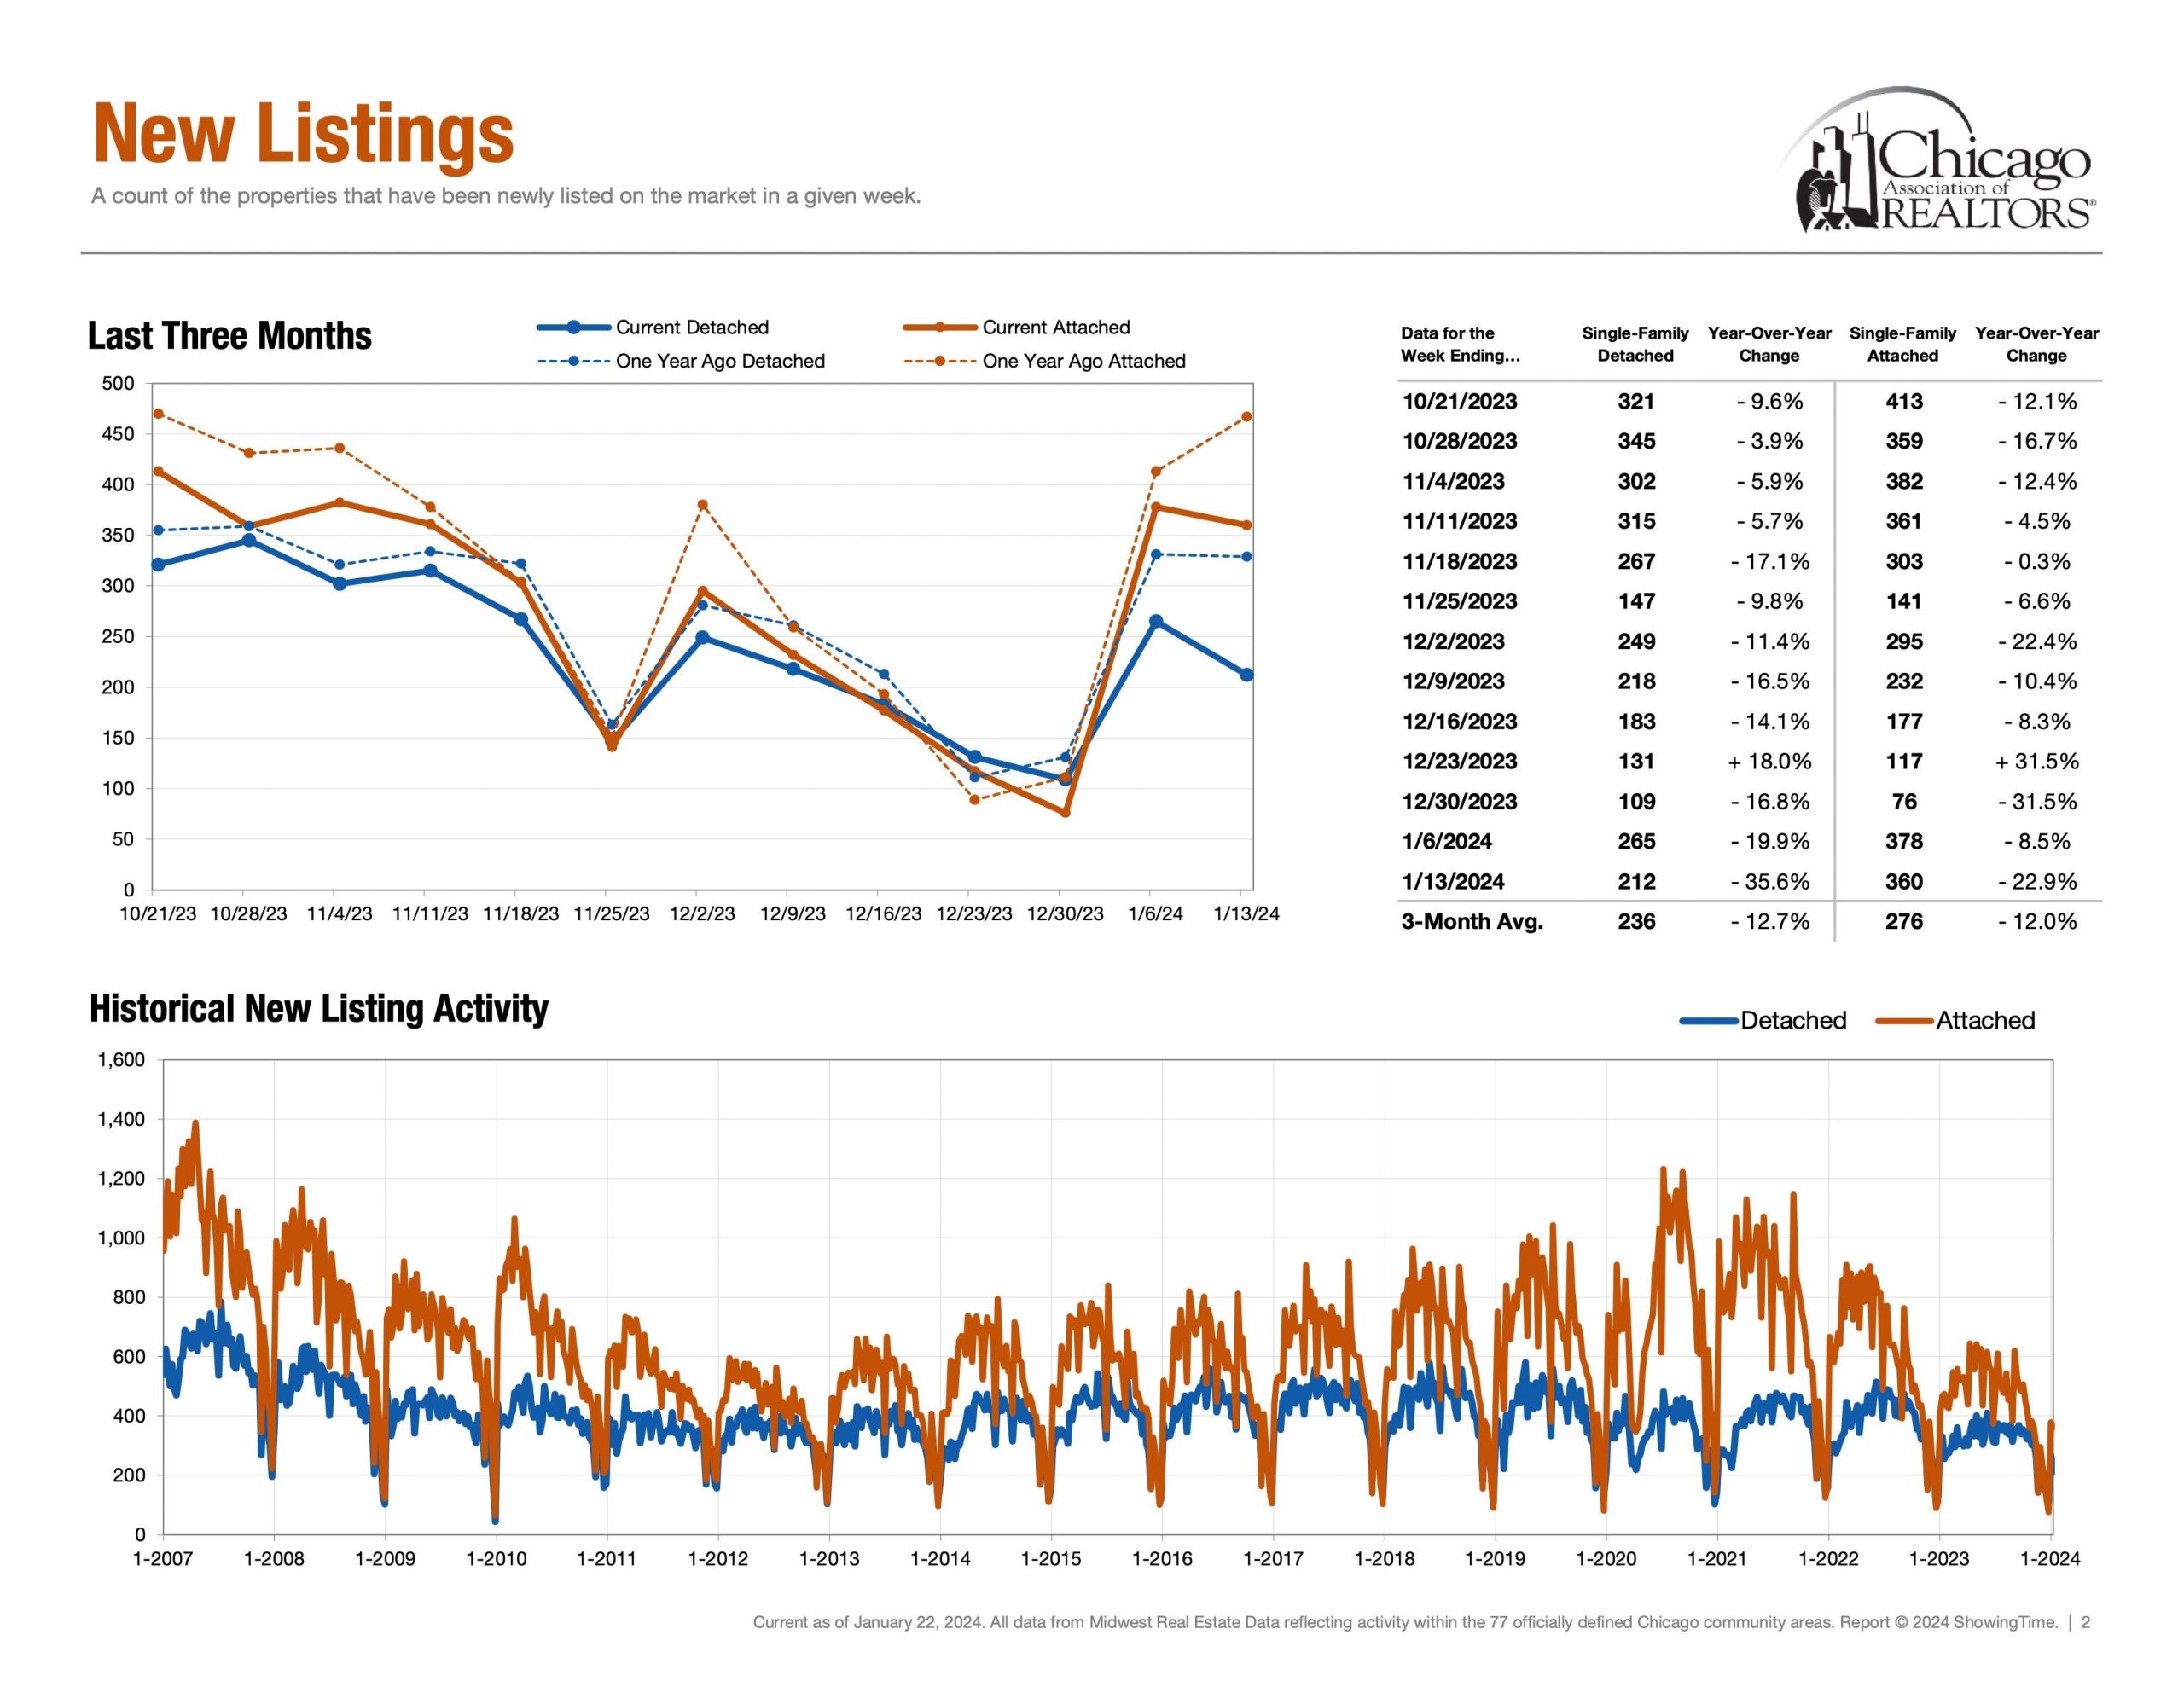
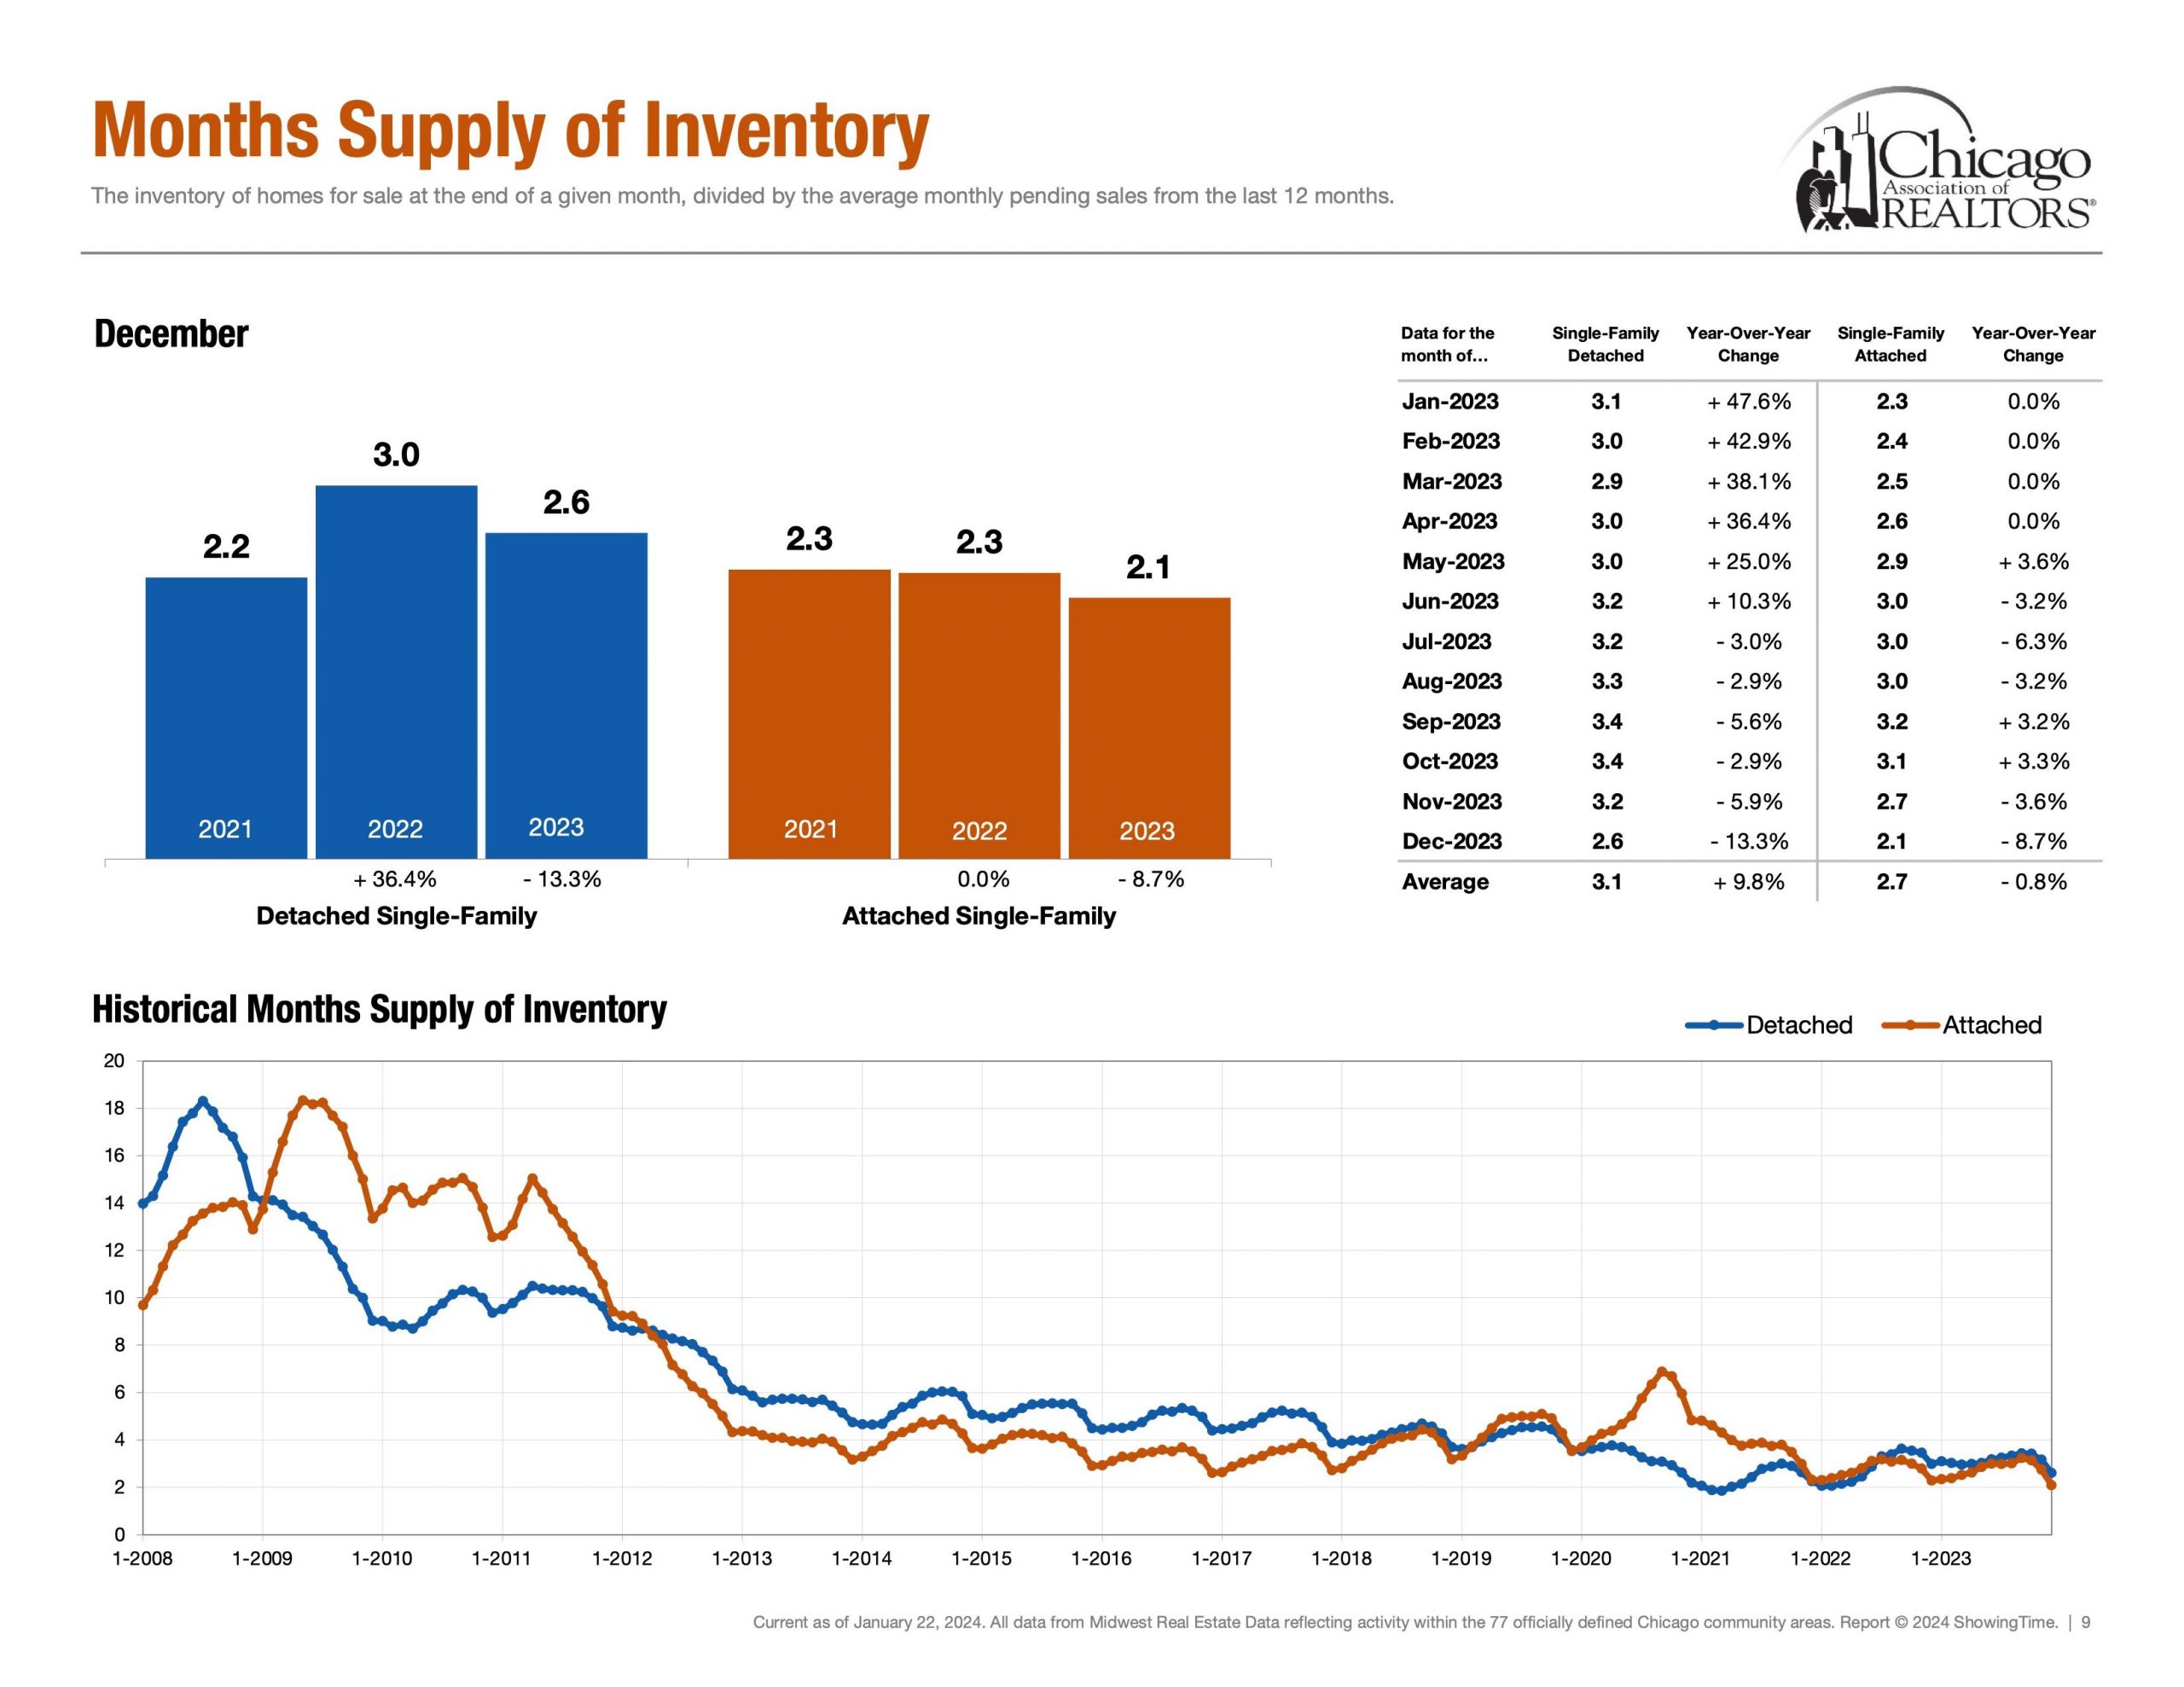
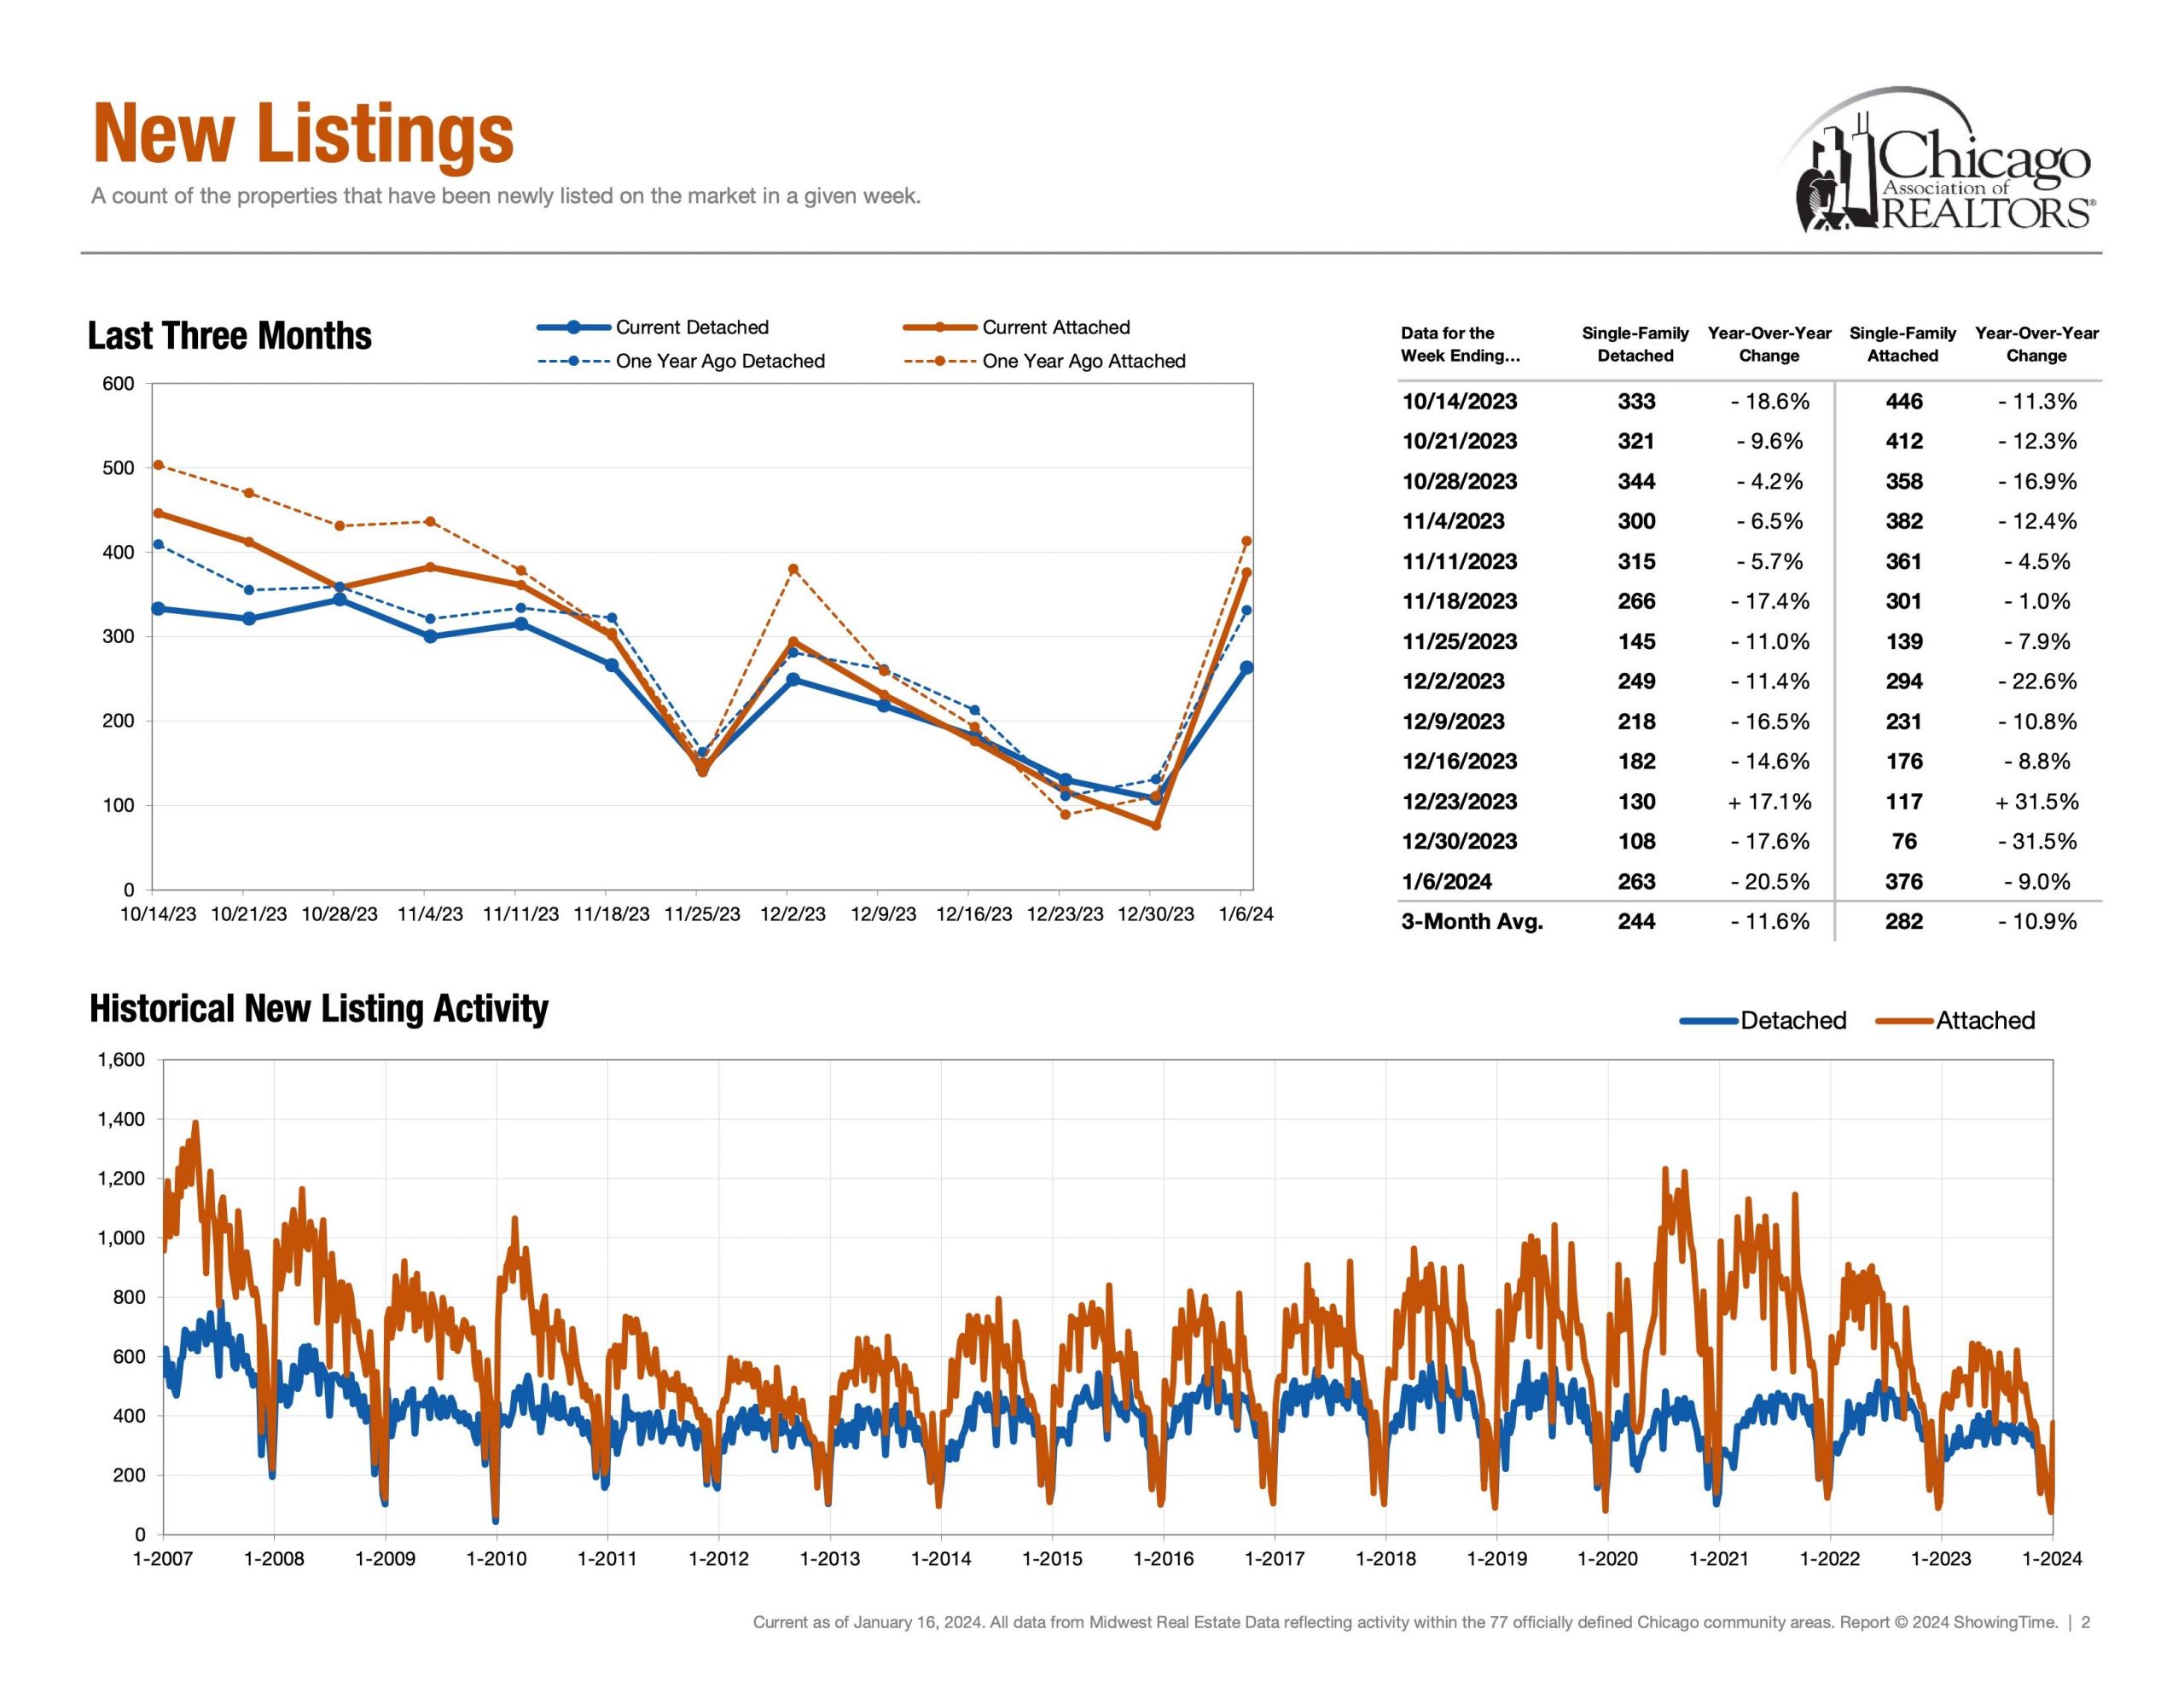
Supply | Inventory of Homes for Sale
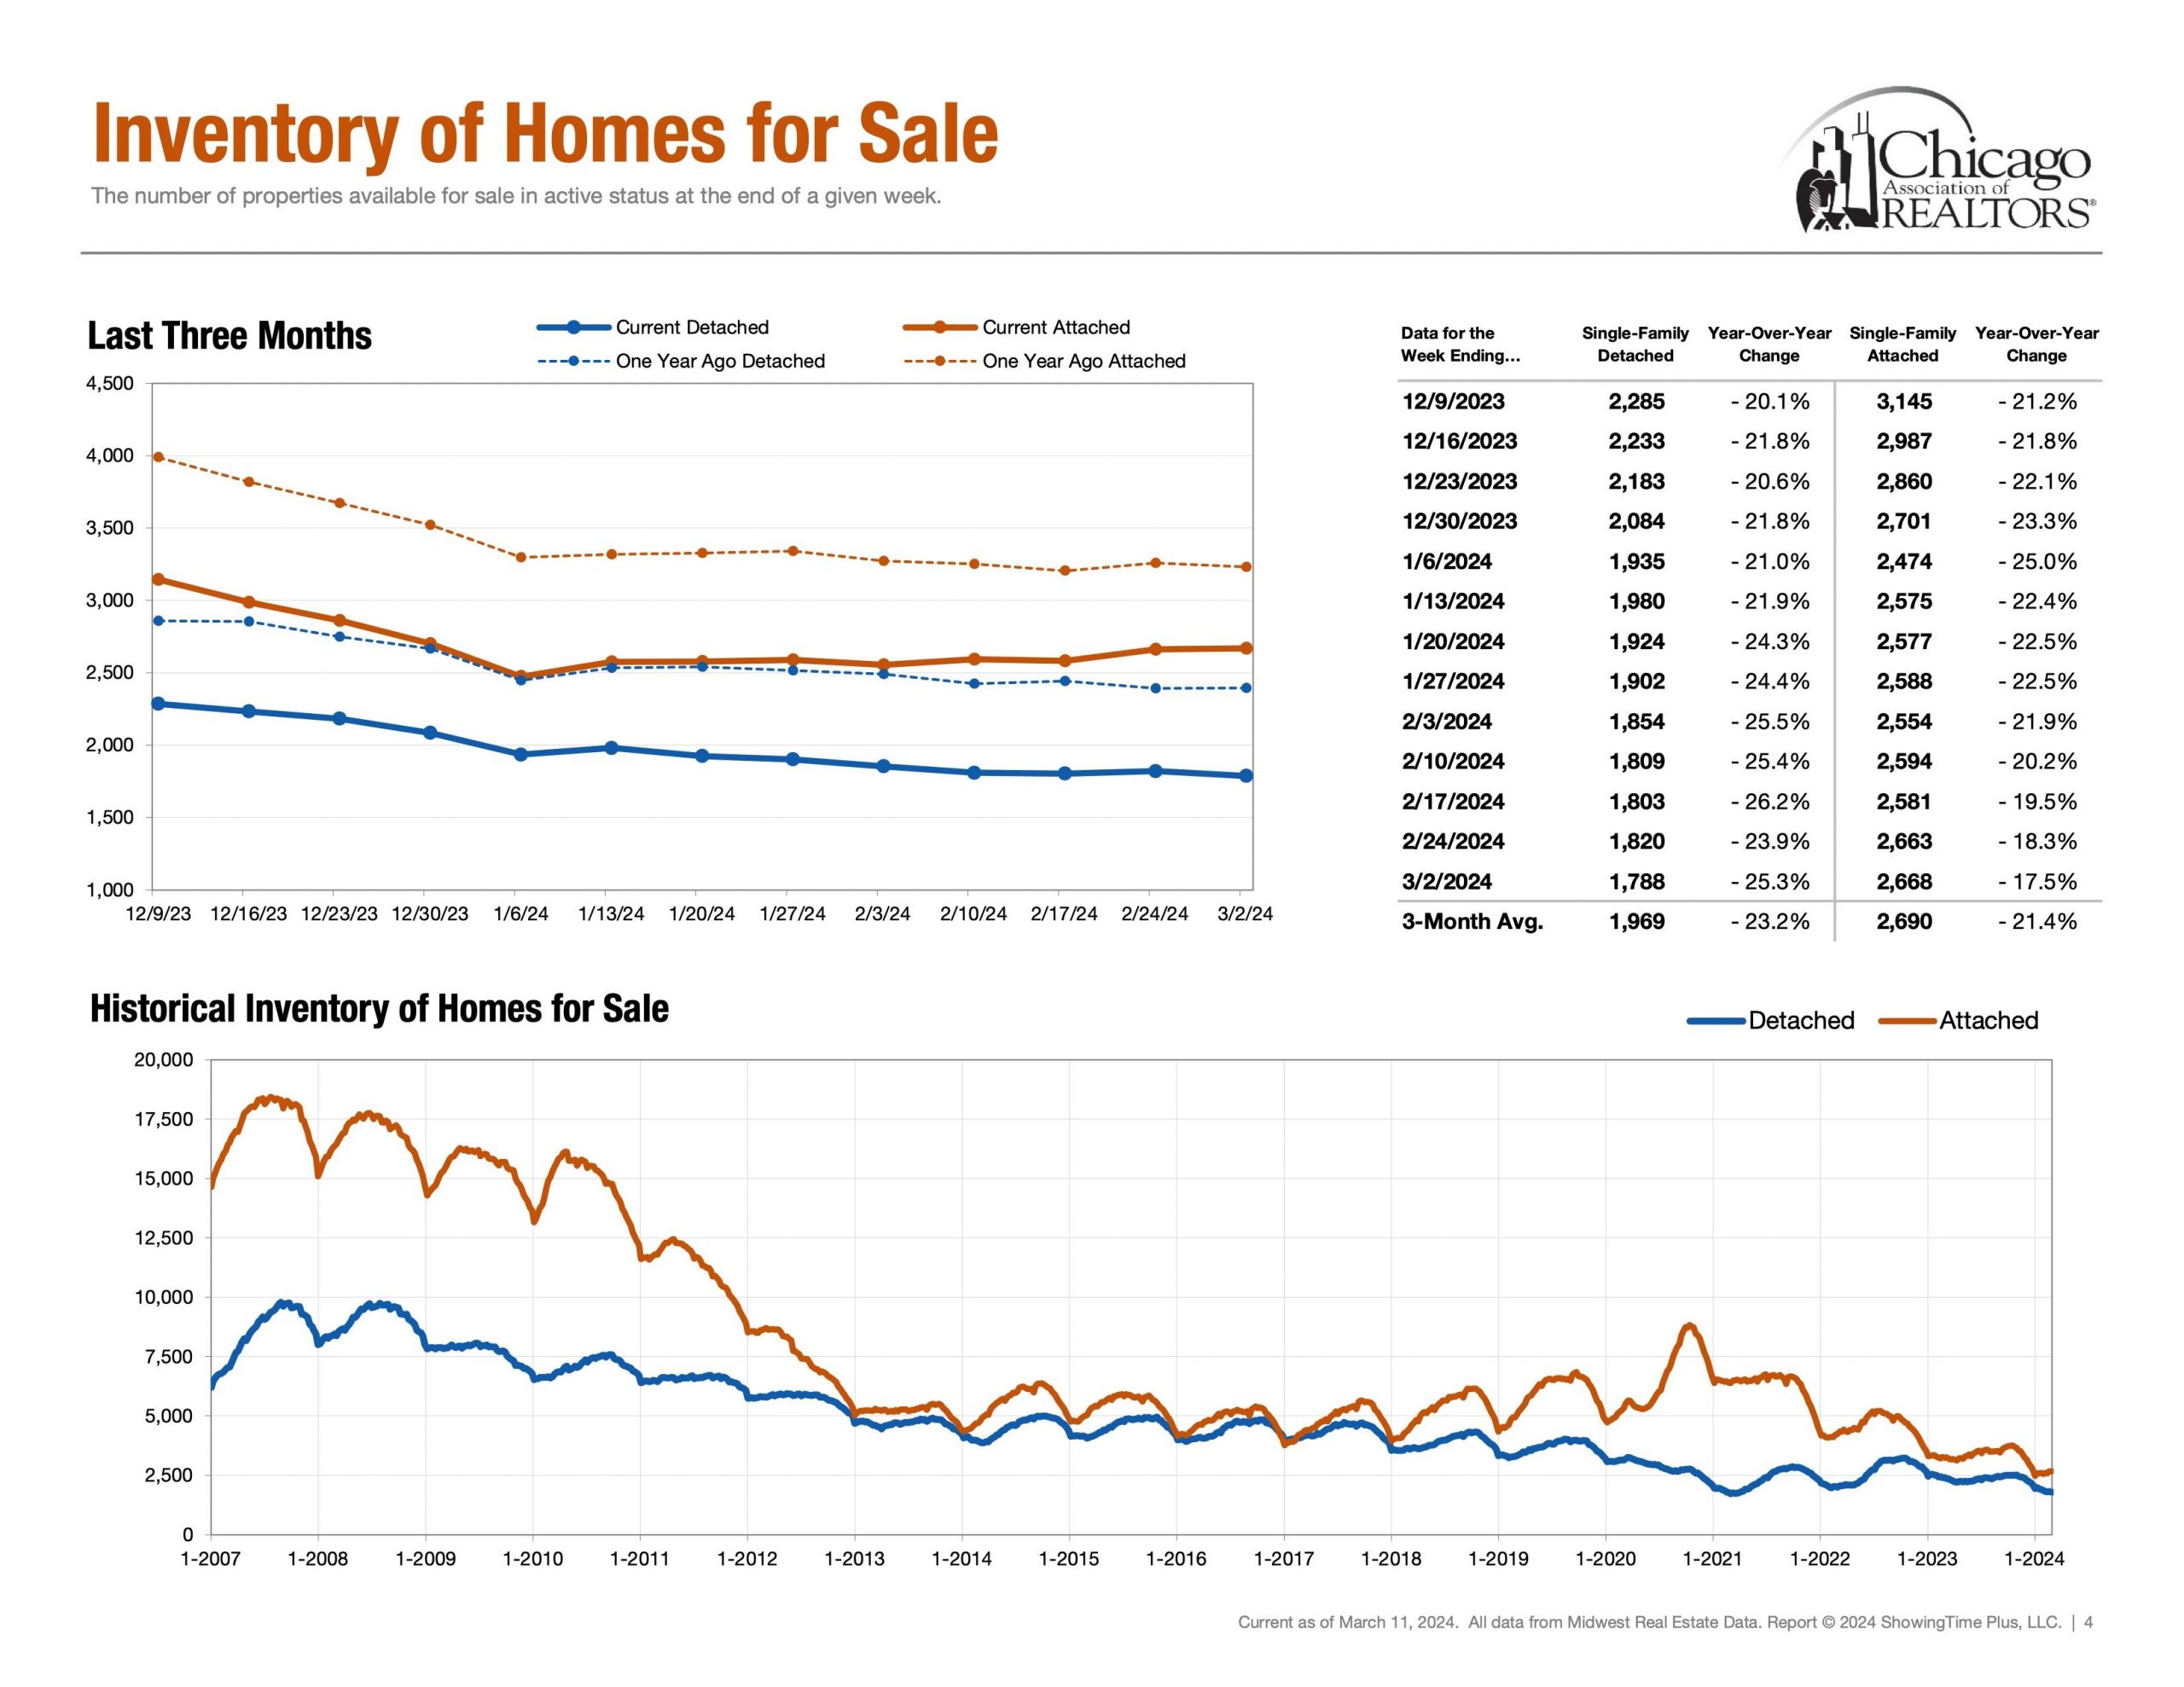
Detached Single = 1,788 Properties (Feb 25th – March 2nd)
Attached Single = 2,668 Properties (Feb 25th – March 2nd)
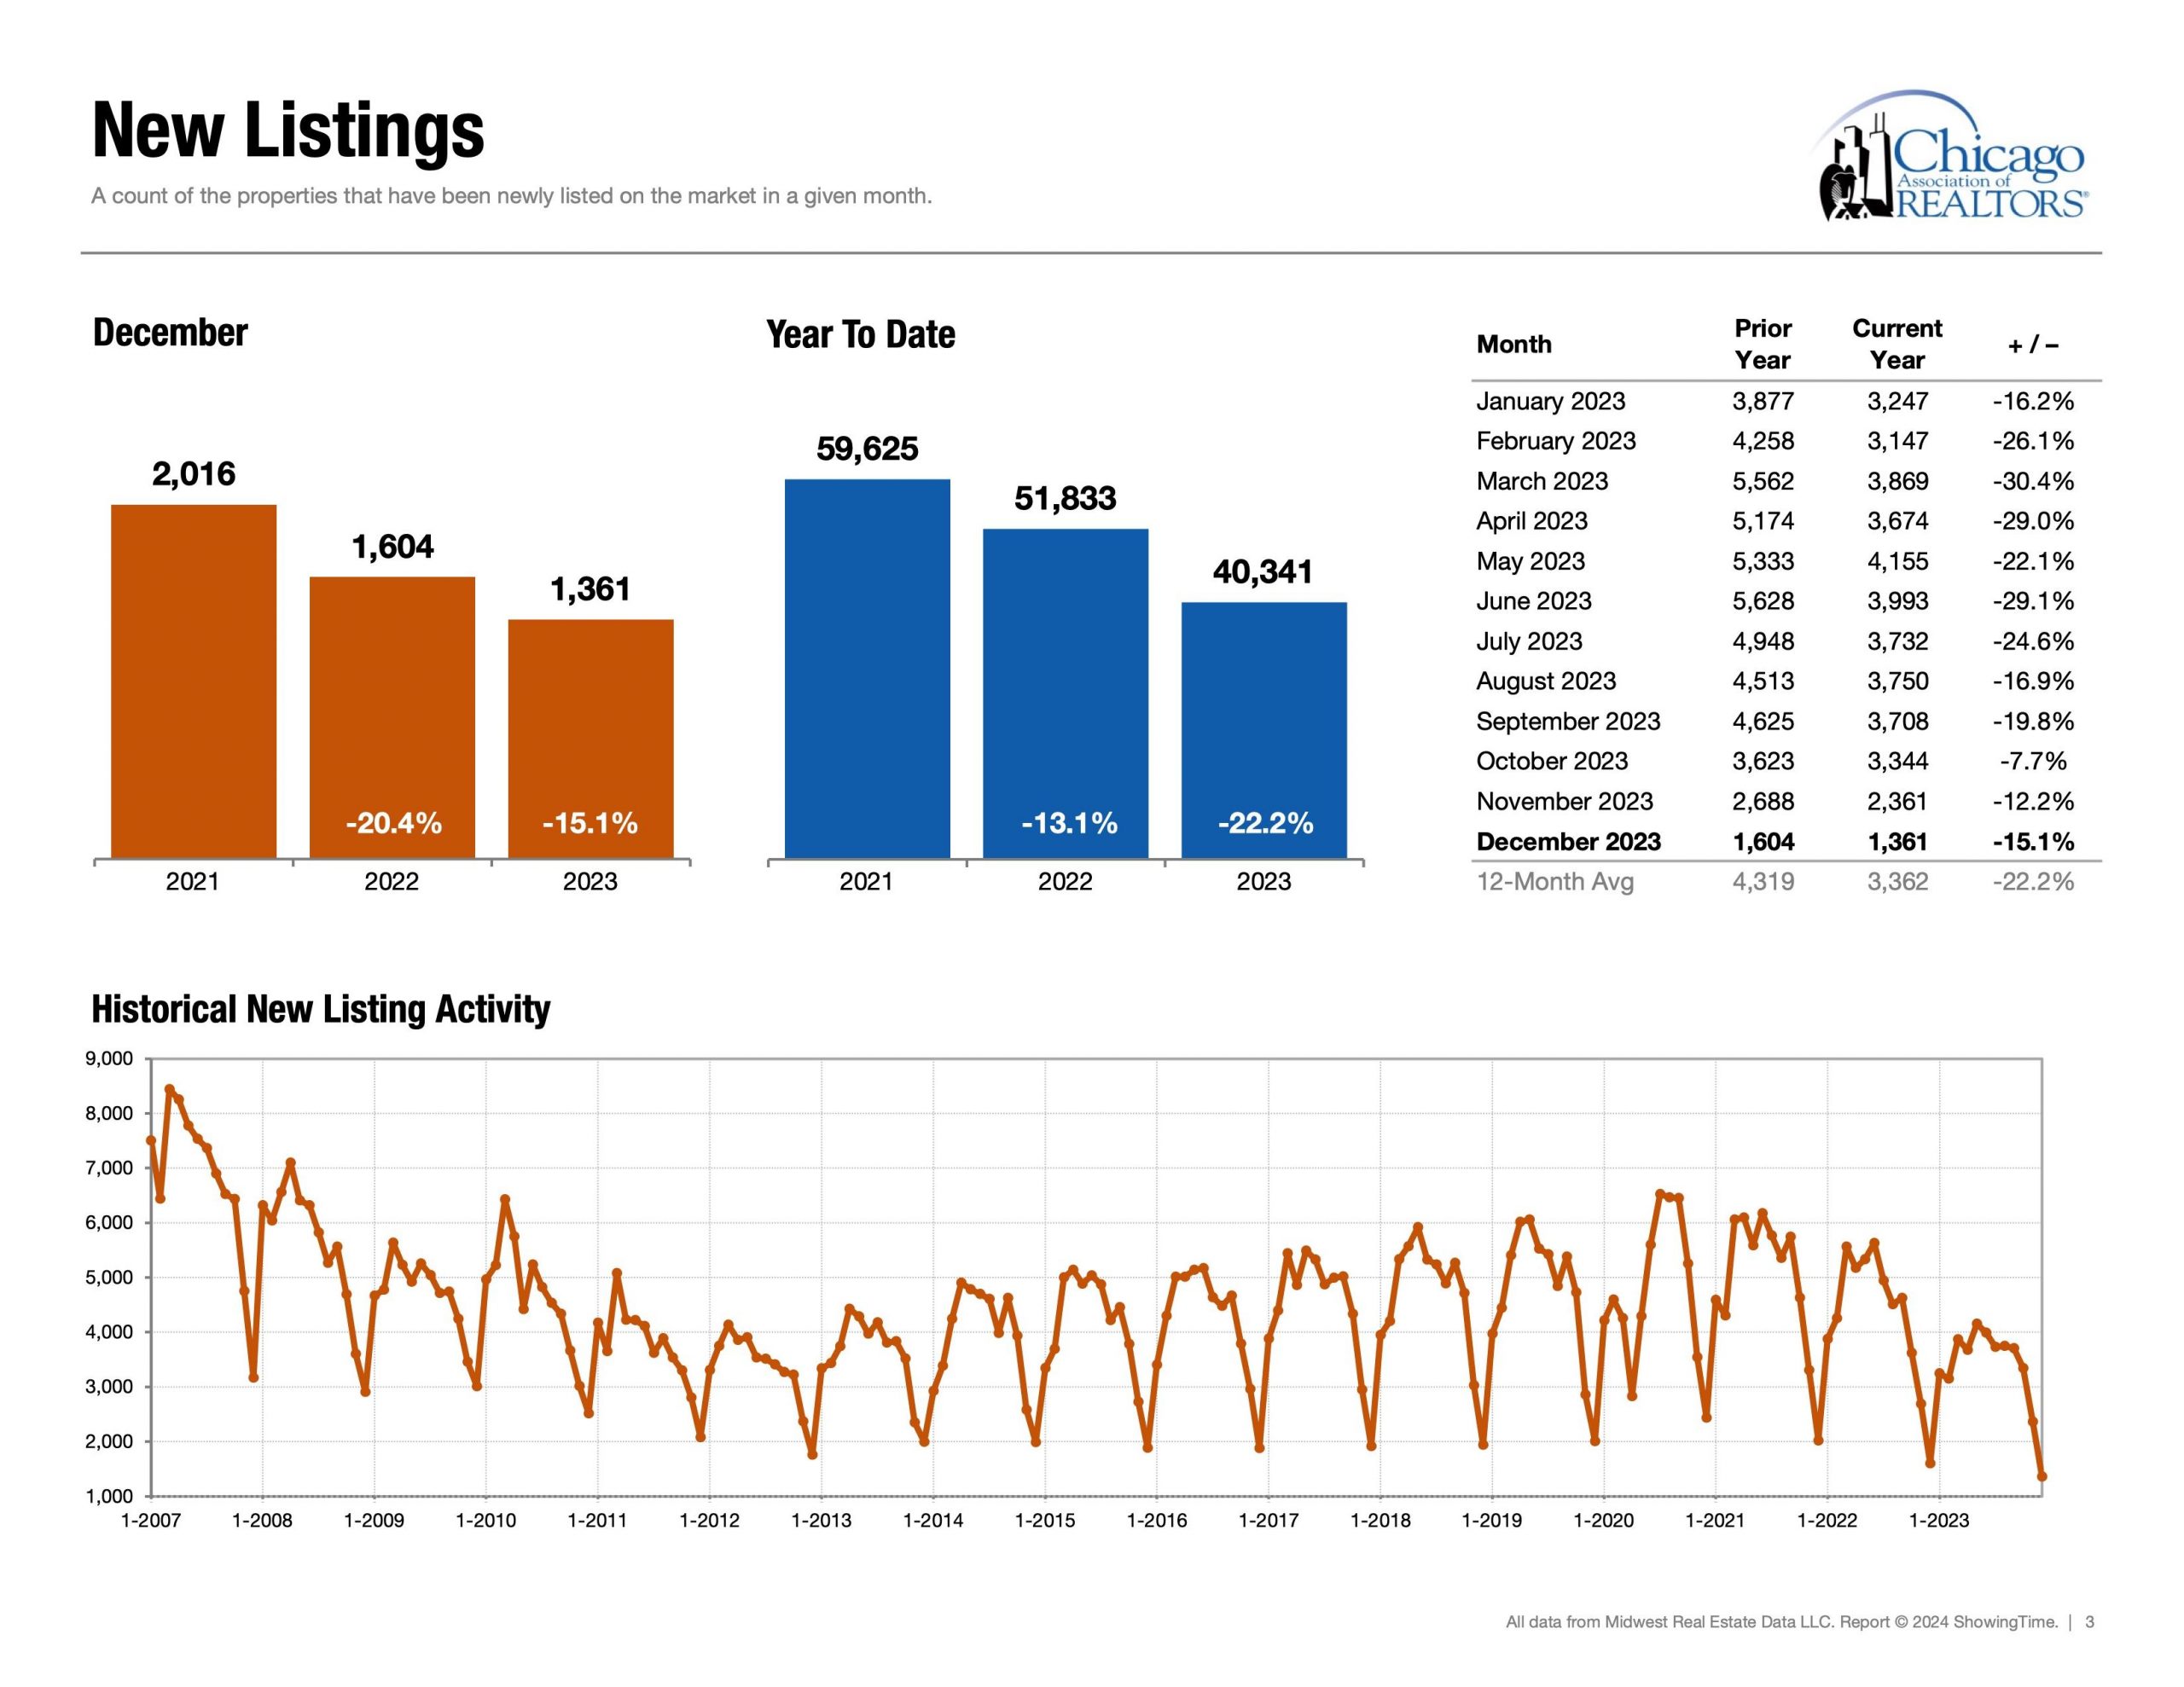
Next, supply showcases how much inventory is available for buyers and how much competition sellers are up against. Additionally, Months of Inventory, Homes for Sale, New Listings and Absorption Rate are also other key metrics in the conversation of supply.
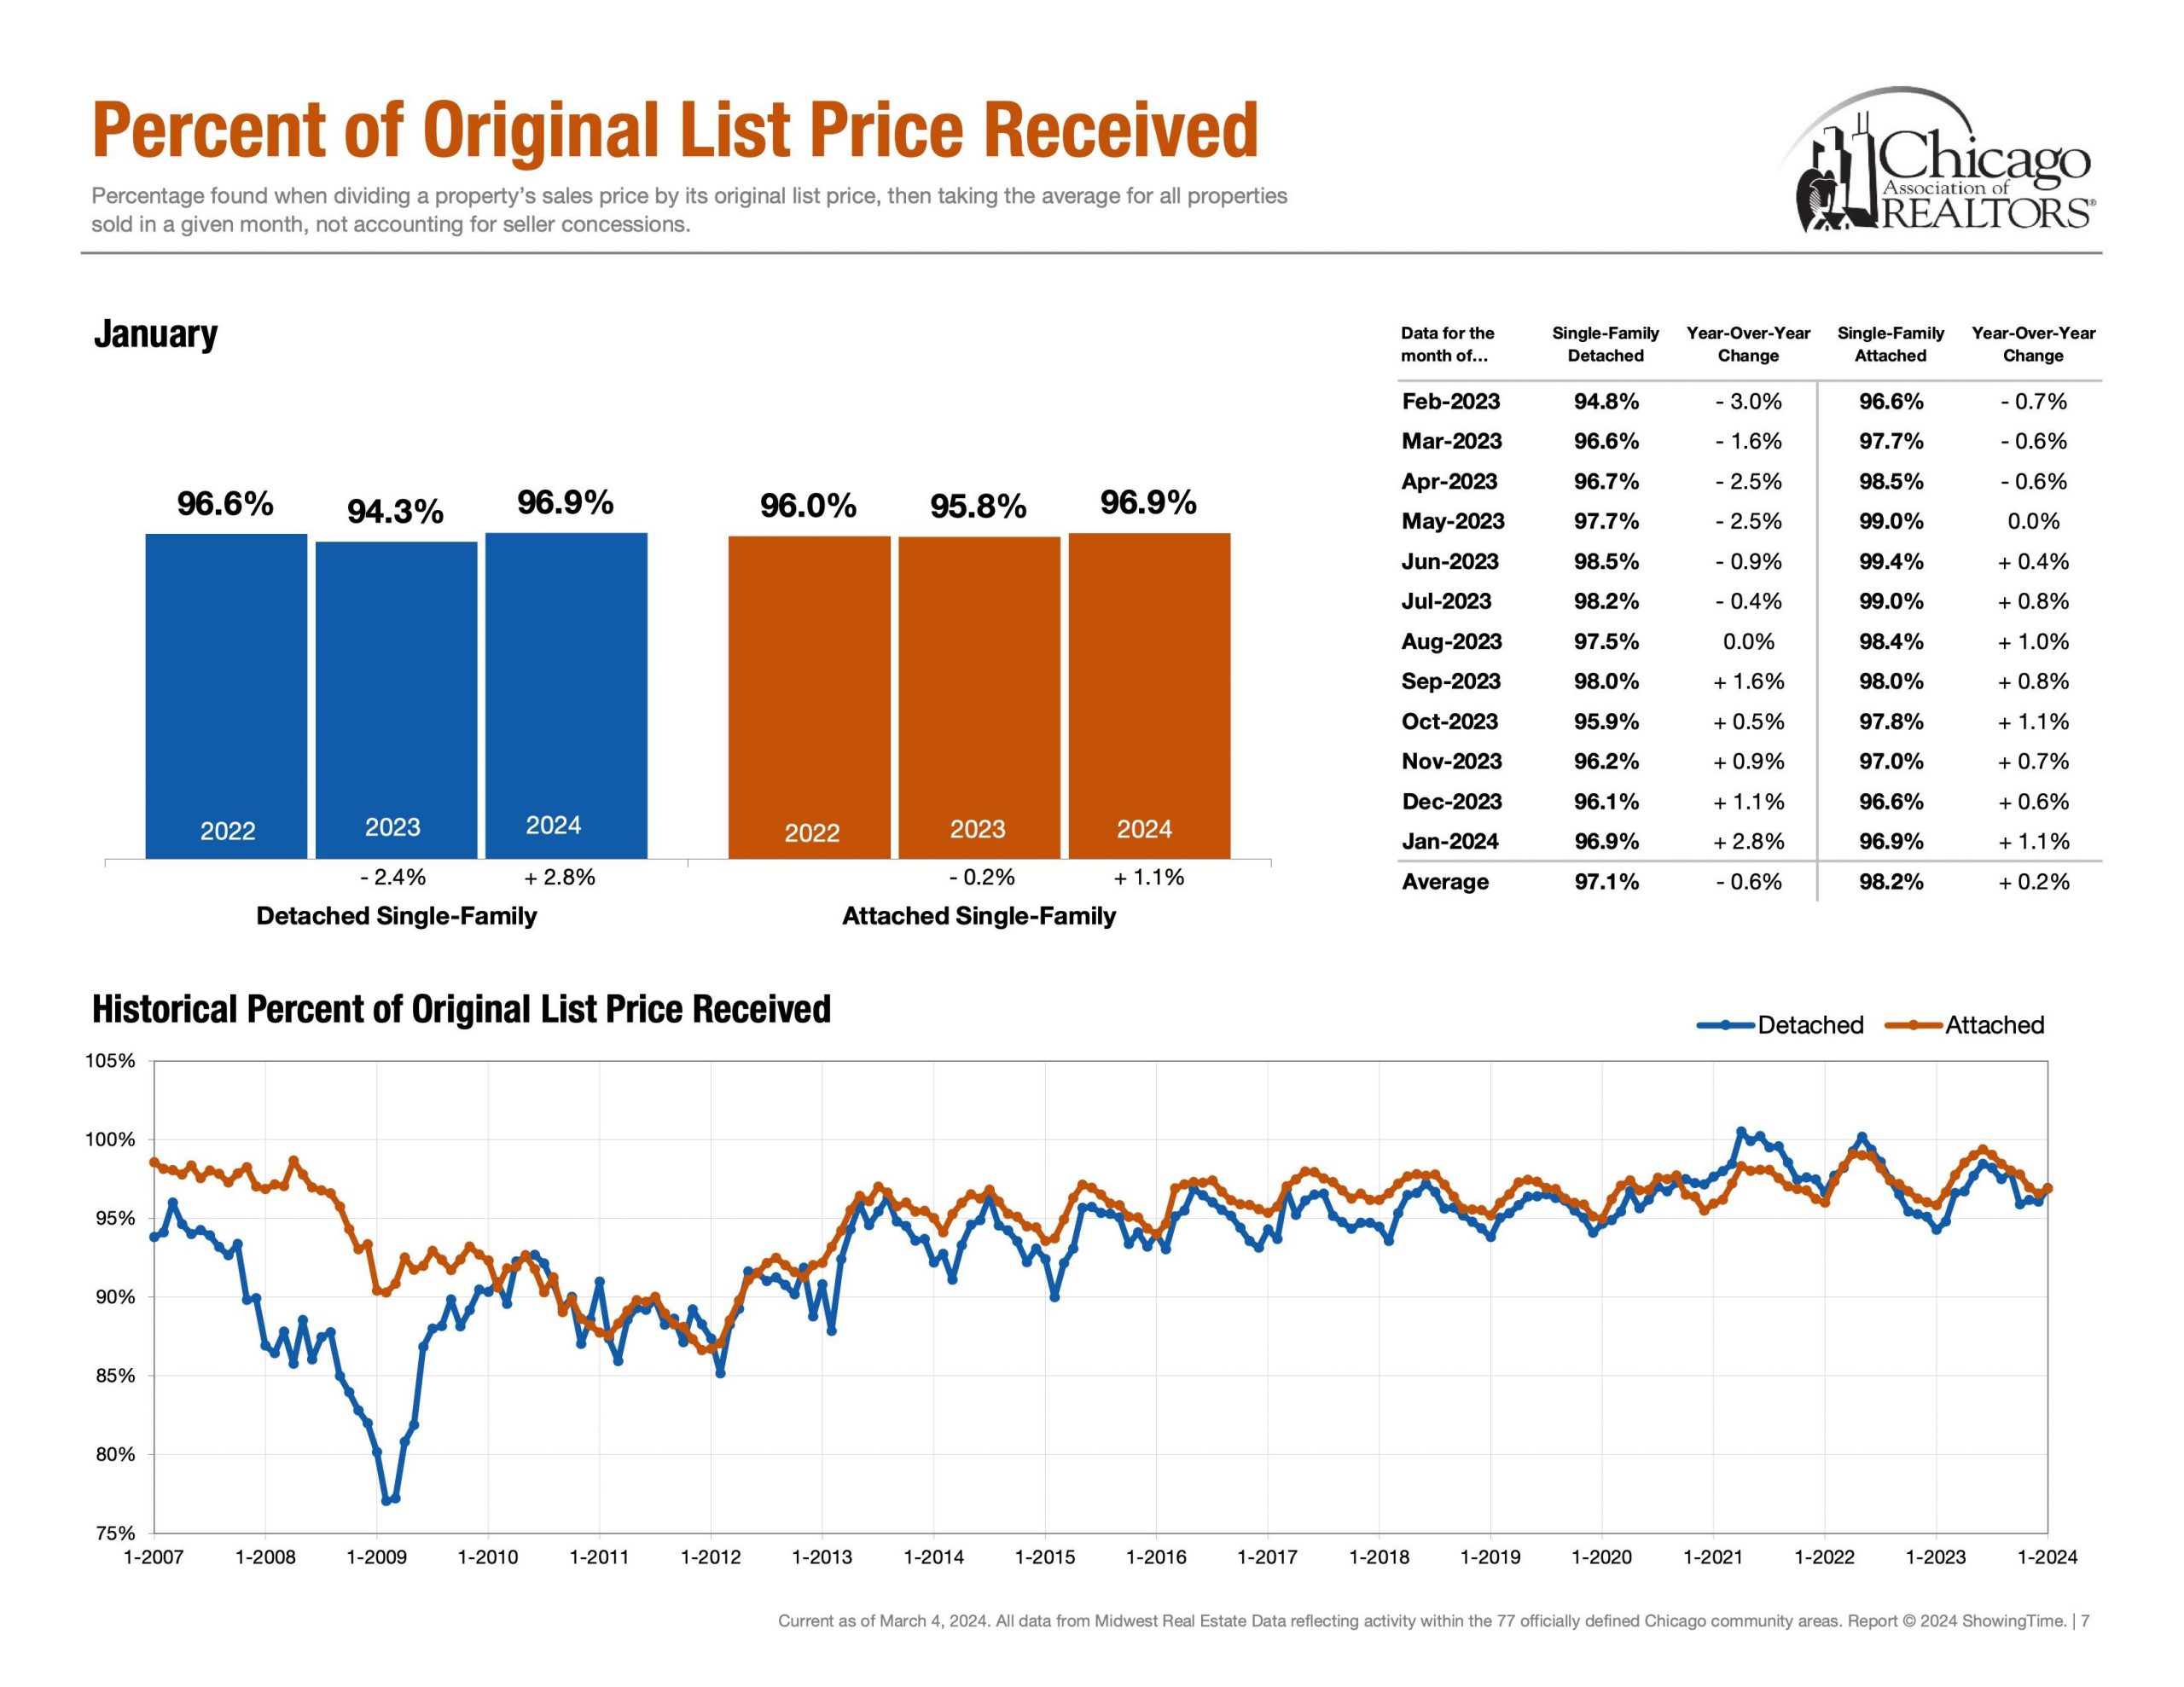
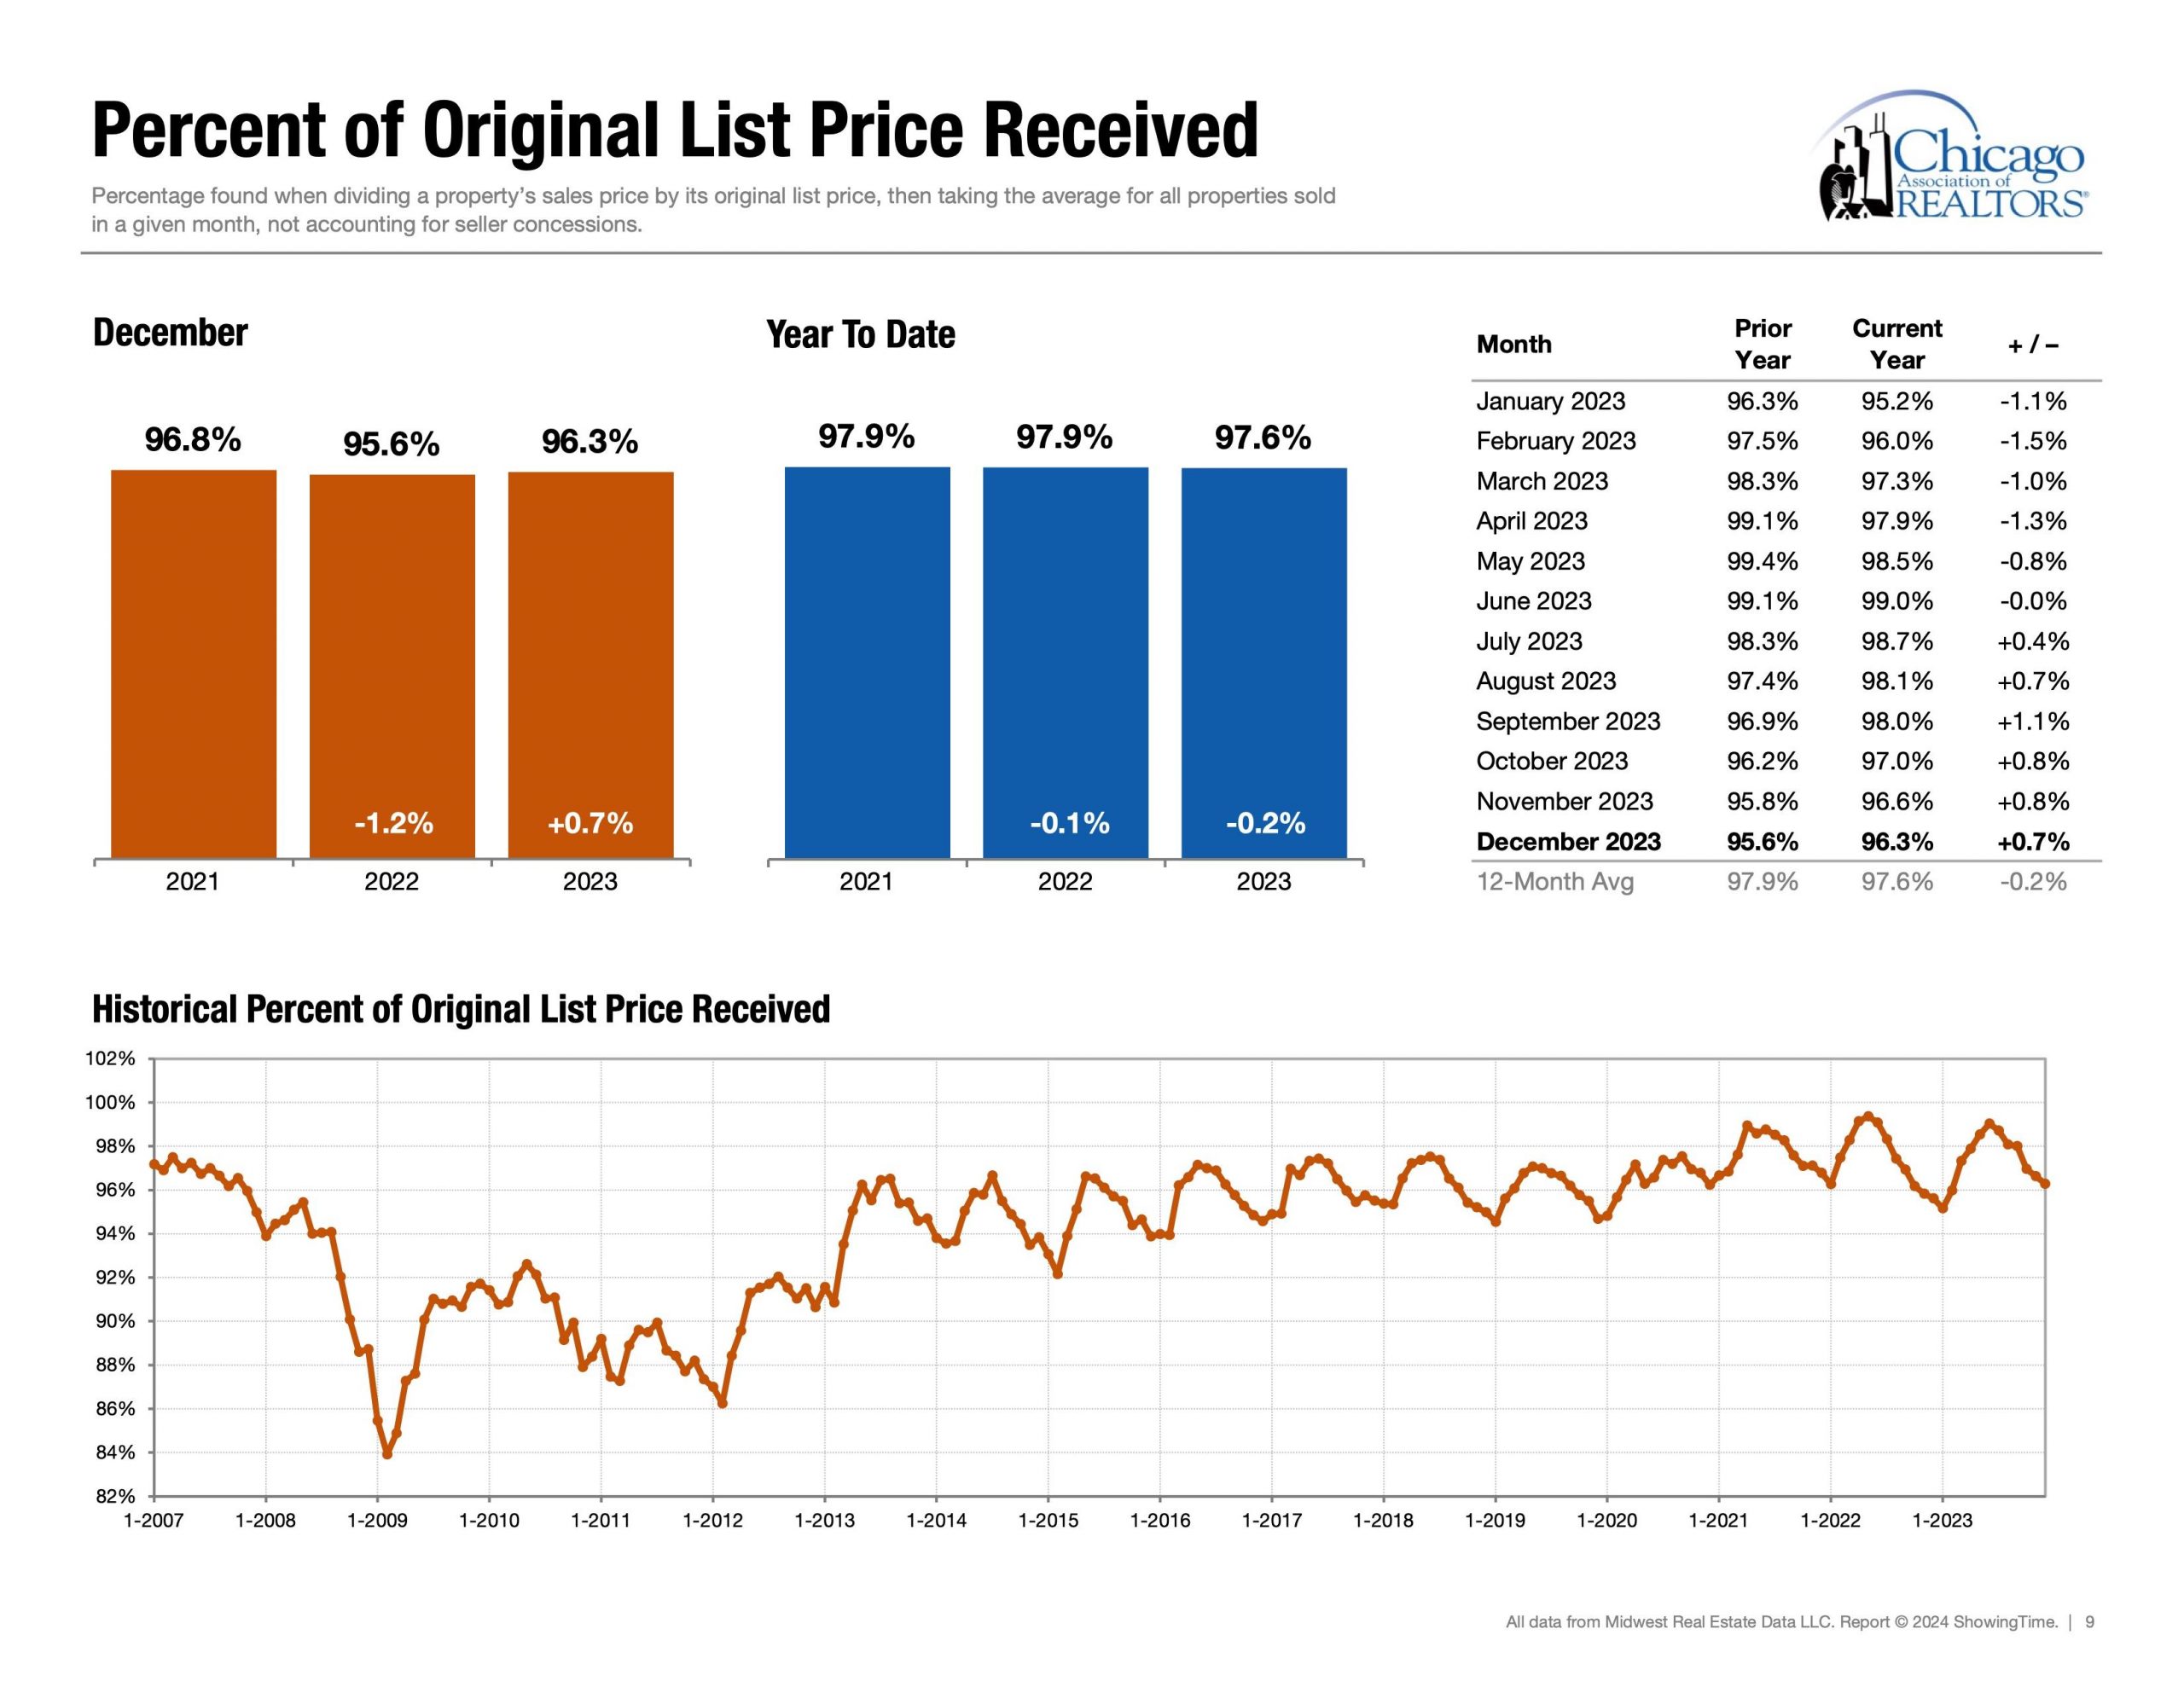
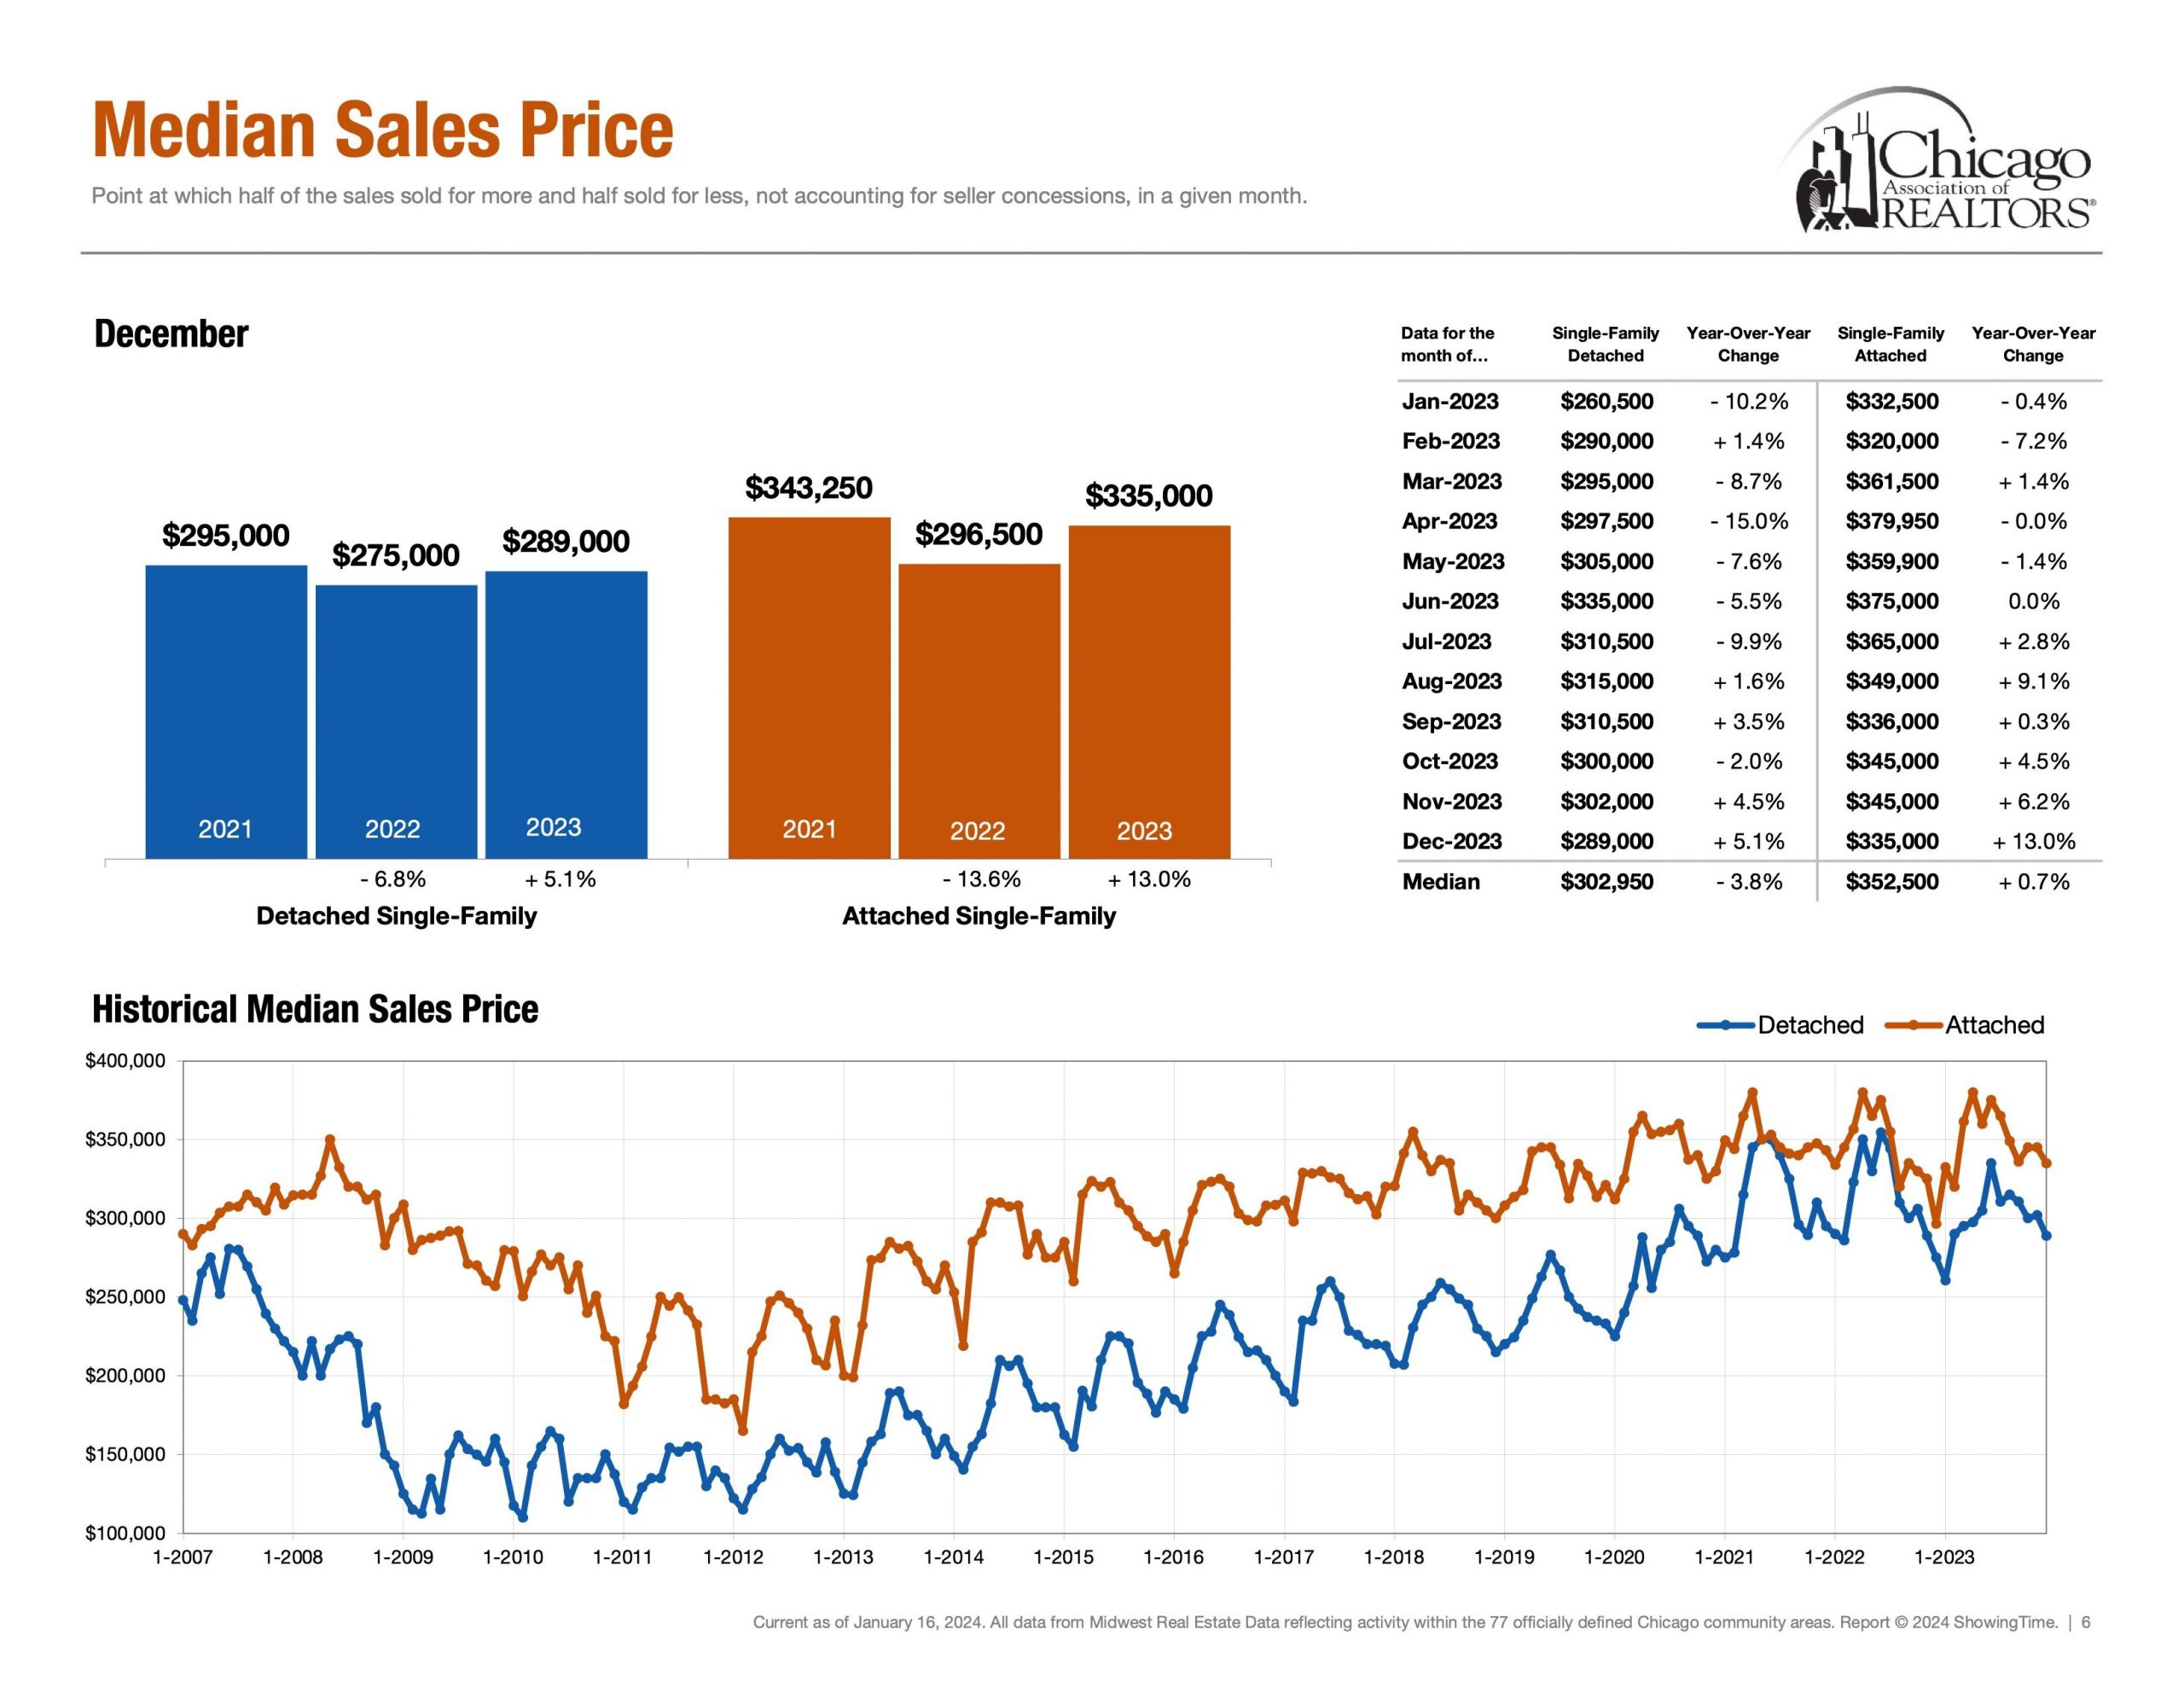
Negotiations | Percentage of Original List Price Received
Detached Single ~ 97.2% (Rolling 12 Months Avg) & ~ 96.8% (Feb 24′)
Attached Single ~ 98.2% (Rolling 12 Months Avg) & ~ 97.6% (Feb 24′)
Lastly, Percentage of Original List Price Received to Closed Price is a metric that showcases what the average accepted purchase price is relative to the list price. How much below asking price can an offer go while still getting accepted? How much would one have to offer above ask in order to be an above average purchase price?
The End | Have A Great Day!
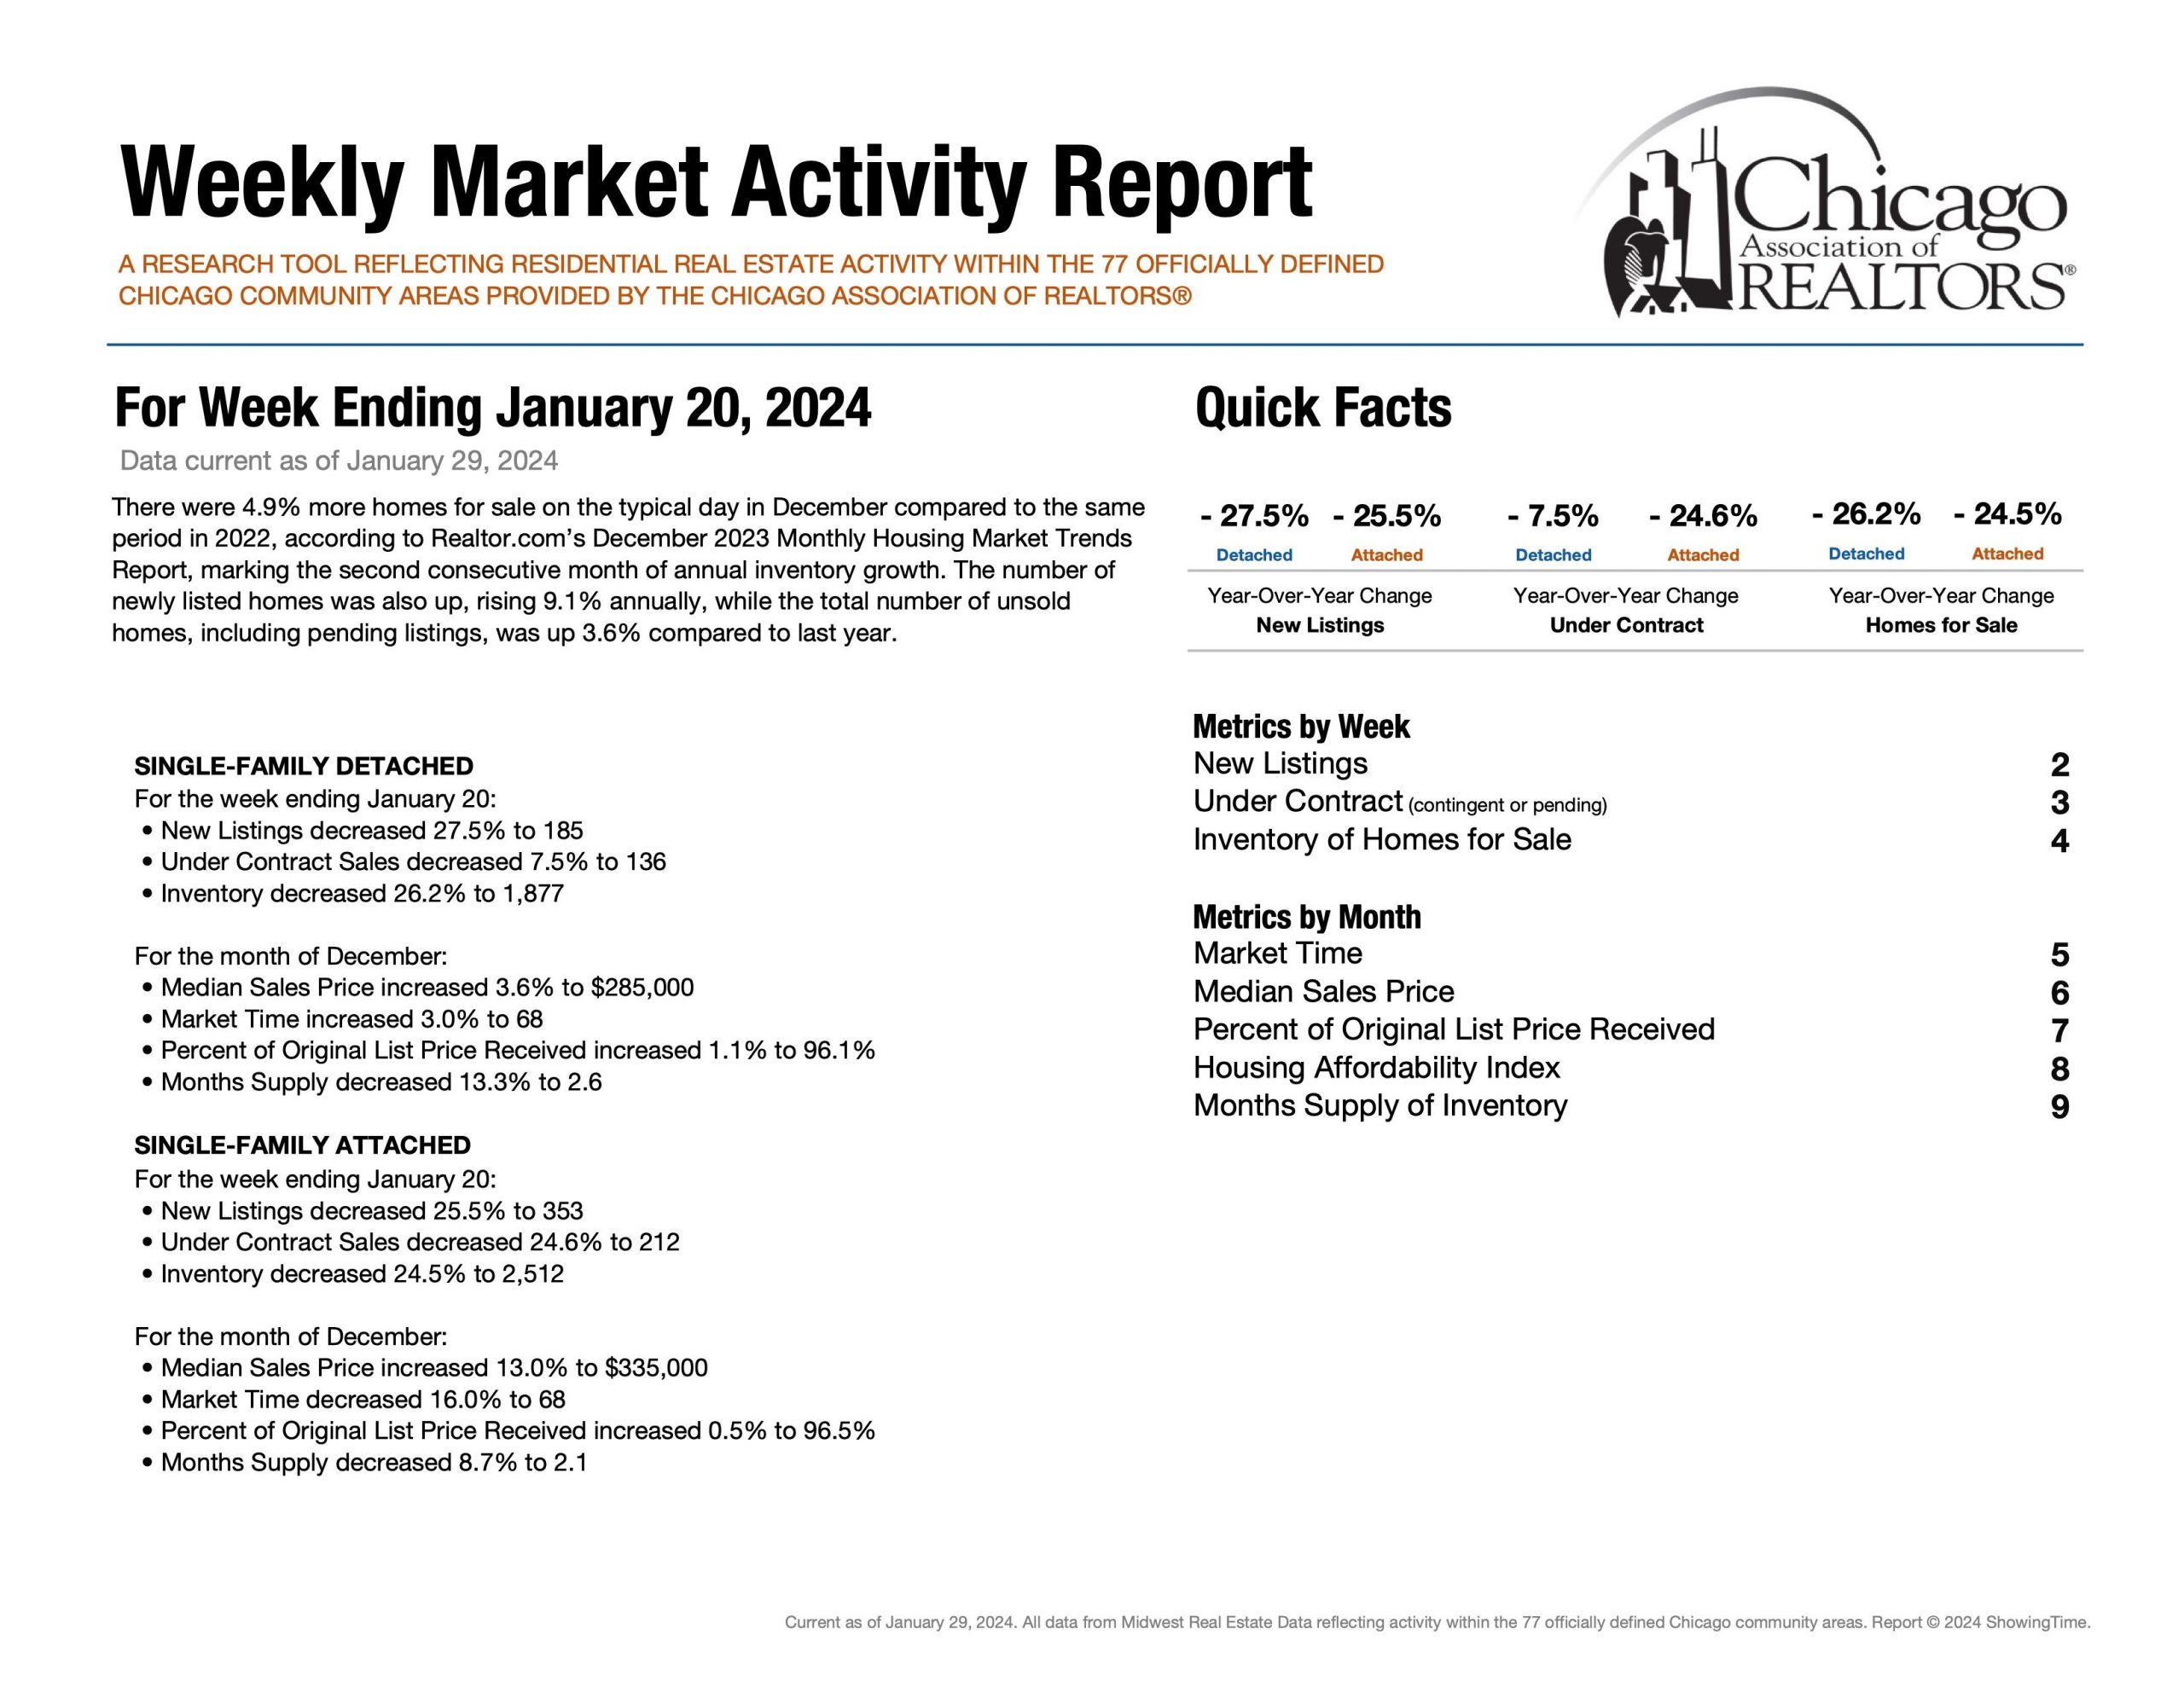
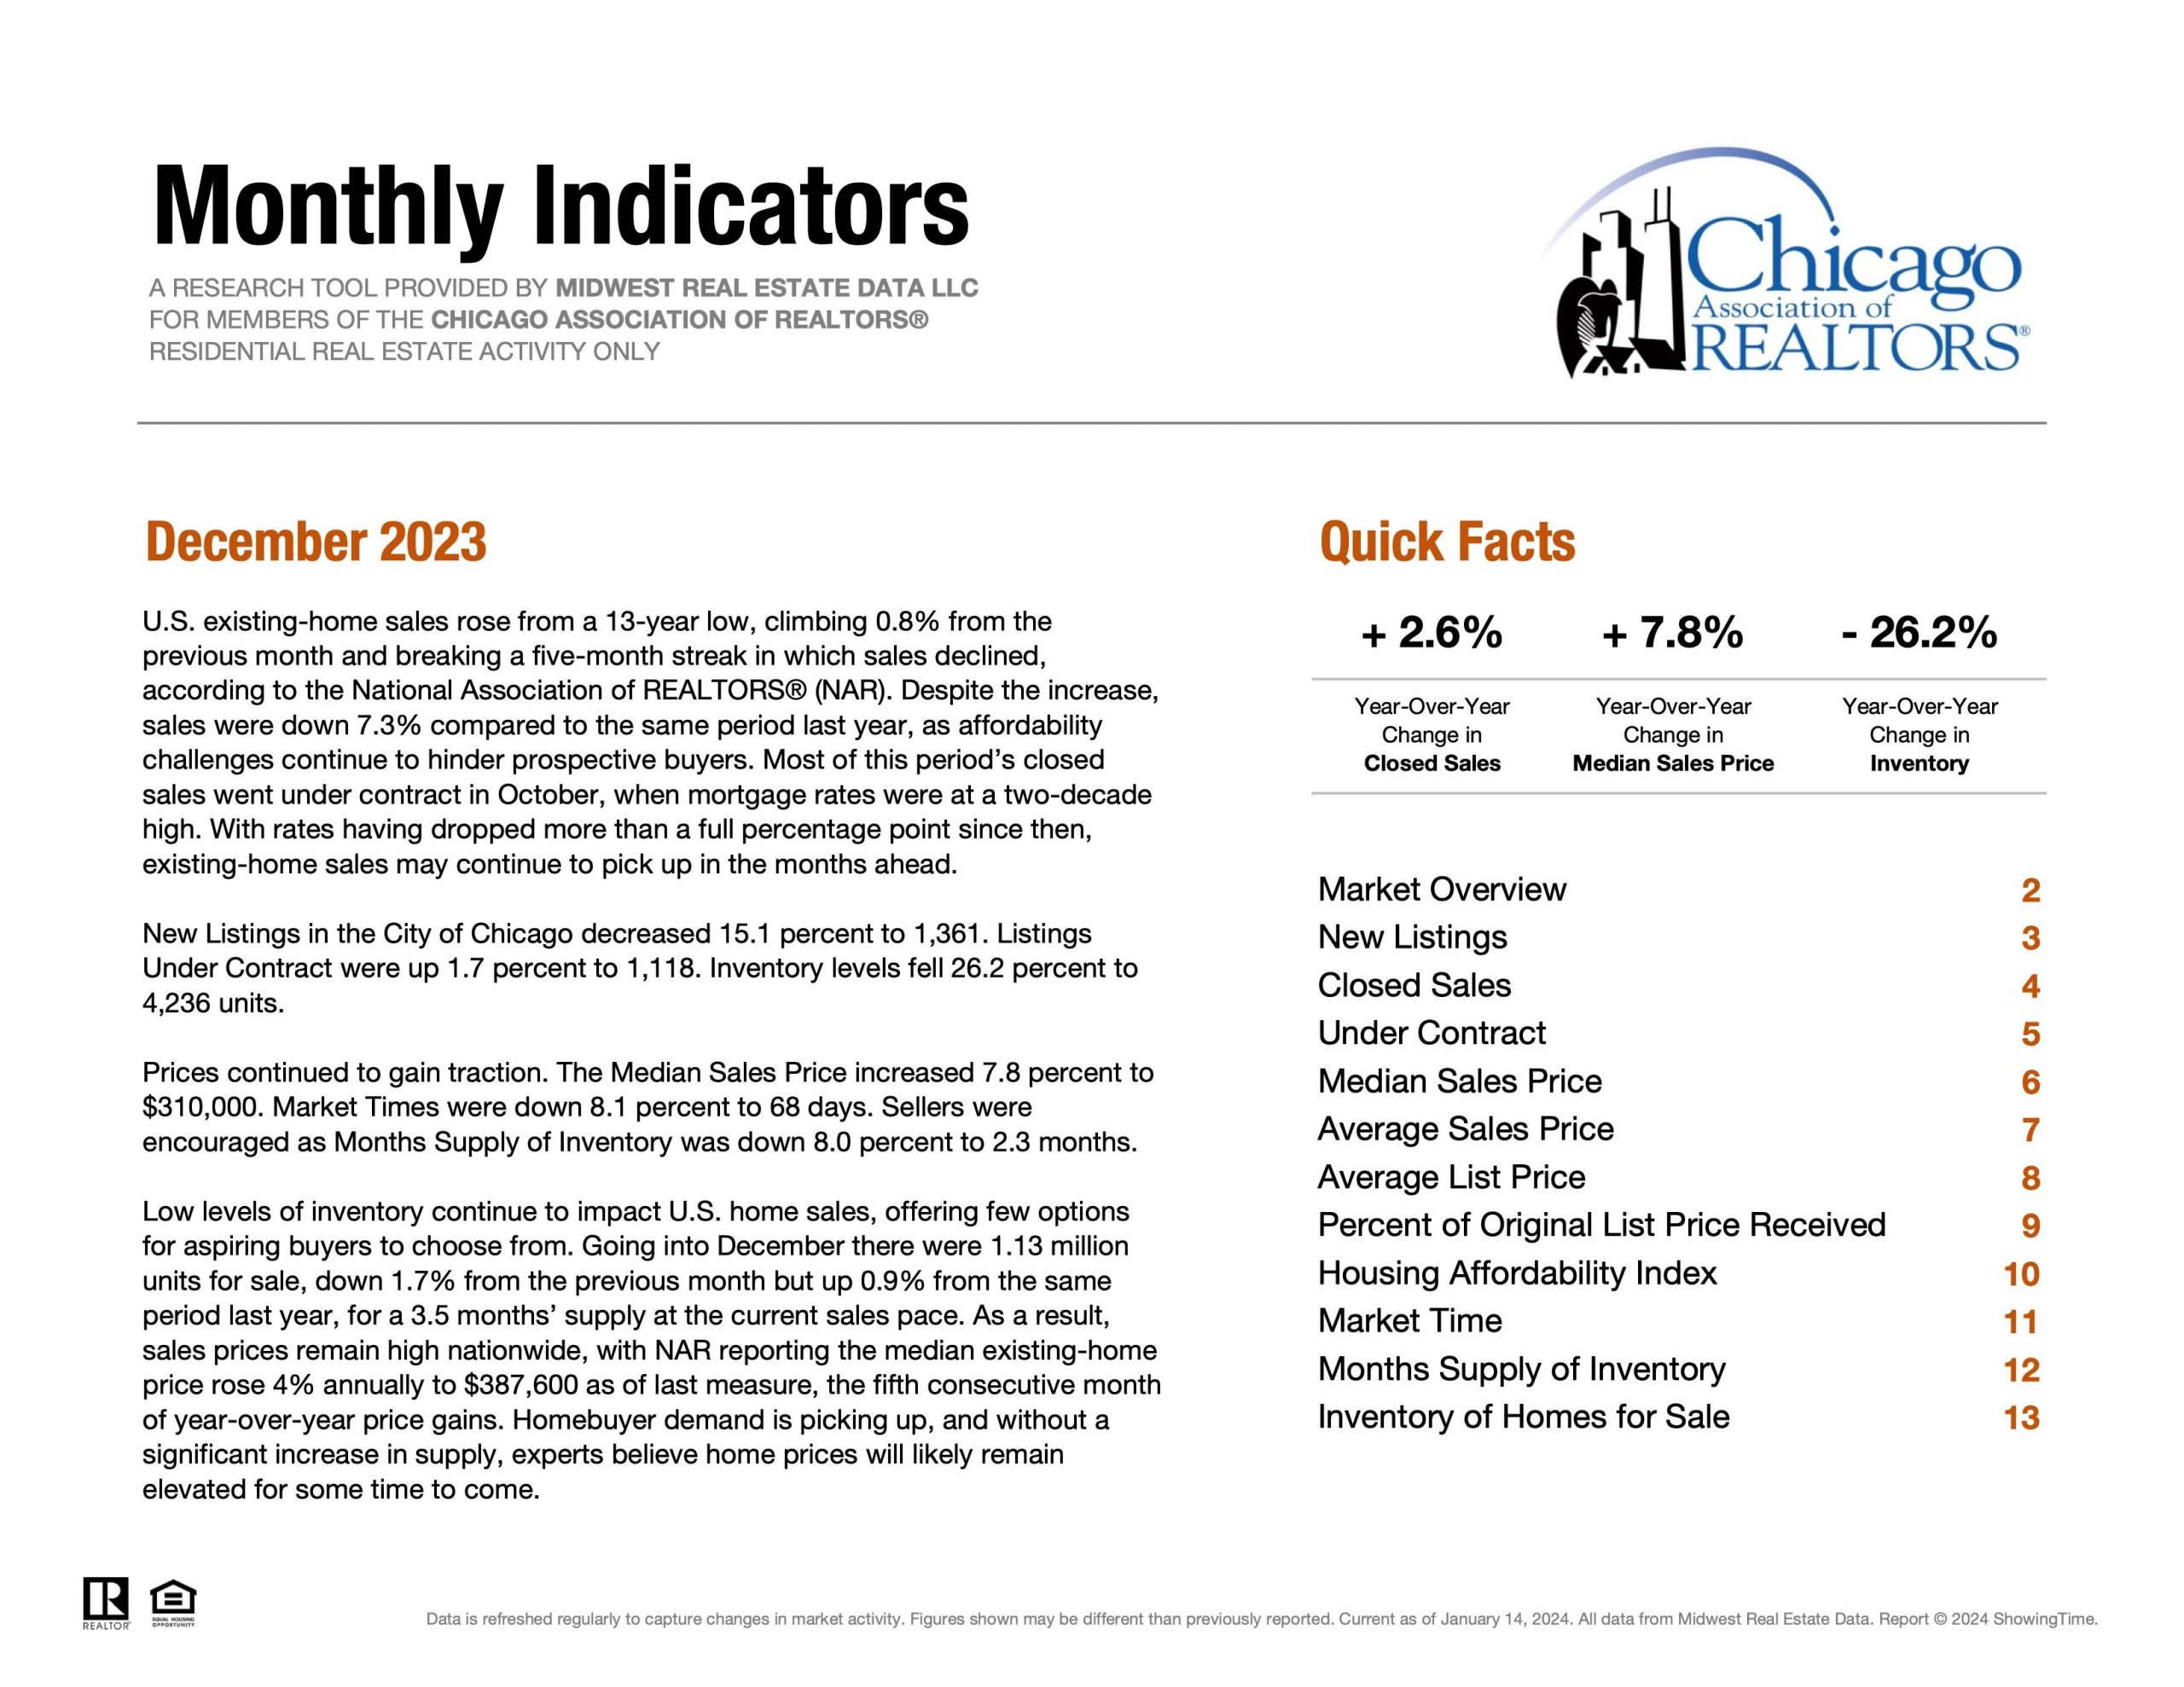
Please note all of these metrics are along a spectrum as opposed to a specific number. Below is “The Weekly Market Activity Report” which is a research tool reflecting residential real estate activity within the 77 officially defined Chicago community areas provided by the Chicago Association of Realtors®. It is essential to keep in mind that real estate markets can vary across neighborhoods and property types within a city. In conclusion, economic conditions and external factors can influence market trends. Staying updated on these metrics and trends is crucial for making informed decisions.