Facebook
 X
X
 Pinterest
 Copy Link

January 2025 | Week 8
Chicago Real Estate Market Metrics. While there are many metrics to talk about in the world of real estate, today we are going to look at four: speed, demand, supply and negotiations. Let’s get started! Follow along for weekly updates on all things Chicago Real Estate by clicking here.
Summary | TLDR
New Listings continue to fall behind. Leading to inventory storages. Currently in the United States it is the tale of two cities when it comes to the conversation of housing inventory. Looking at the national averages or median stats may lead one to believe that the market is healing. While yes, national. Upon further inspection. One will find it depends on the local market area. Chicago. LA. New York. Dallas. Miami. Houston. Seattle. All these different Real Estate Markets. The major difference is primary residence, secondary residence and the strength of the job market. Could talk futher. But I’ll end here. This is meant to be a general summary afterall.
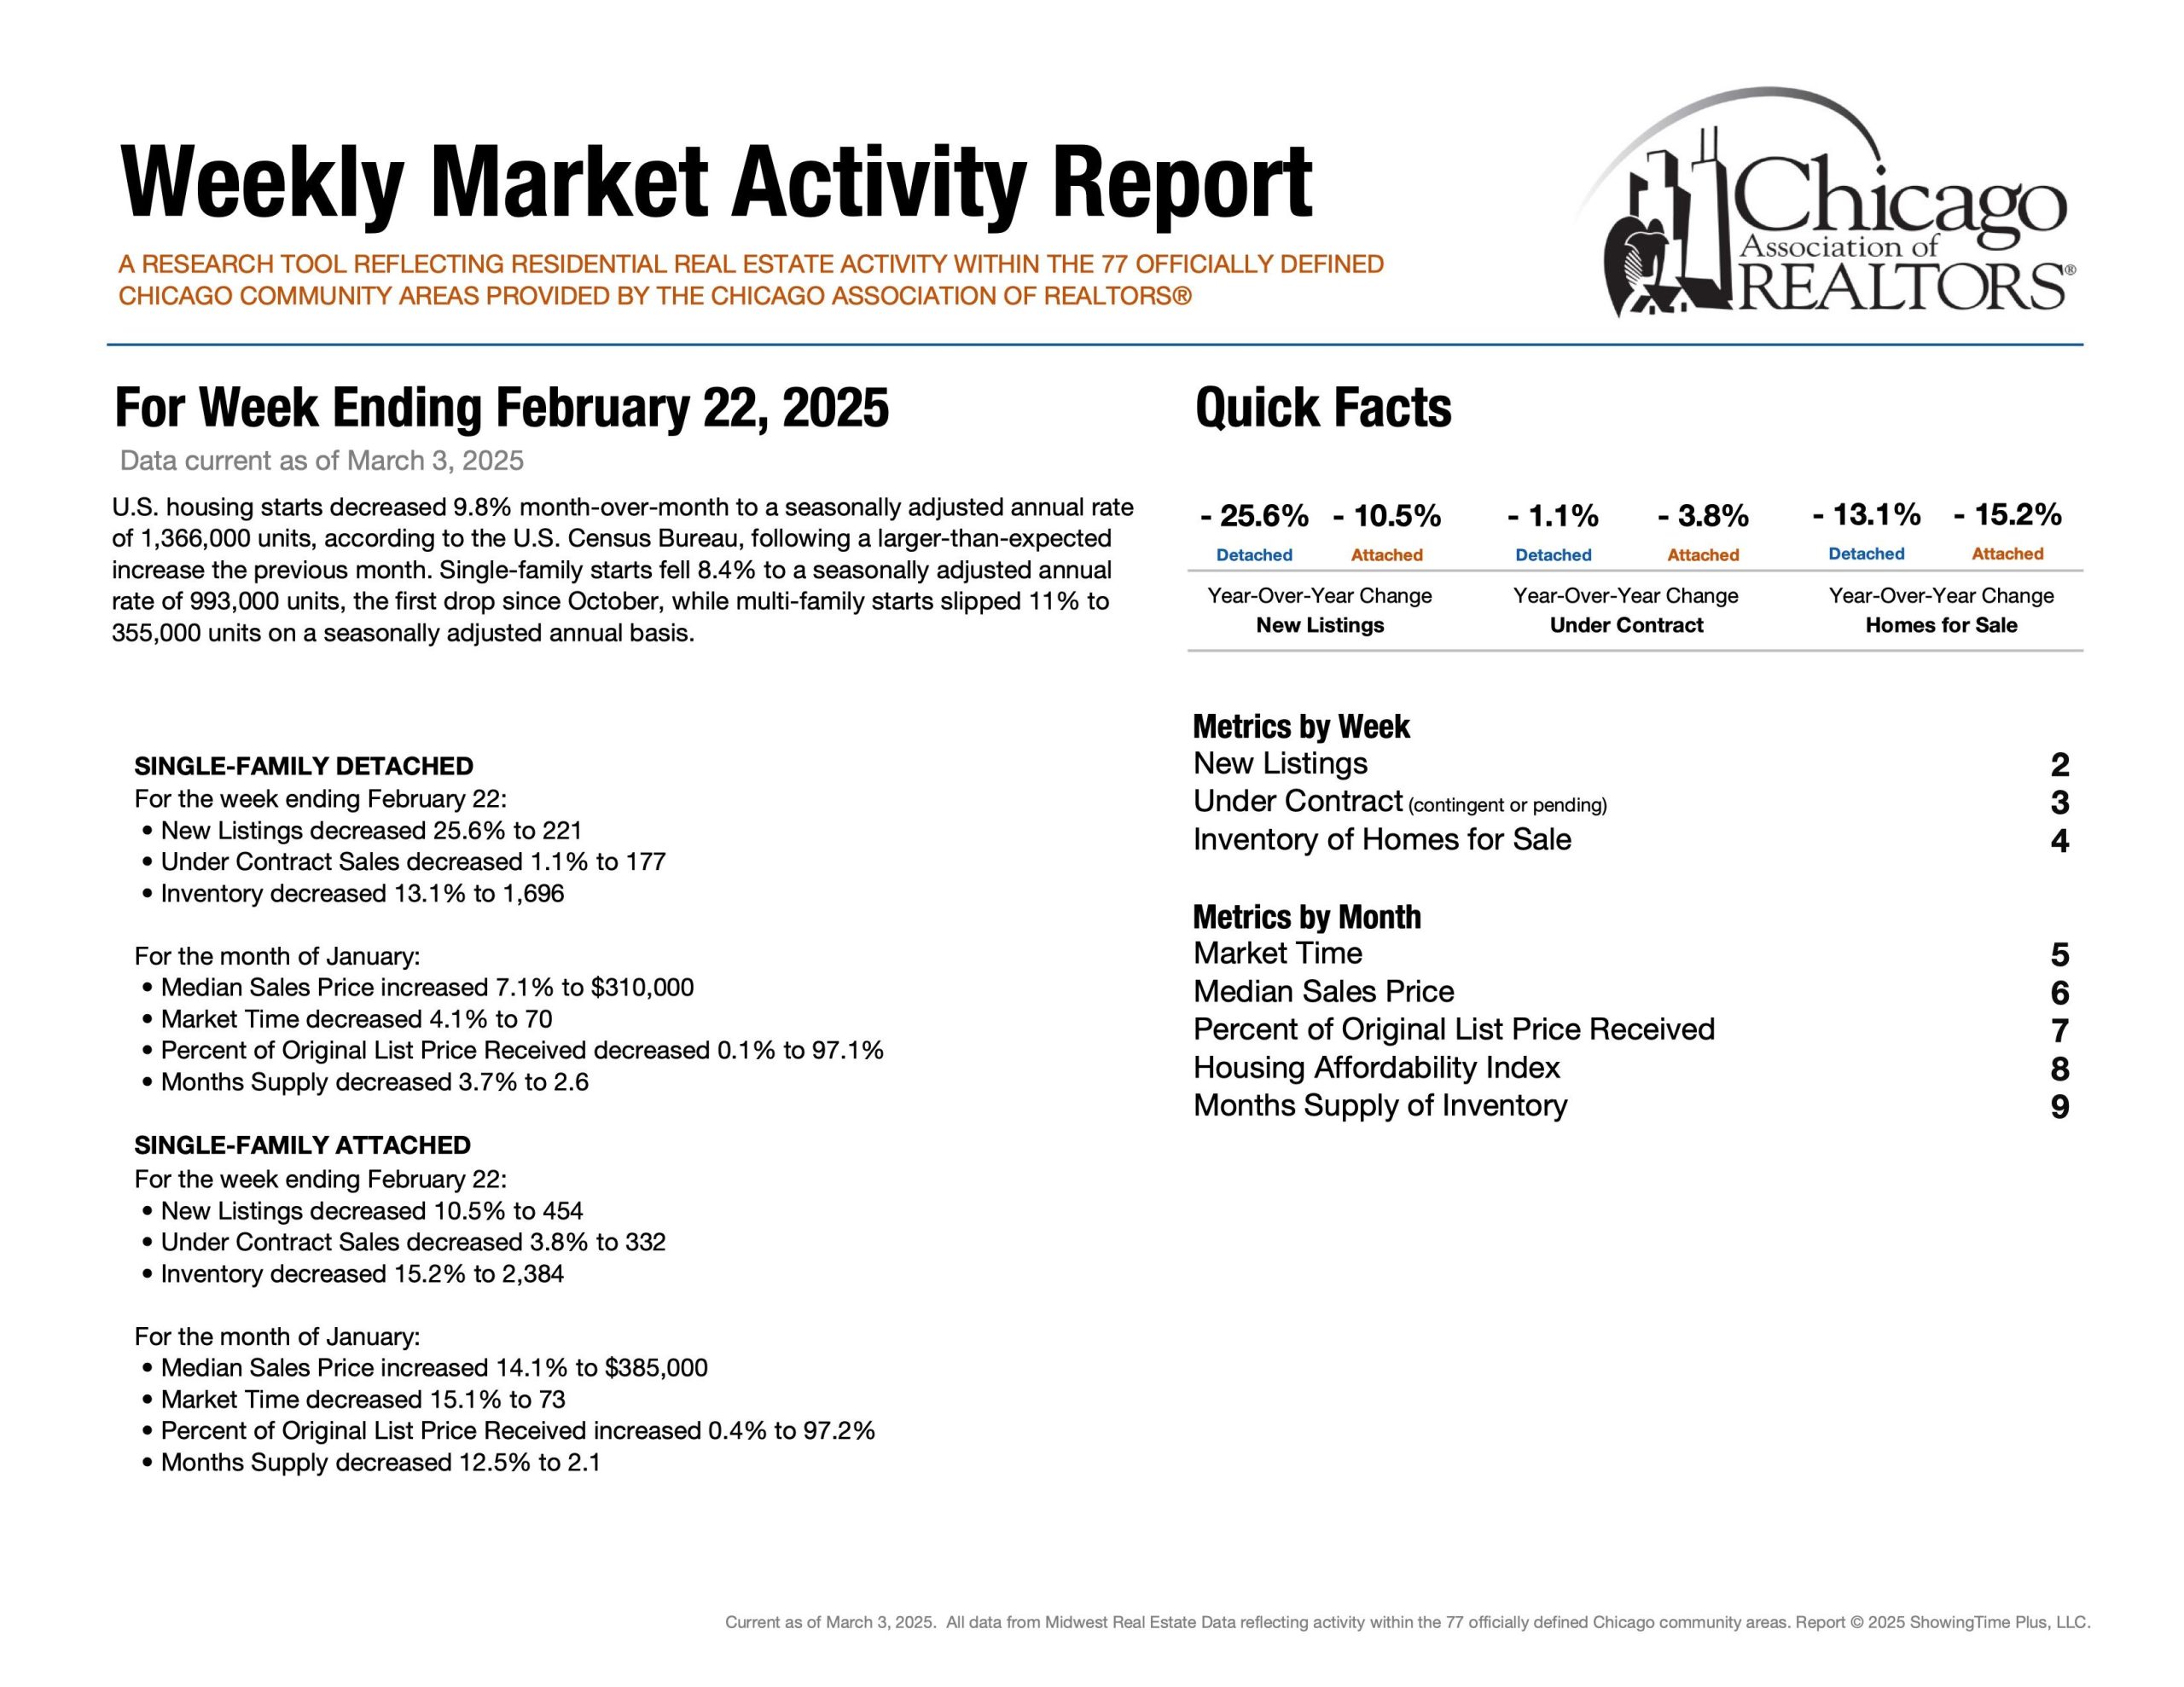
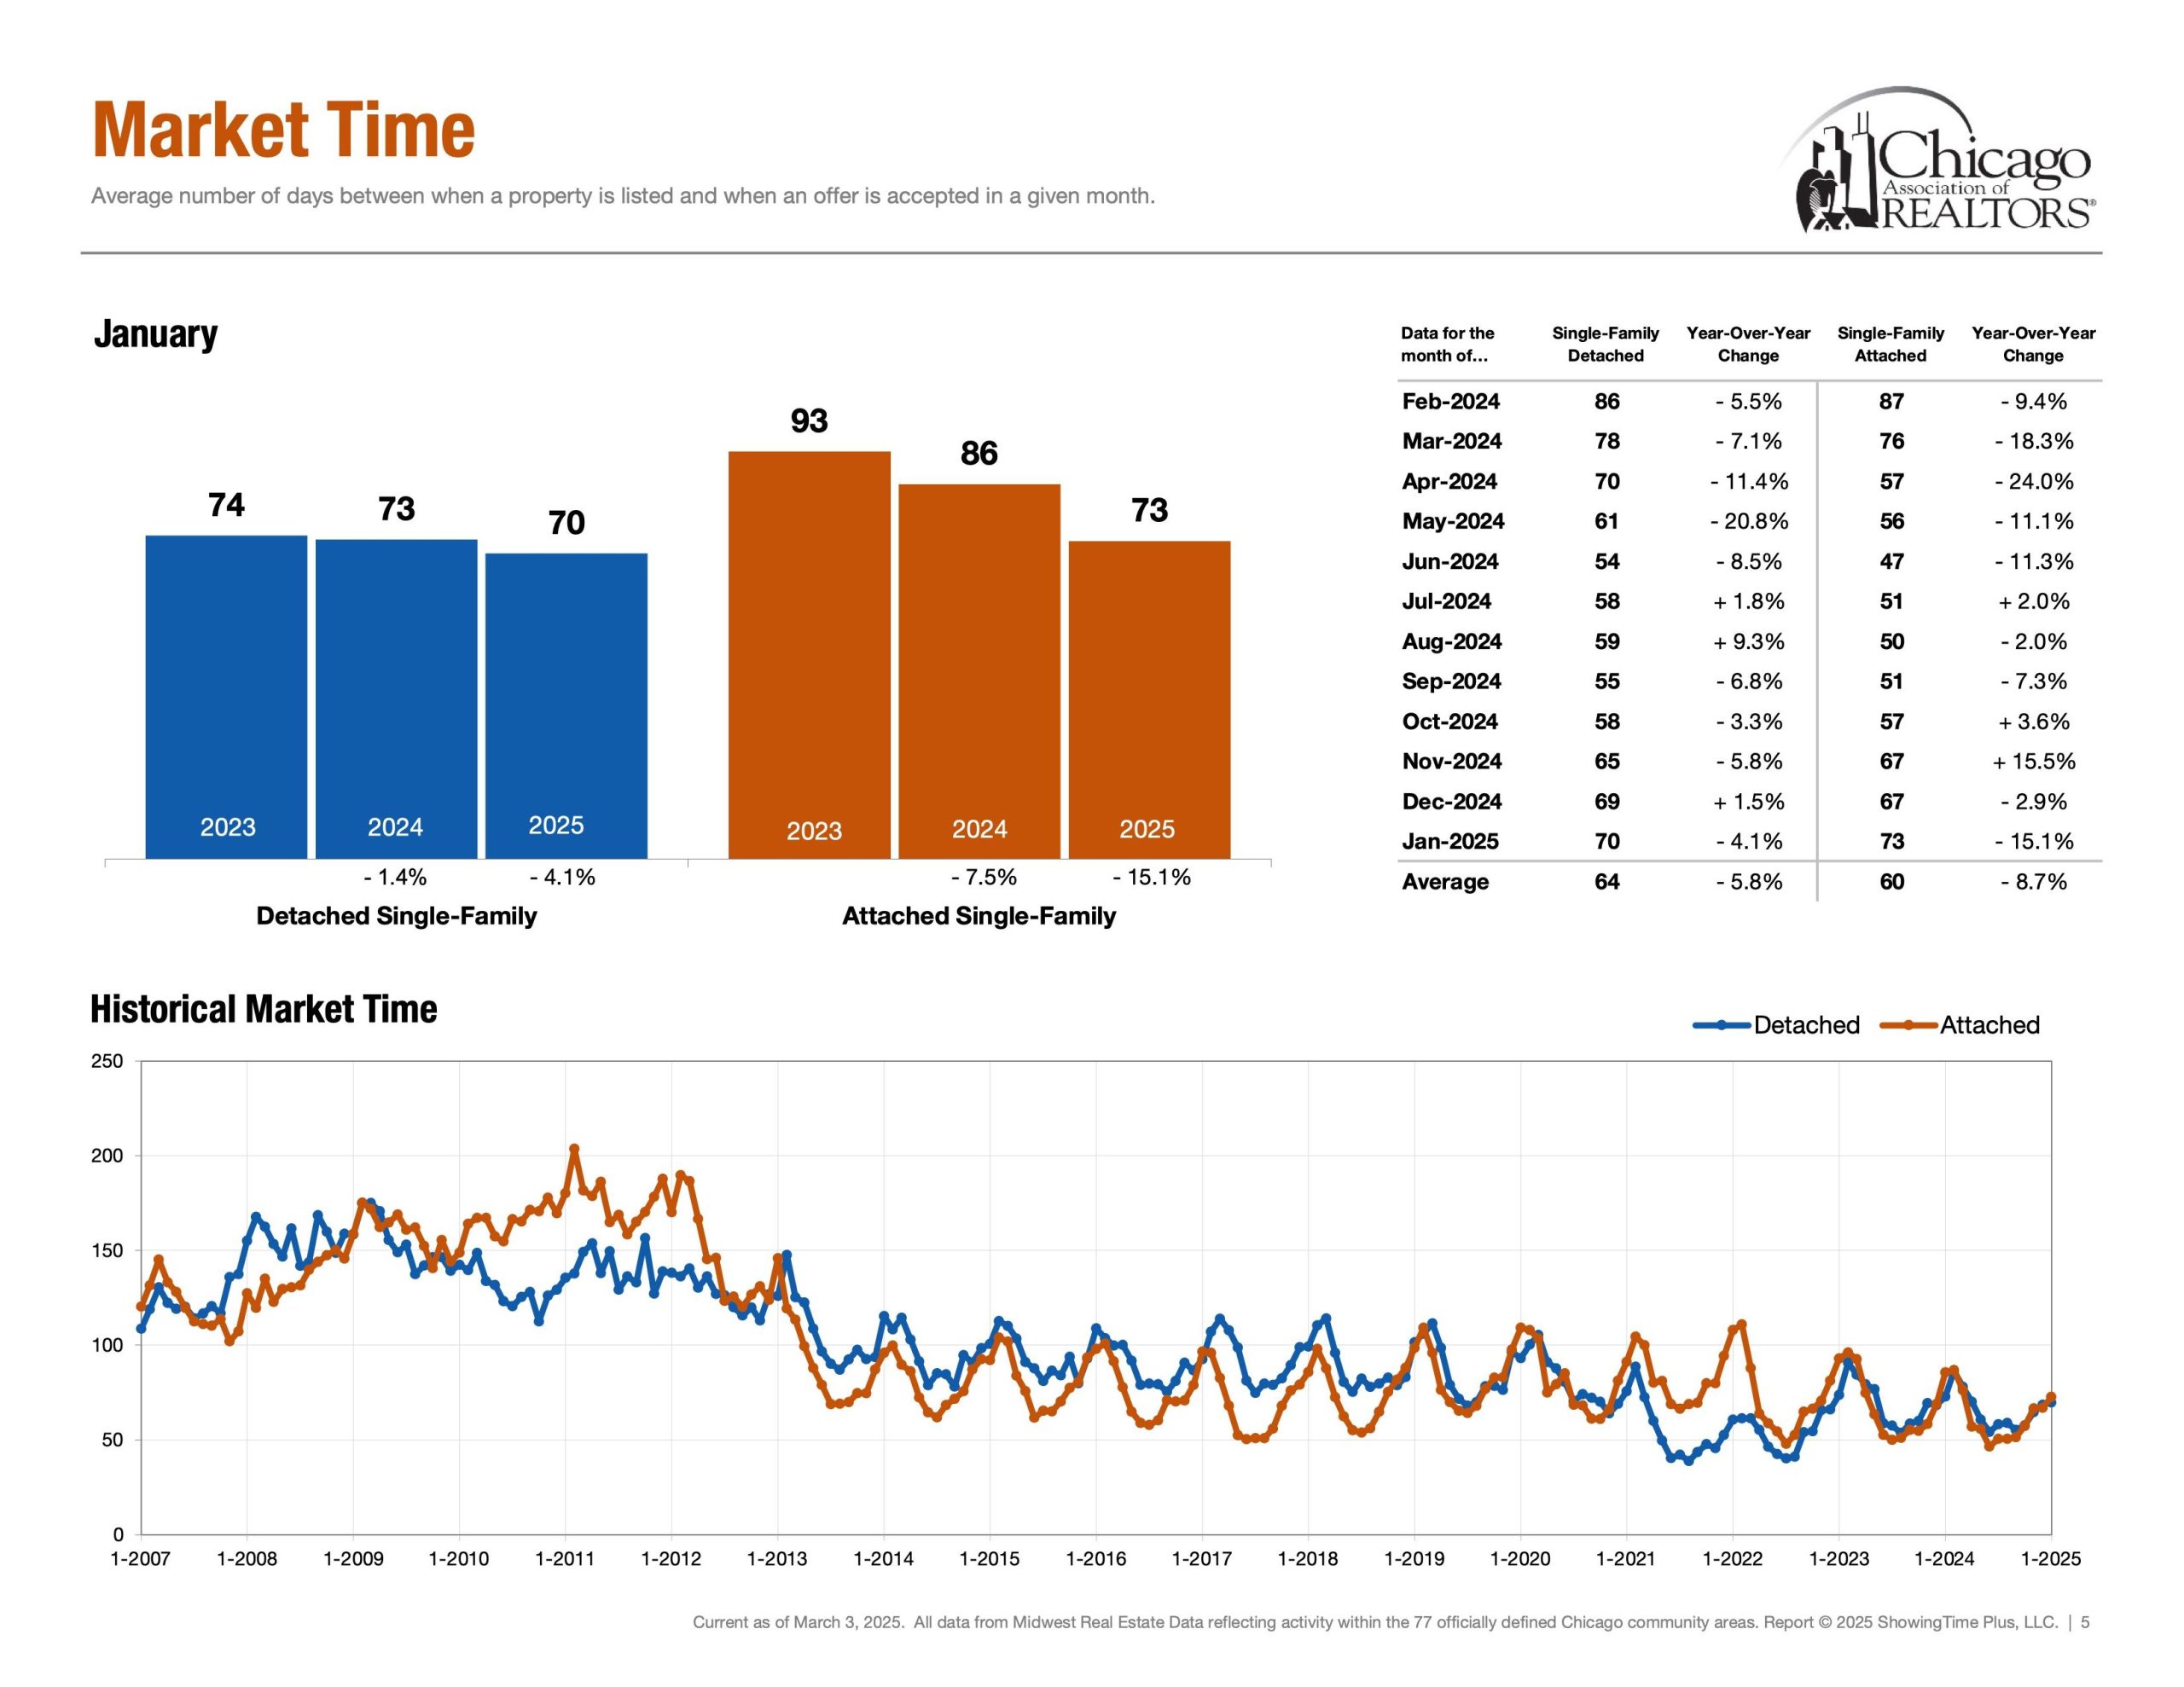
Speed | Healthy Market Time Range
Detached Single ~ 70 Days (Jan 25′)
Attached Single ~ 73 Days (Jan 25′)
First, market time is metric that showcases speed and whether a listing was priced too low, priced properly or priced too high. If a listing surpasses average days on market, it is a check engine light that your listing maybe overpriced.
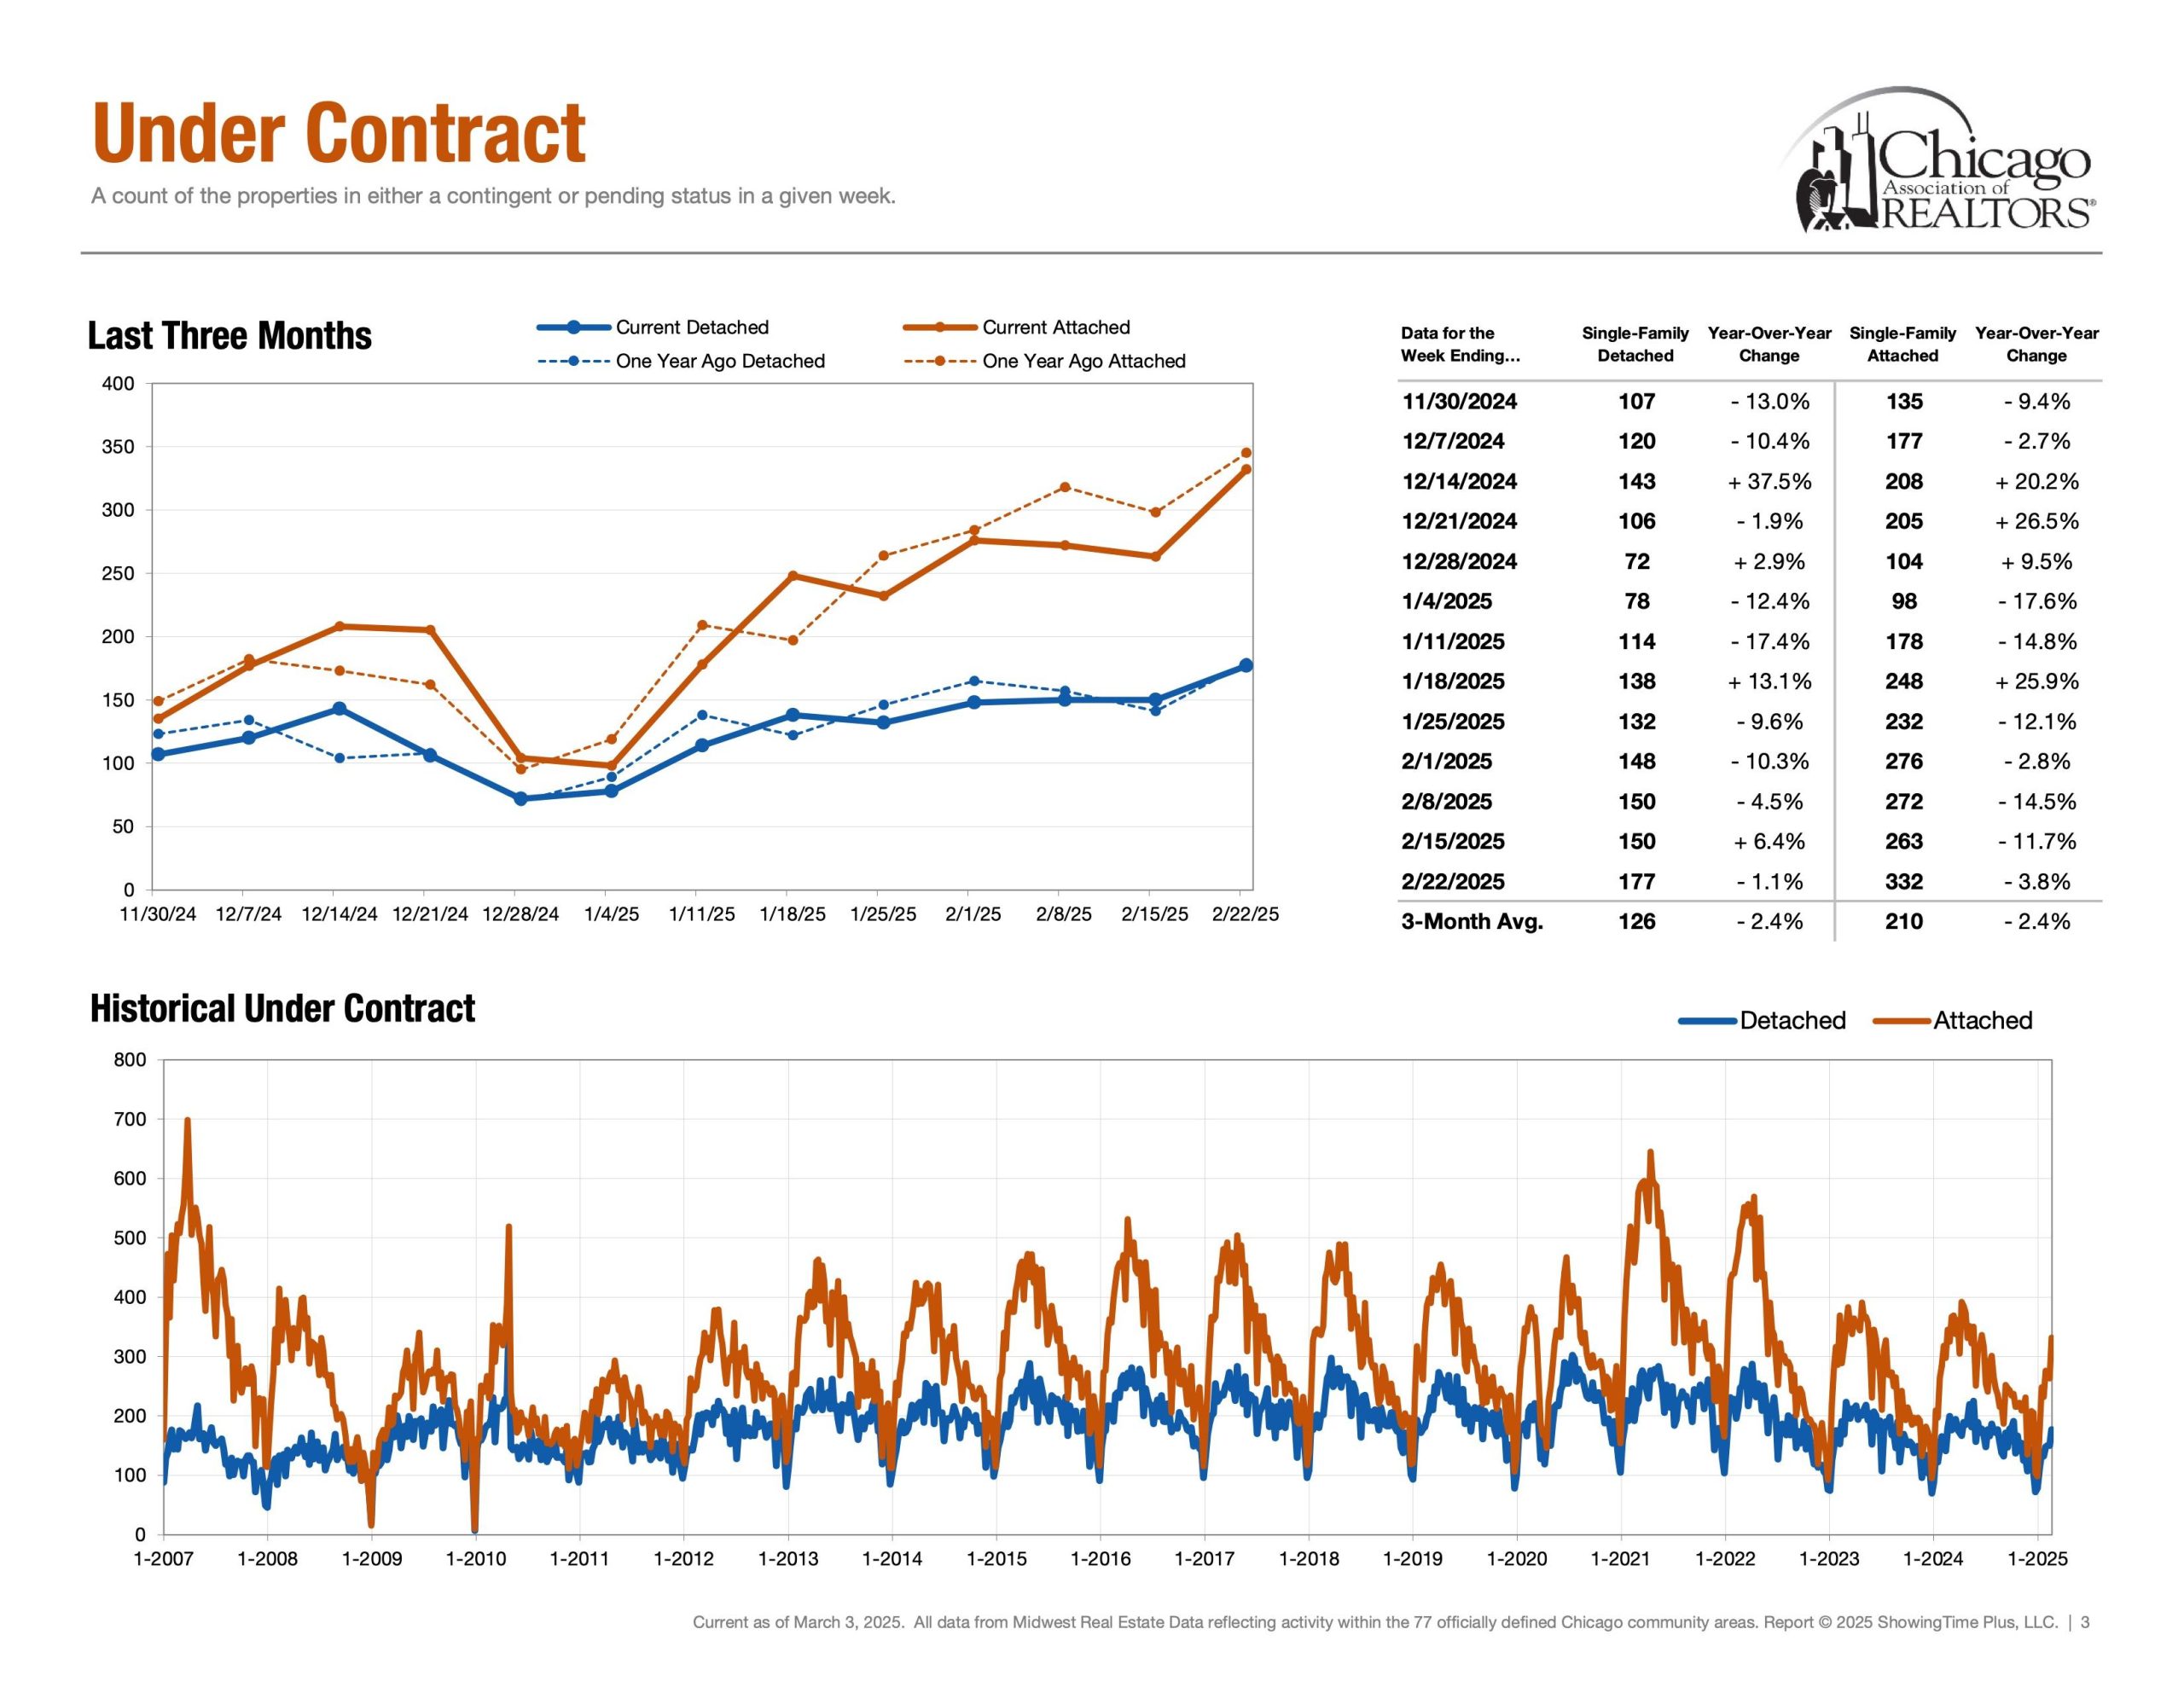
Demand | Under Contract
Detached Single = 177 Properties (Feb 16th – Feb 22nd)
Attached Single = 332 Properties (Feb 16th – Feb 22nd)
Secondly, under contract helps answer the question, “In our current market, how many buyers are buying?” Showcasing the heartbeat of the real estate market. Interestingly, demand metrics become more insightful when compared and contrasted with supply/inventory metrics.
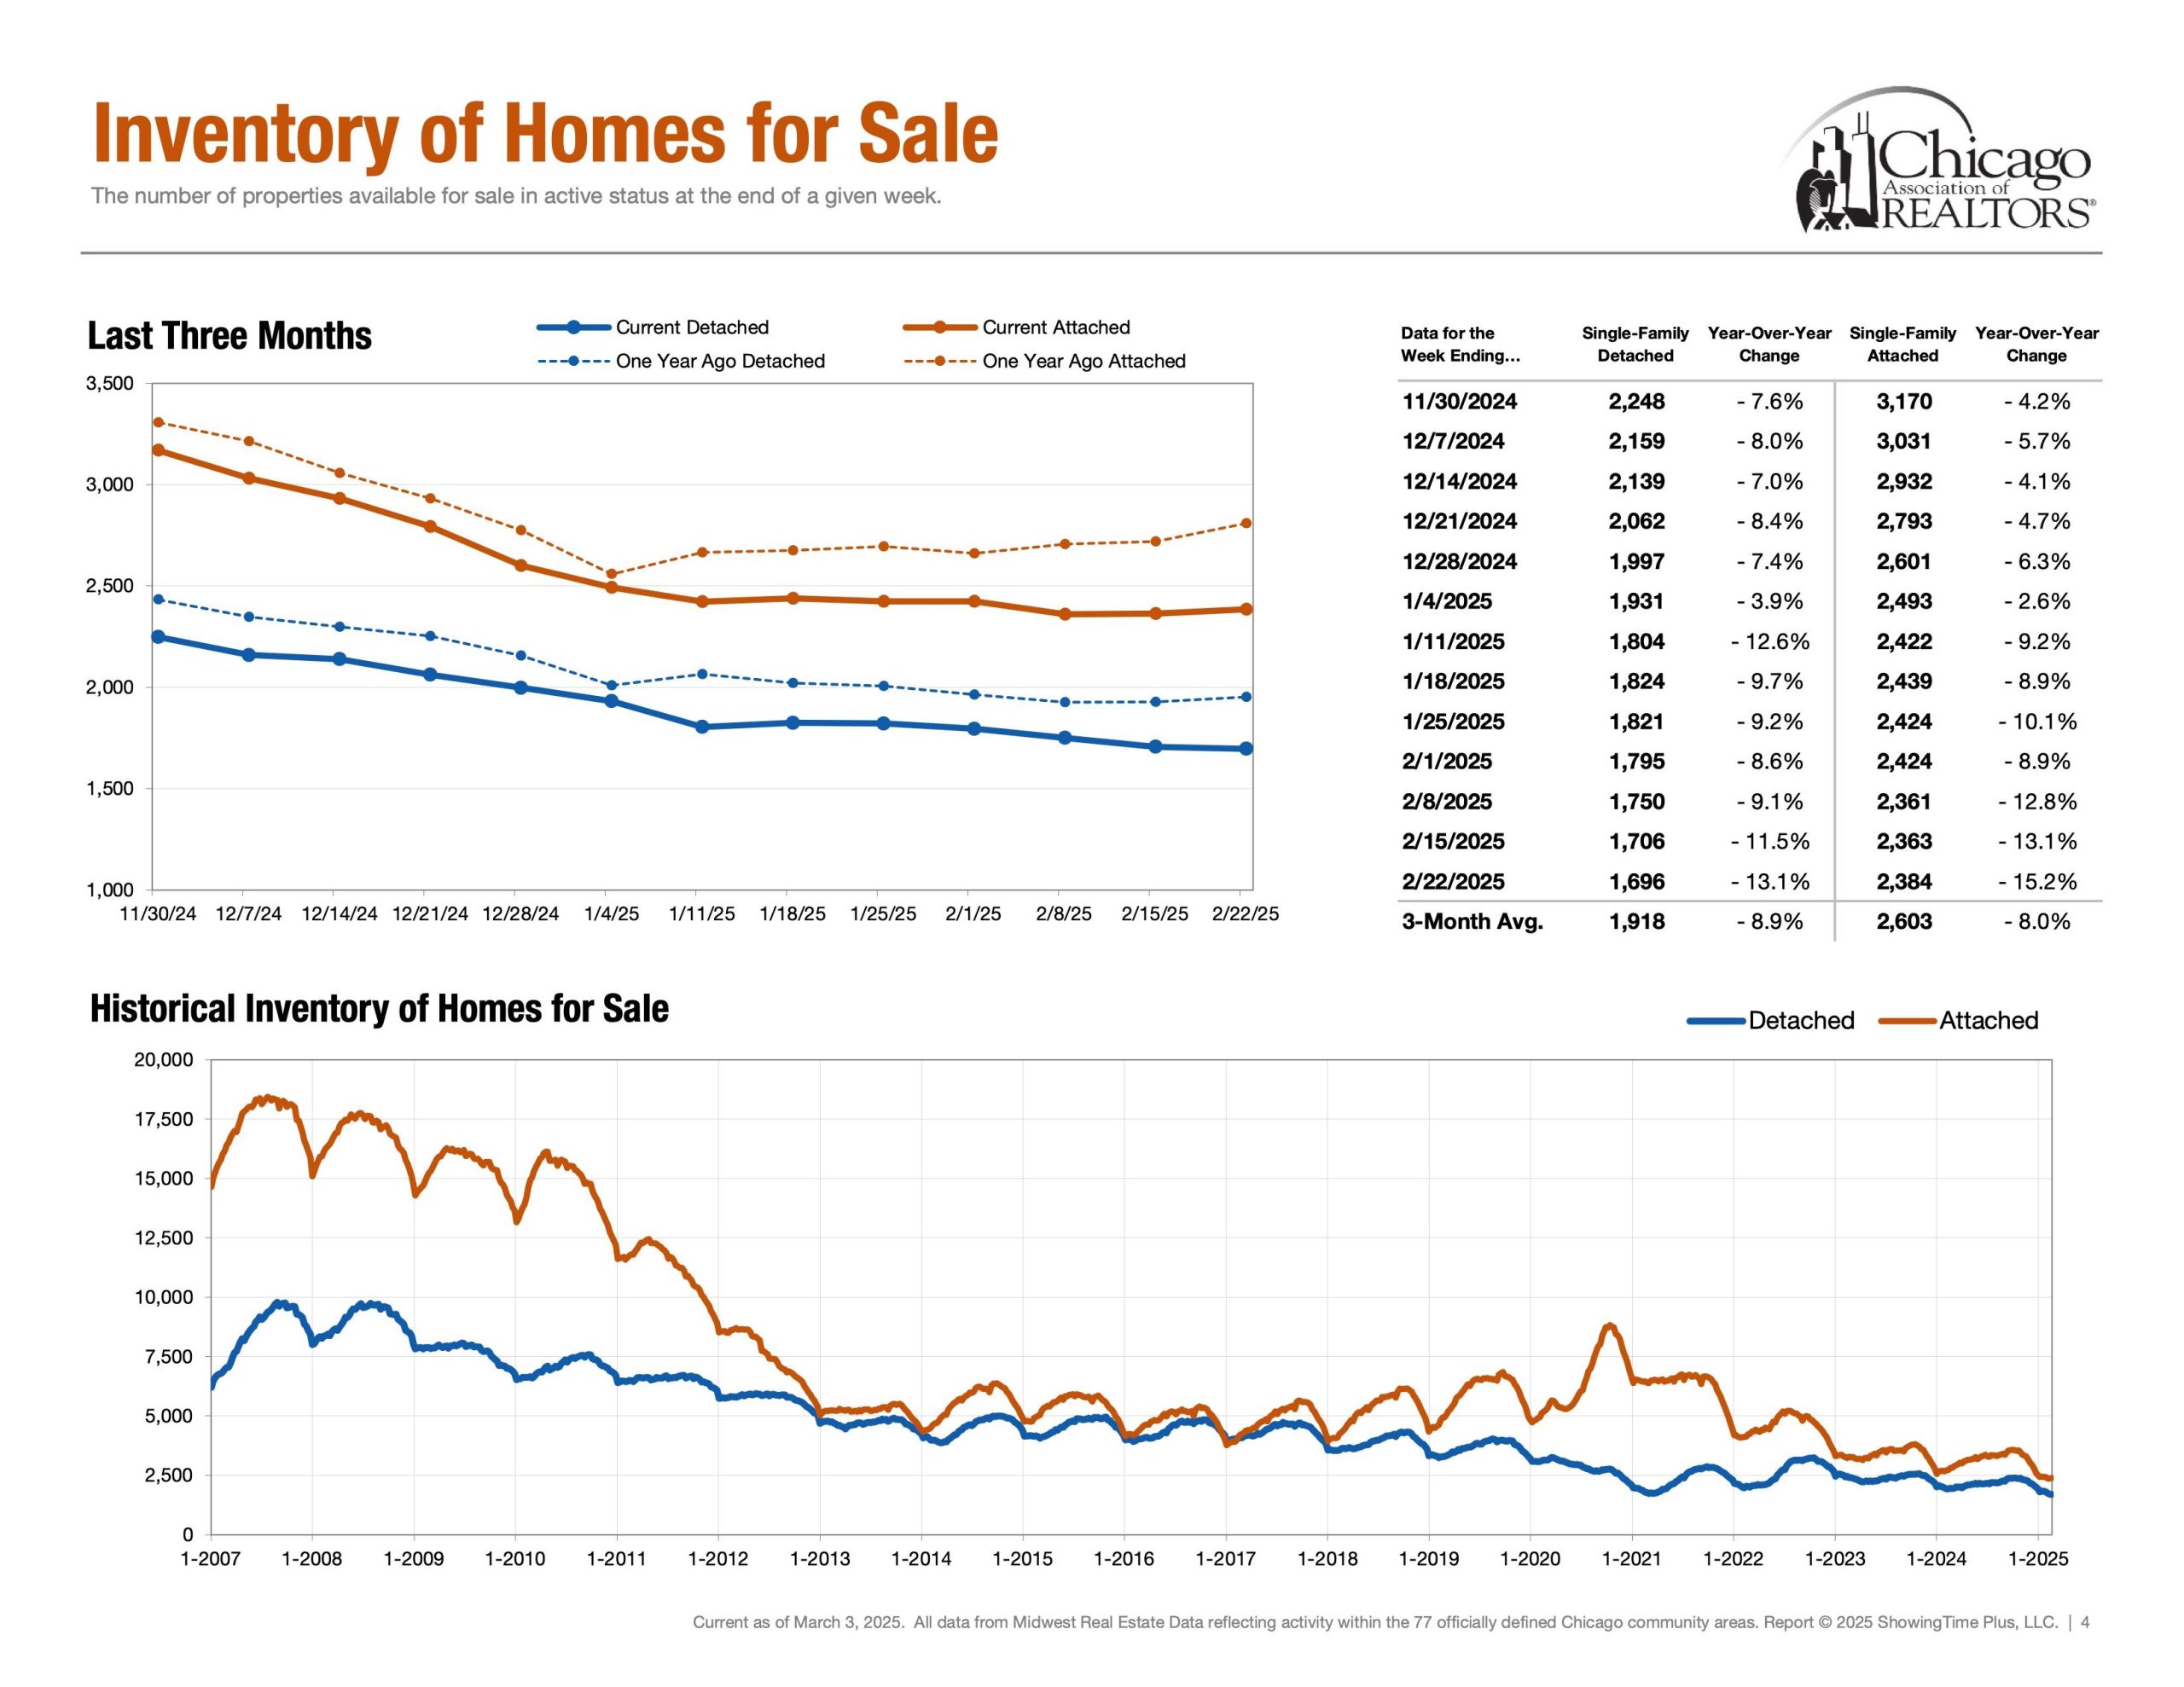
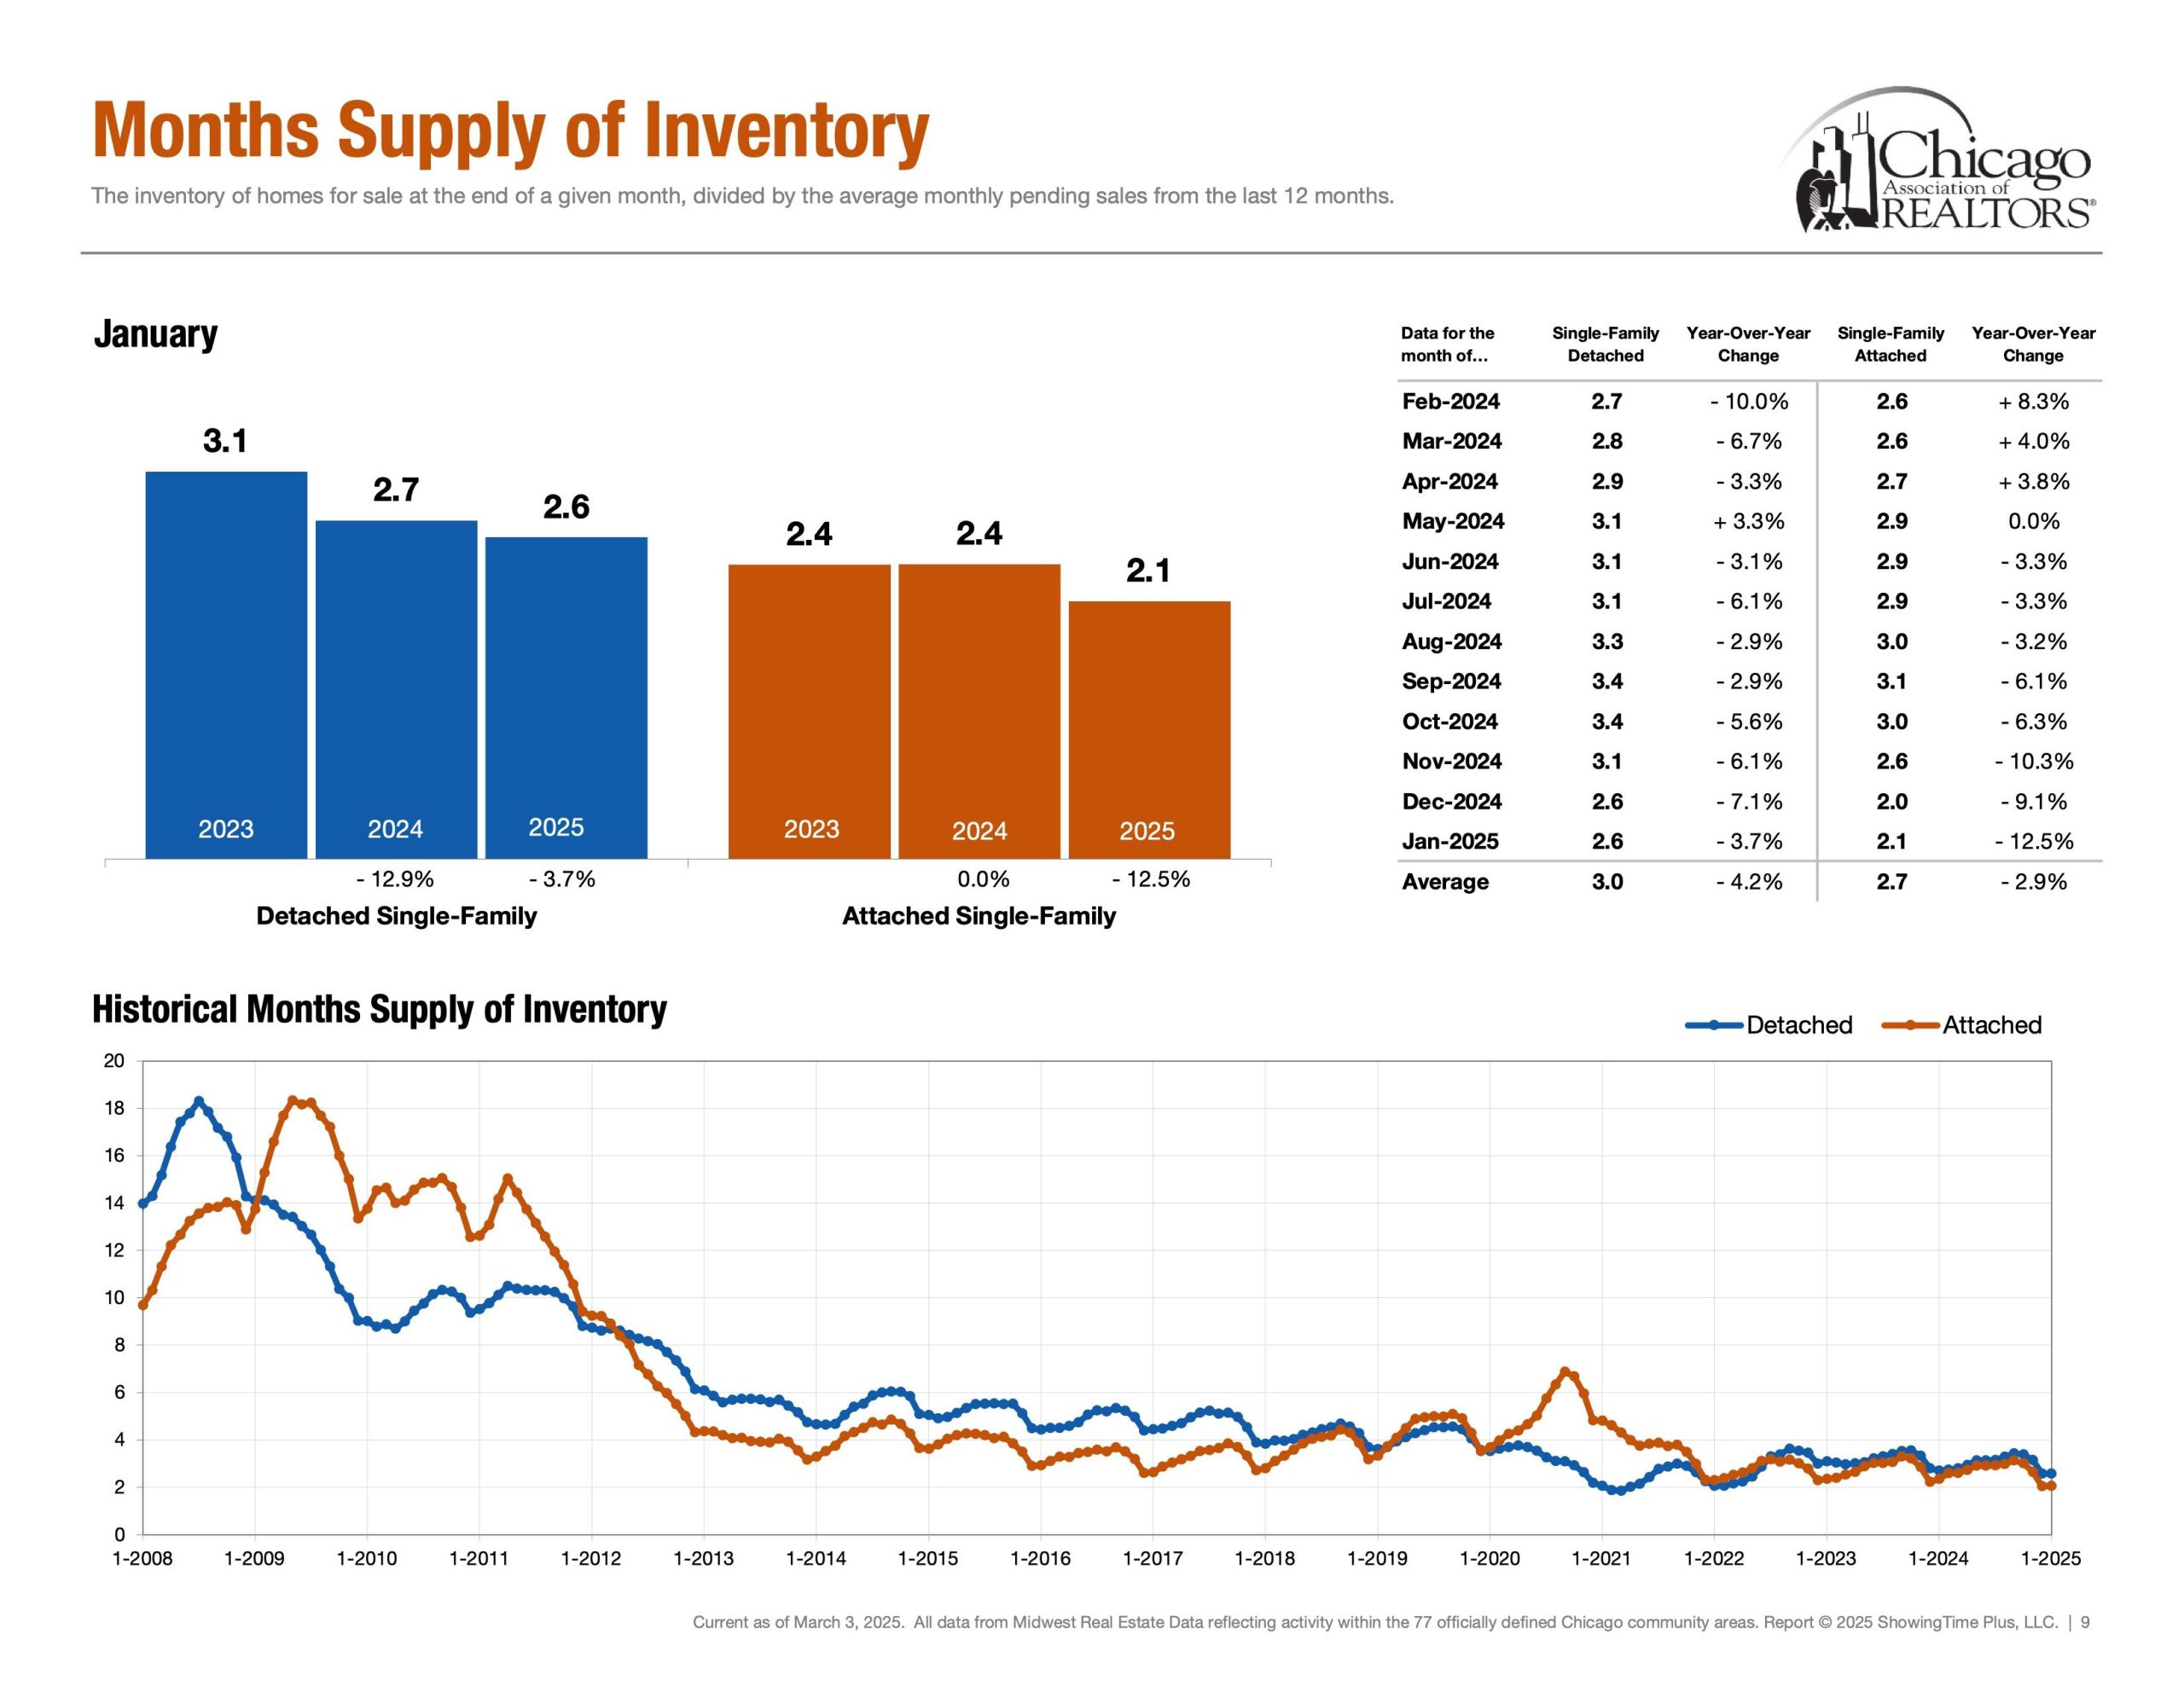
Supply | Inventory of Homes for Sale
Detached Single = 1,696 Properties (Feb 16th – Feb 22nd)
Attached Single = 2,384 Properties (Feb 16th – Feb 22nd)
Next, probably the metric of the year. Inventory of homes for sale showcases supply and answers the question, “How much inventory is available for buyers and how much competition sellers are up against?” Additionally, Months of Inventory, Homes for Sale, New Listings and Absorption Rate are also other key metrics in the conversation of supply.
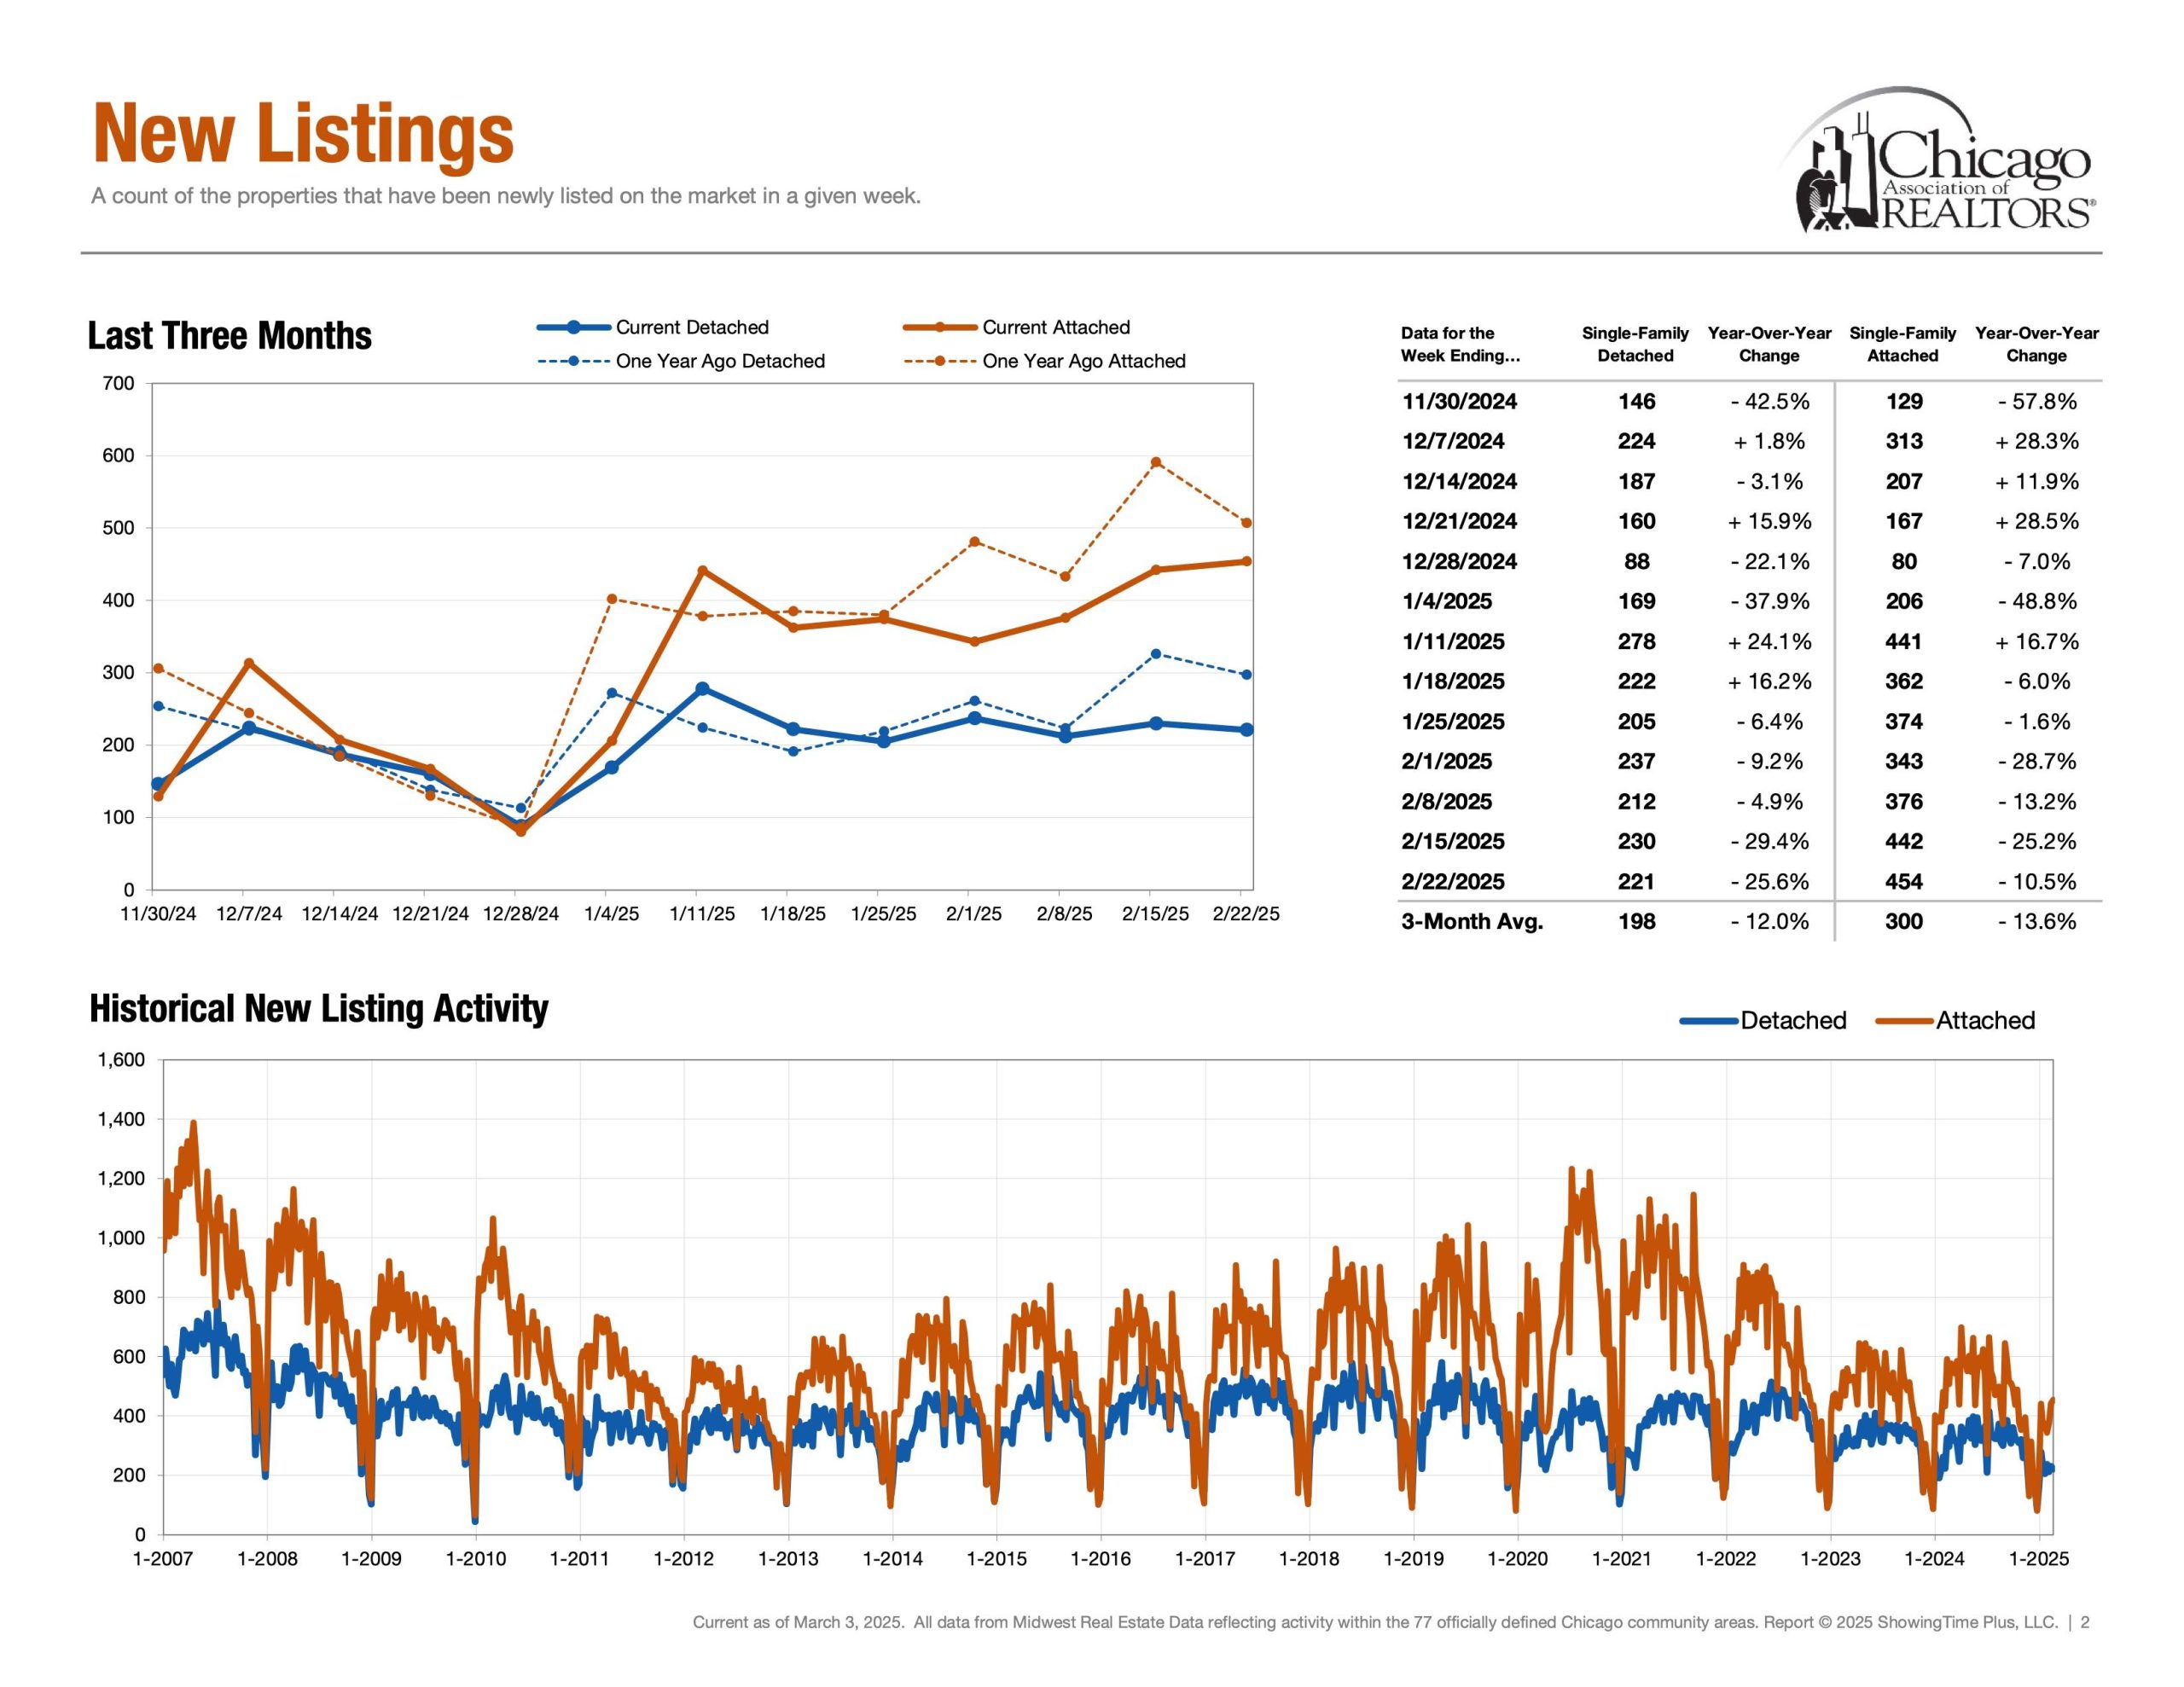
Supply | New Listings
Detached Single = 221 Properties (Feb 16th – Feb 22nd)
Attached Single = 454 Properties (Feb 16th – Feb 22nd)
New Listings is a foreshadowing metric and helps visualize when inventory enters the market.
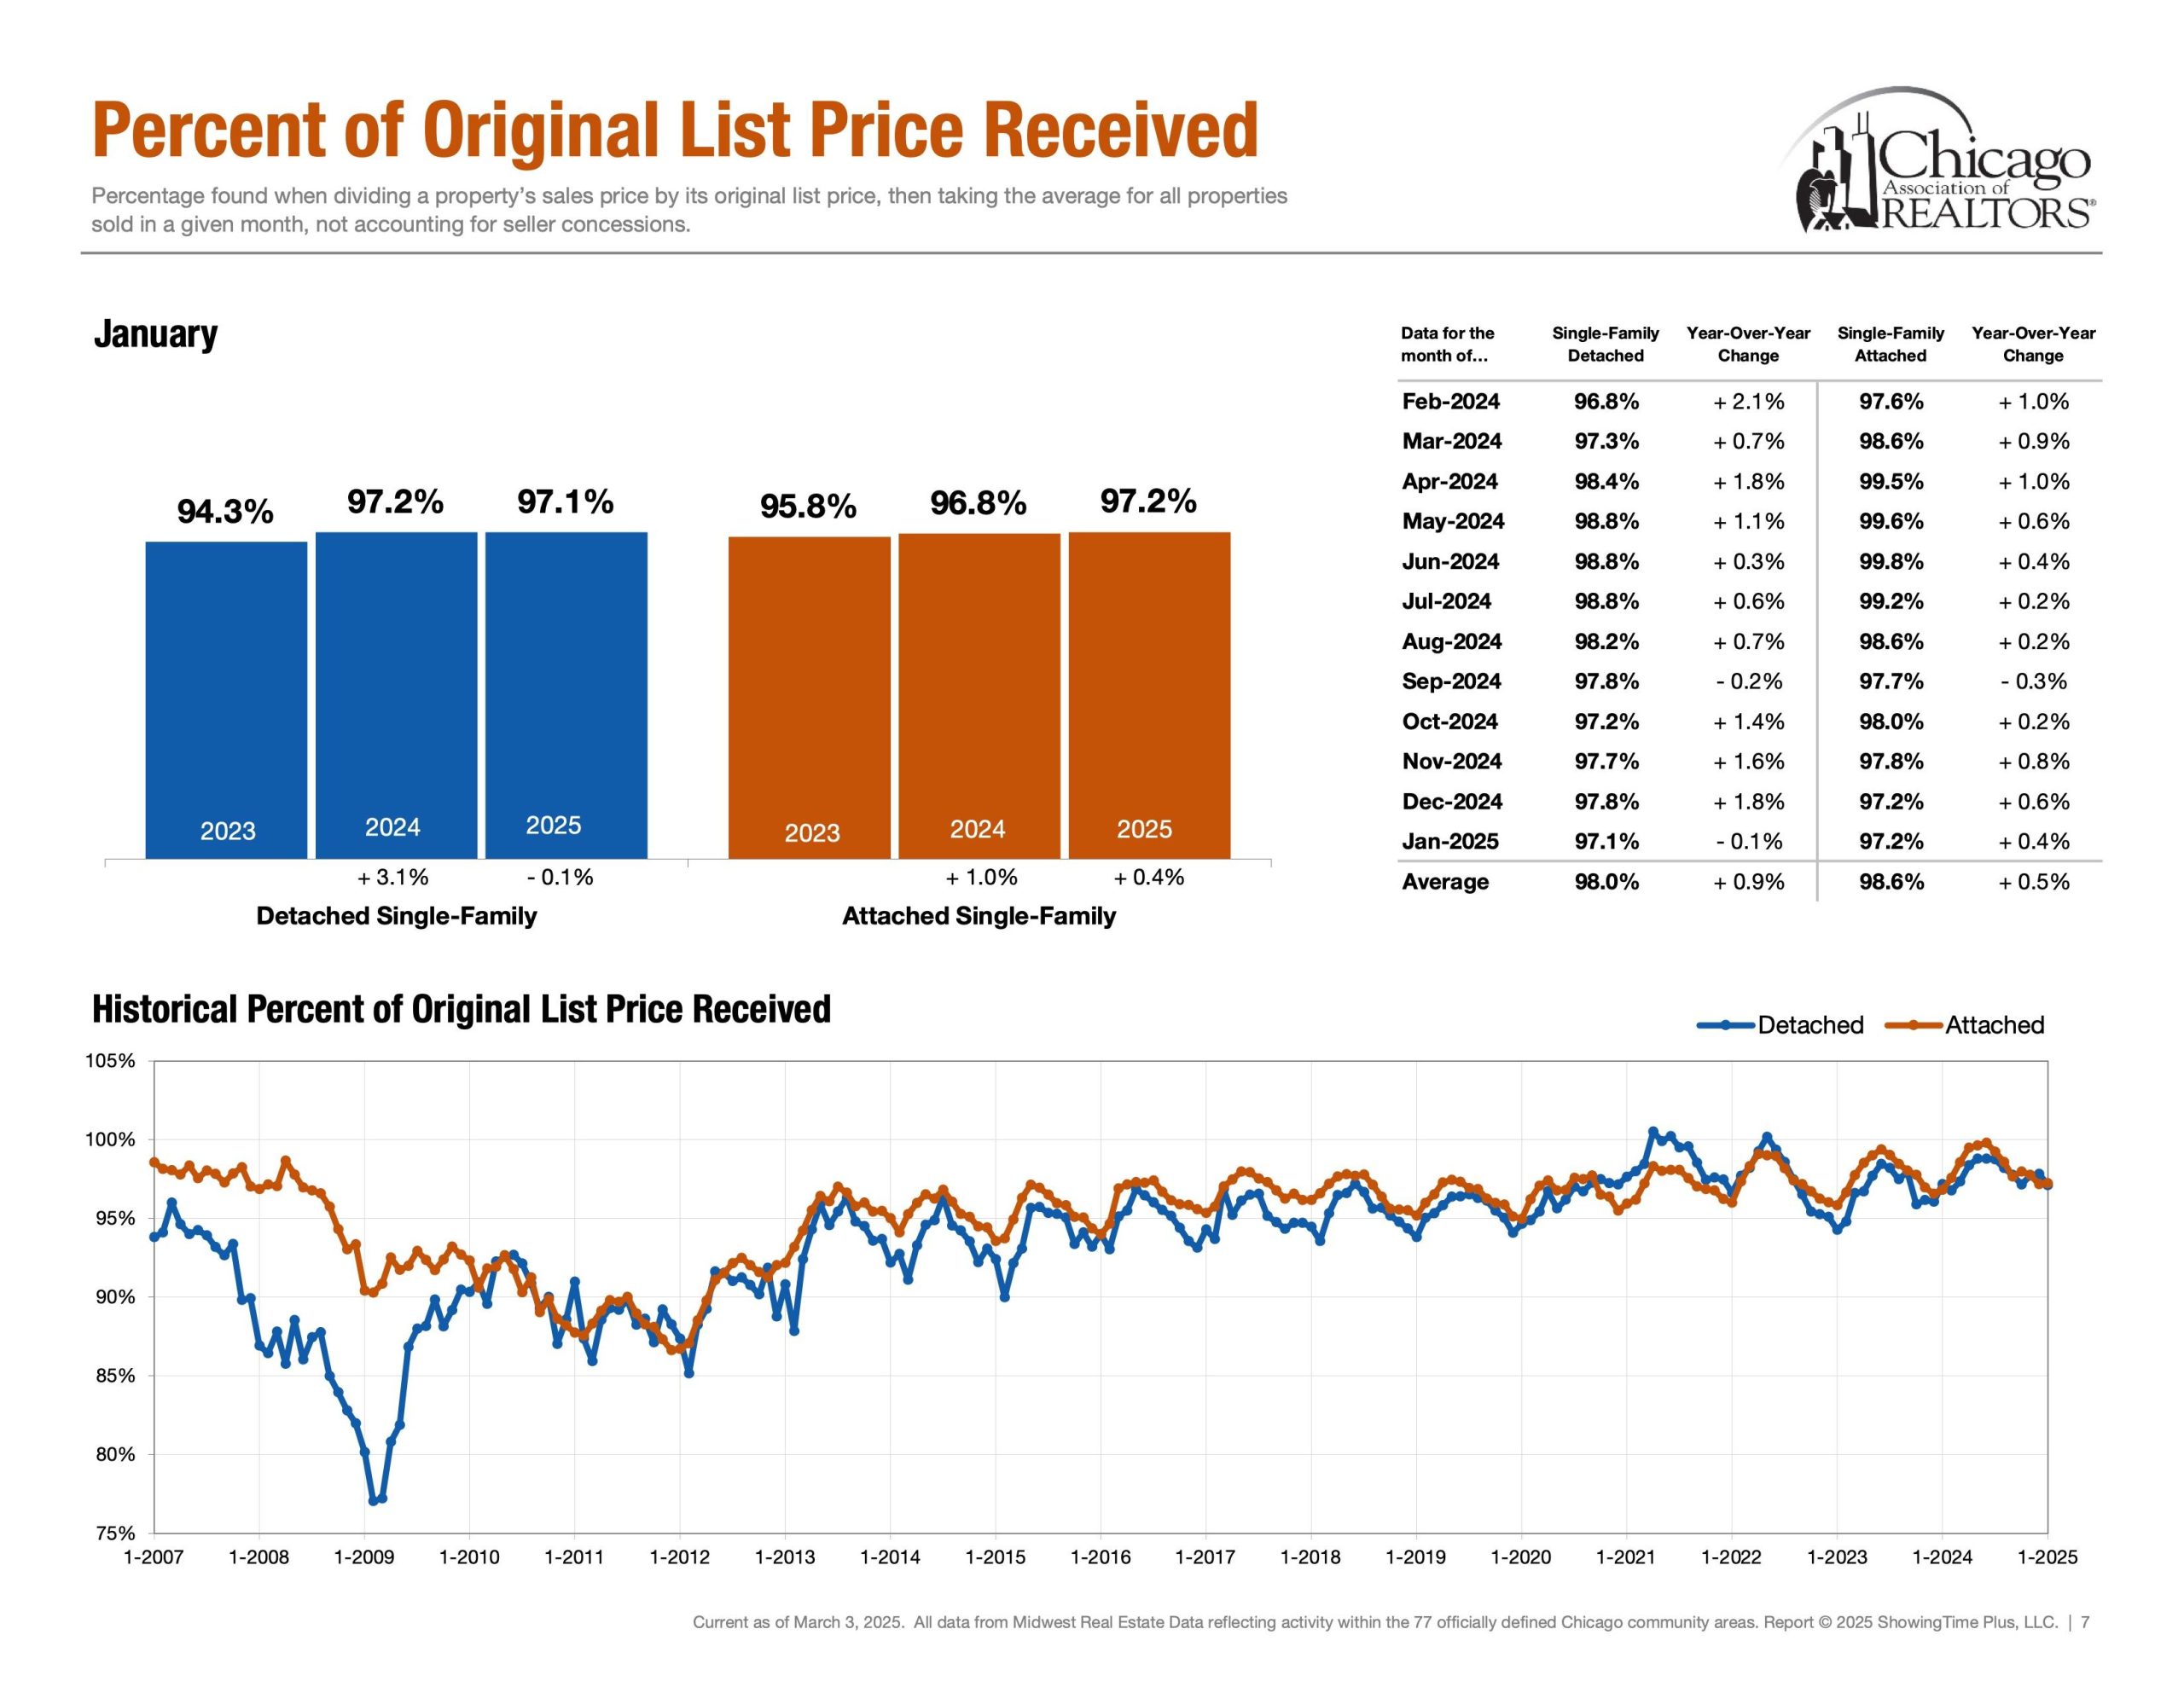
Negotiations | Percentage of Original List Price Received
Detached Single ~ 98% (Rolling 12 Months Avg) & ~ 97.1% (Jan 25′)
Attached Single ~ 98.6% (Rolling 12 Months Avg) & ~ 97.2% (Jan 25′)
Lastly, Percentage of Original List Price Received to Closed Price is a metric that showcases what the average accepted purchase price is relative to the list price. How much below asking price can an offer go while still getting accepted? How much would one have to offer above ask in order to be an above average purchase price?
The End | Have A Great Day!
Please note all of these metrics are along a spectrum as opposed to a specific number. Below is “The Weekly Market Activity Report” which is a research tool reflecting residential real estate activity within the 77 officially defined Chicago community areas provided by the Chicago Association of Realtors®. It is essential to keep in mind that real estate markets can vary across neighborhoods and property types within a city. In conclusion, economic conditions and external factors can influence market trends. Staying updated on these metrics and trends is crucial for making informed decisions.