Facebook
 X
X
 Pinterest
 Copy Link

January 2025 | Week 9
Chicago Real Estate Market Metrics. While there are many metrics to talk about in the world of real estate, today we are going to look at four: speed, demand, supply and negotiations. Let’s get started! Follow along for weekly updates on all things Chicago Real Estate by clicking here.
Summary | TLDR
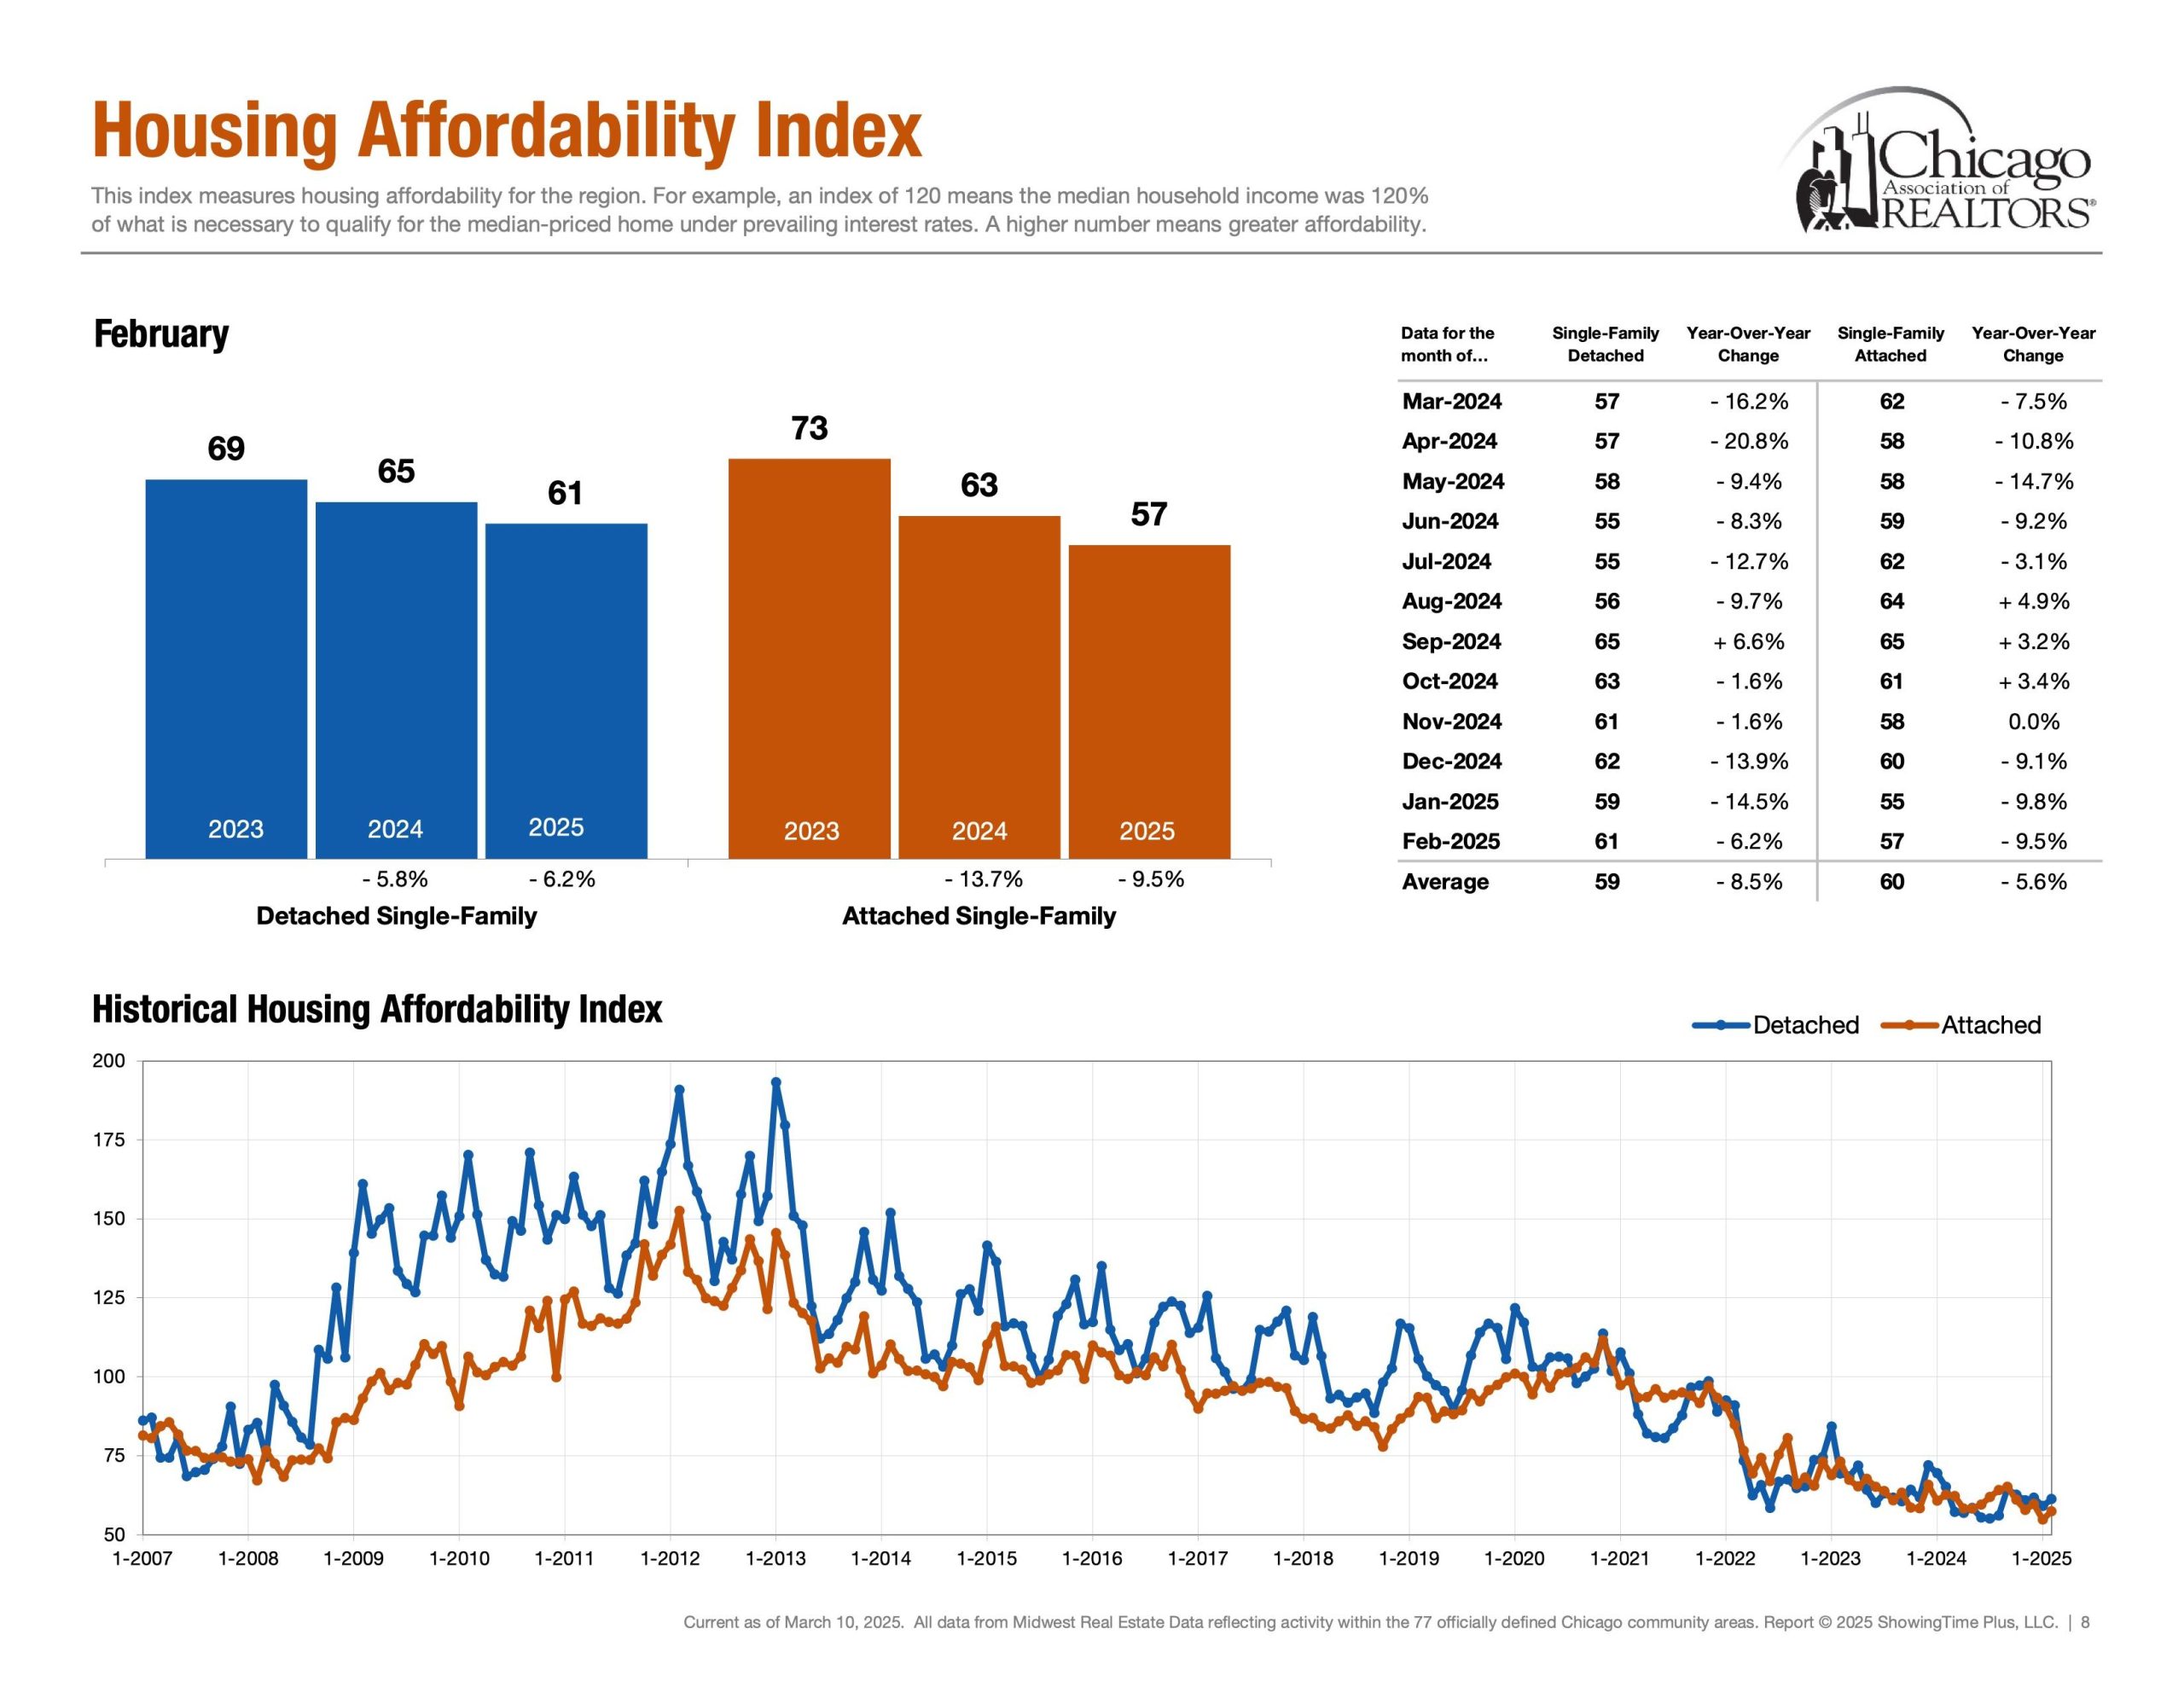
Demand increases while new inventory wanes. Chicago offers relative affordability for homebuyers, though renters face different challenges. This affordability anchors the steady demand we are witnessing. Chicago serves as an economic refuge for those relocating from less affordable metro areas.
The cost of goods, affordability, median average income, fair housing, and equal opportunity are all part of the broader conversation about building a society that works economically for everyone. This discussion echoes themes from Plato’s Republic and Thomas More’s Utopia. Depending on your economic vantage point and origin story, this paragraph may resonate differently.
Regardless of where you are, being a good person with a strong work ethic is timeless. Have a great week! Brick by brick, we build a better future.
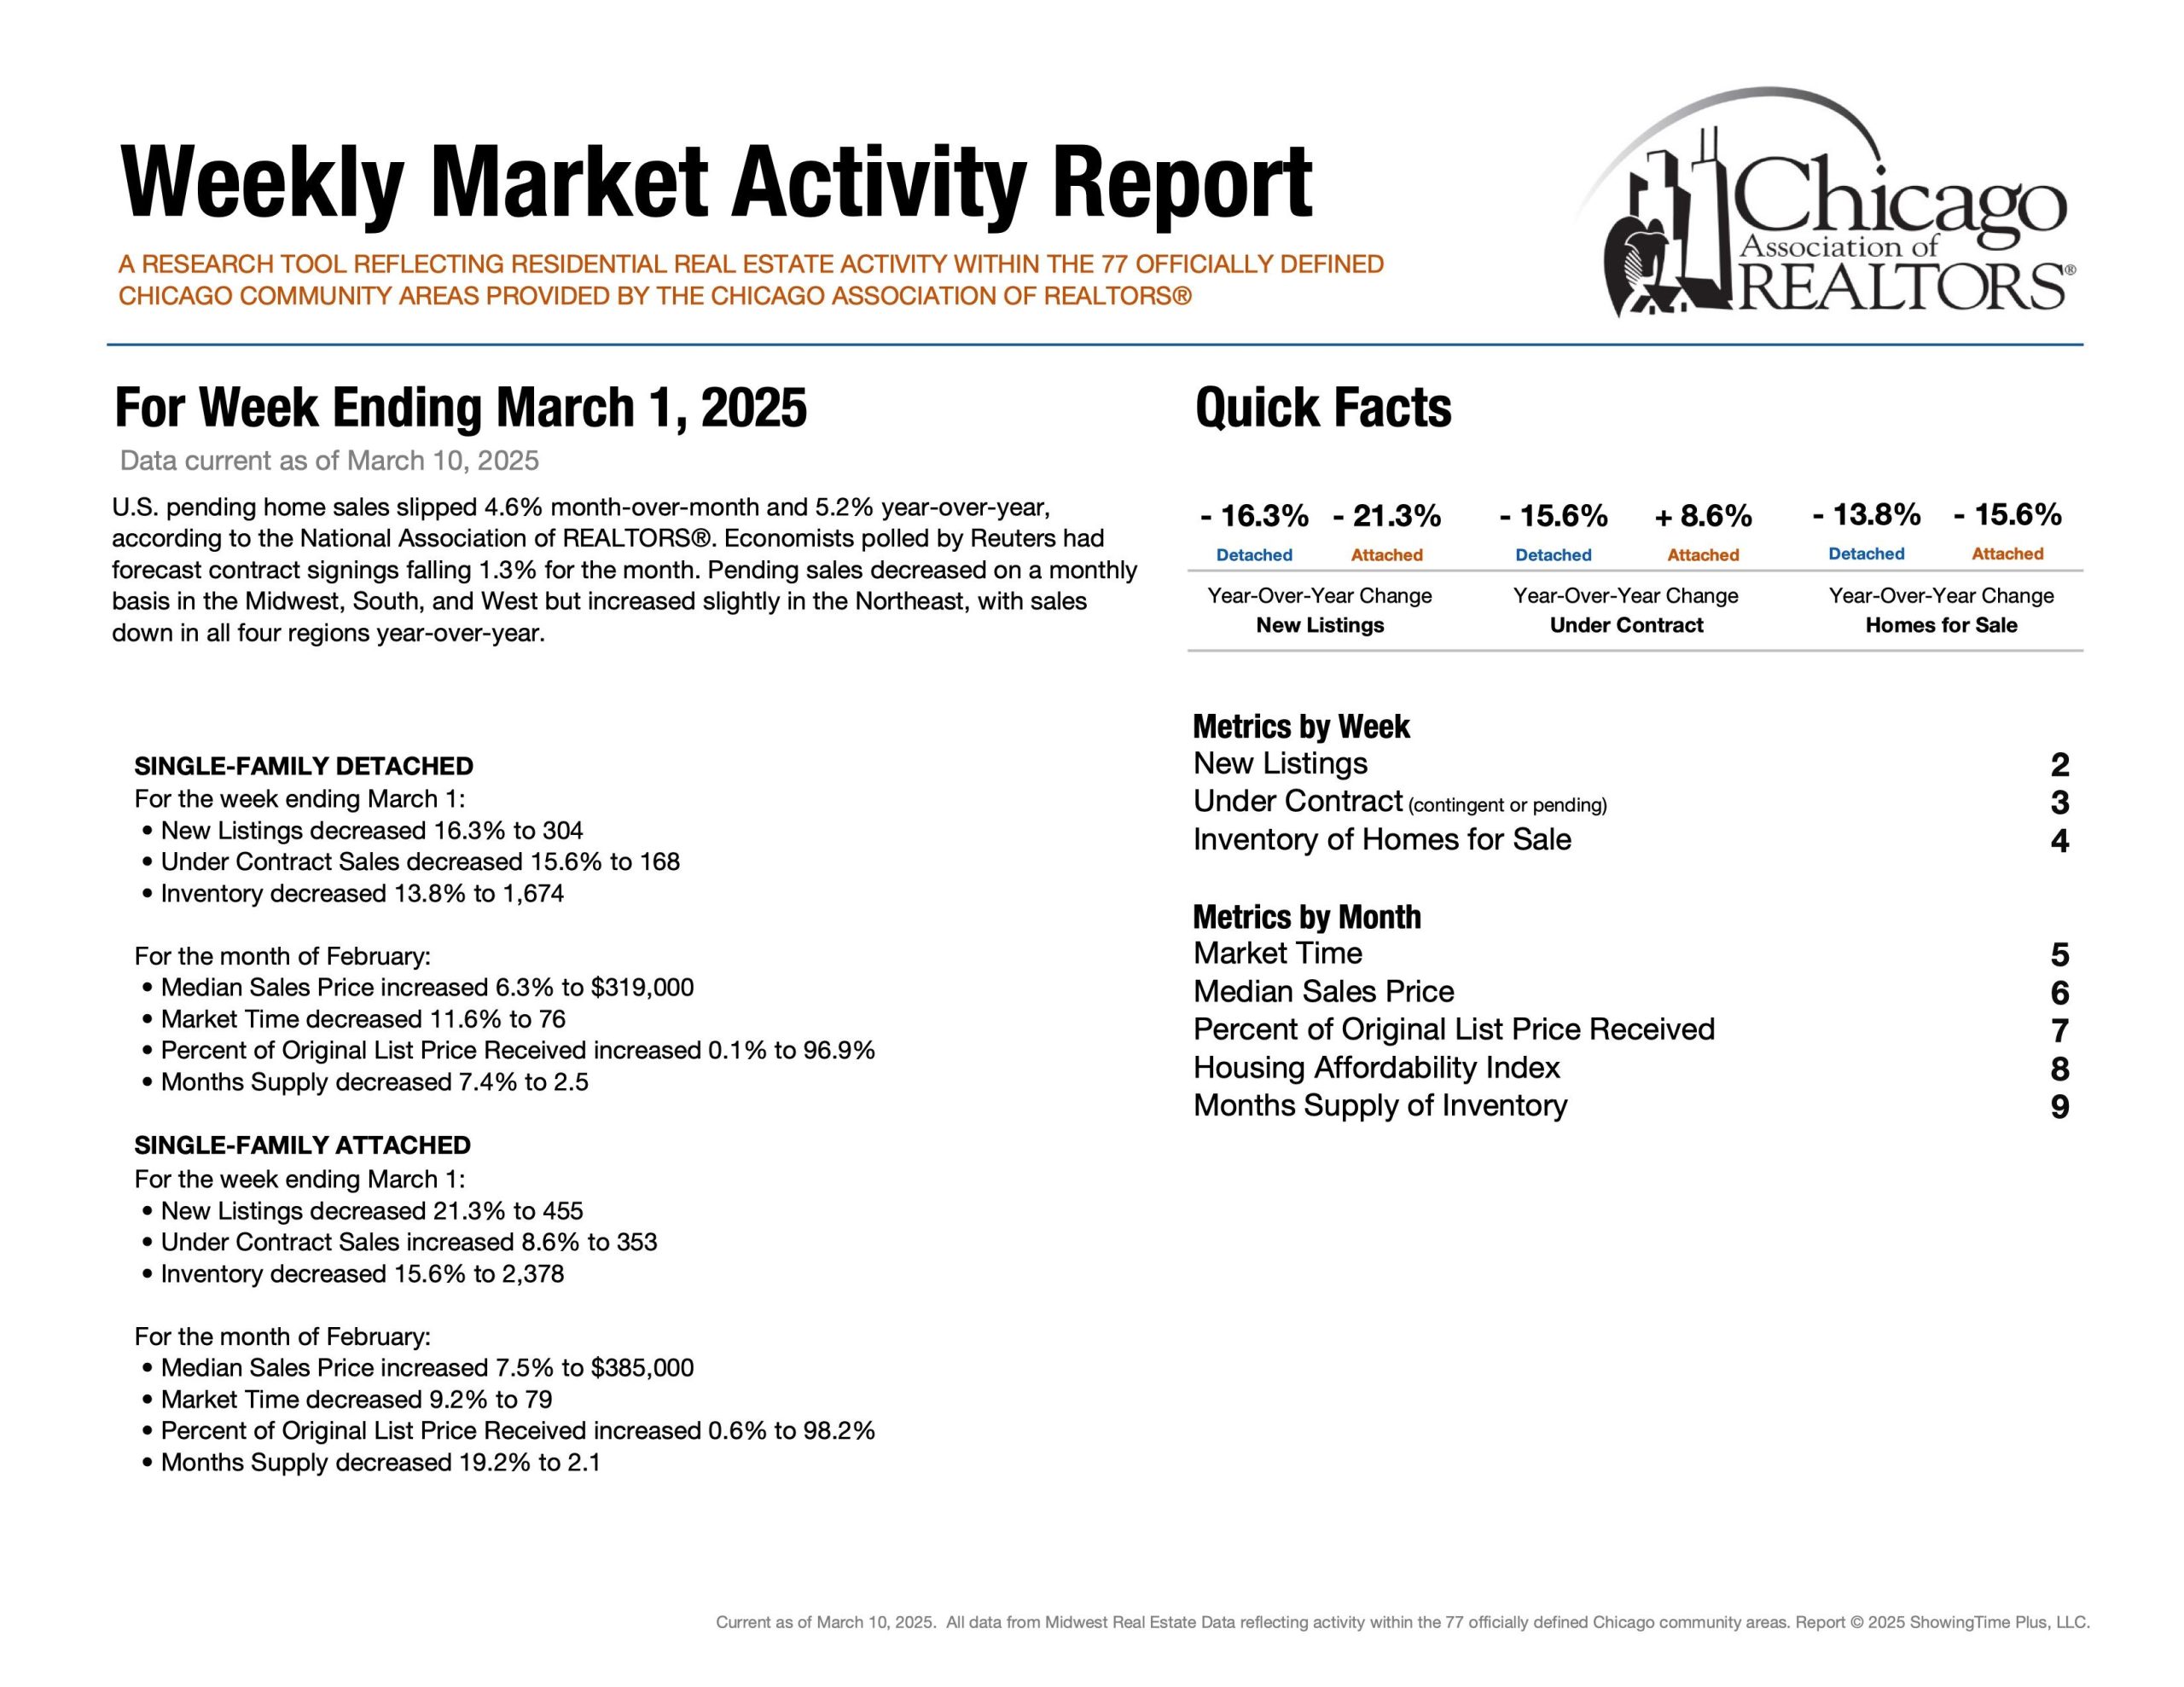
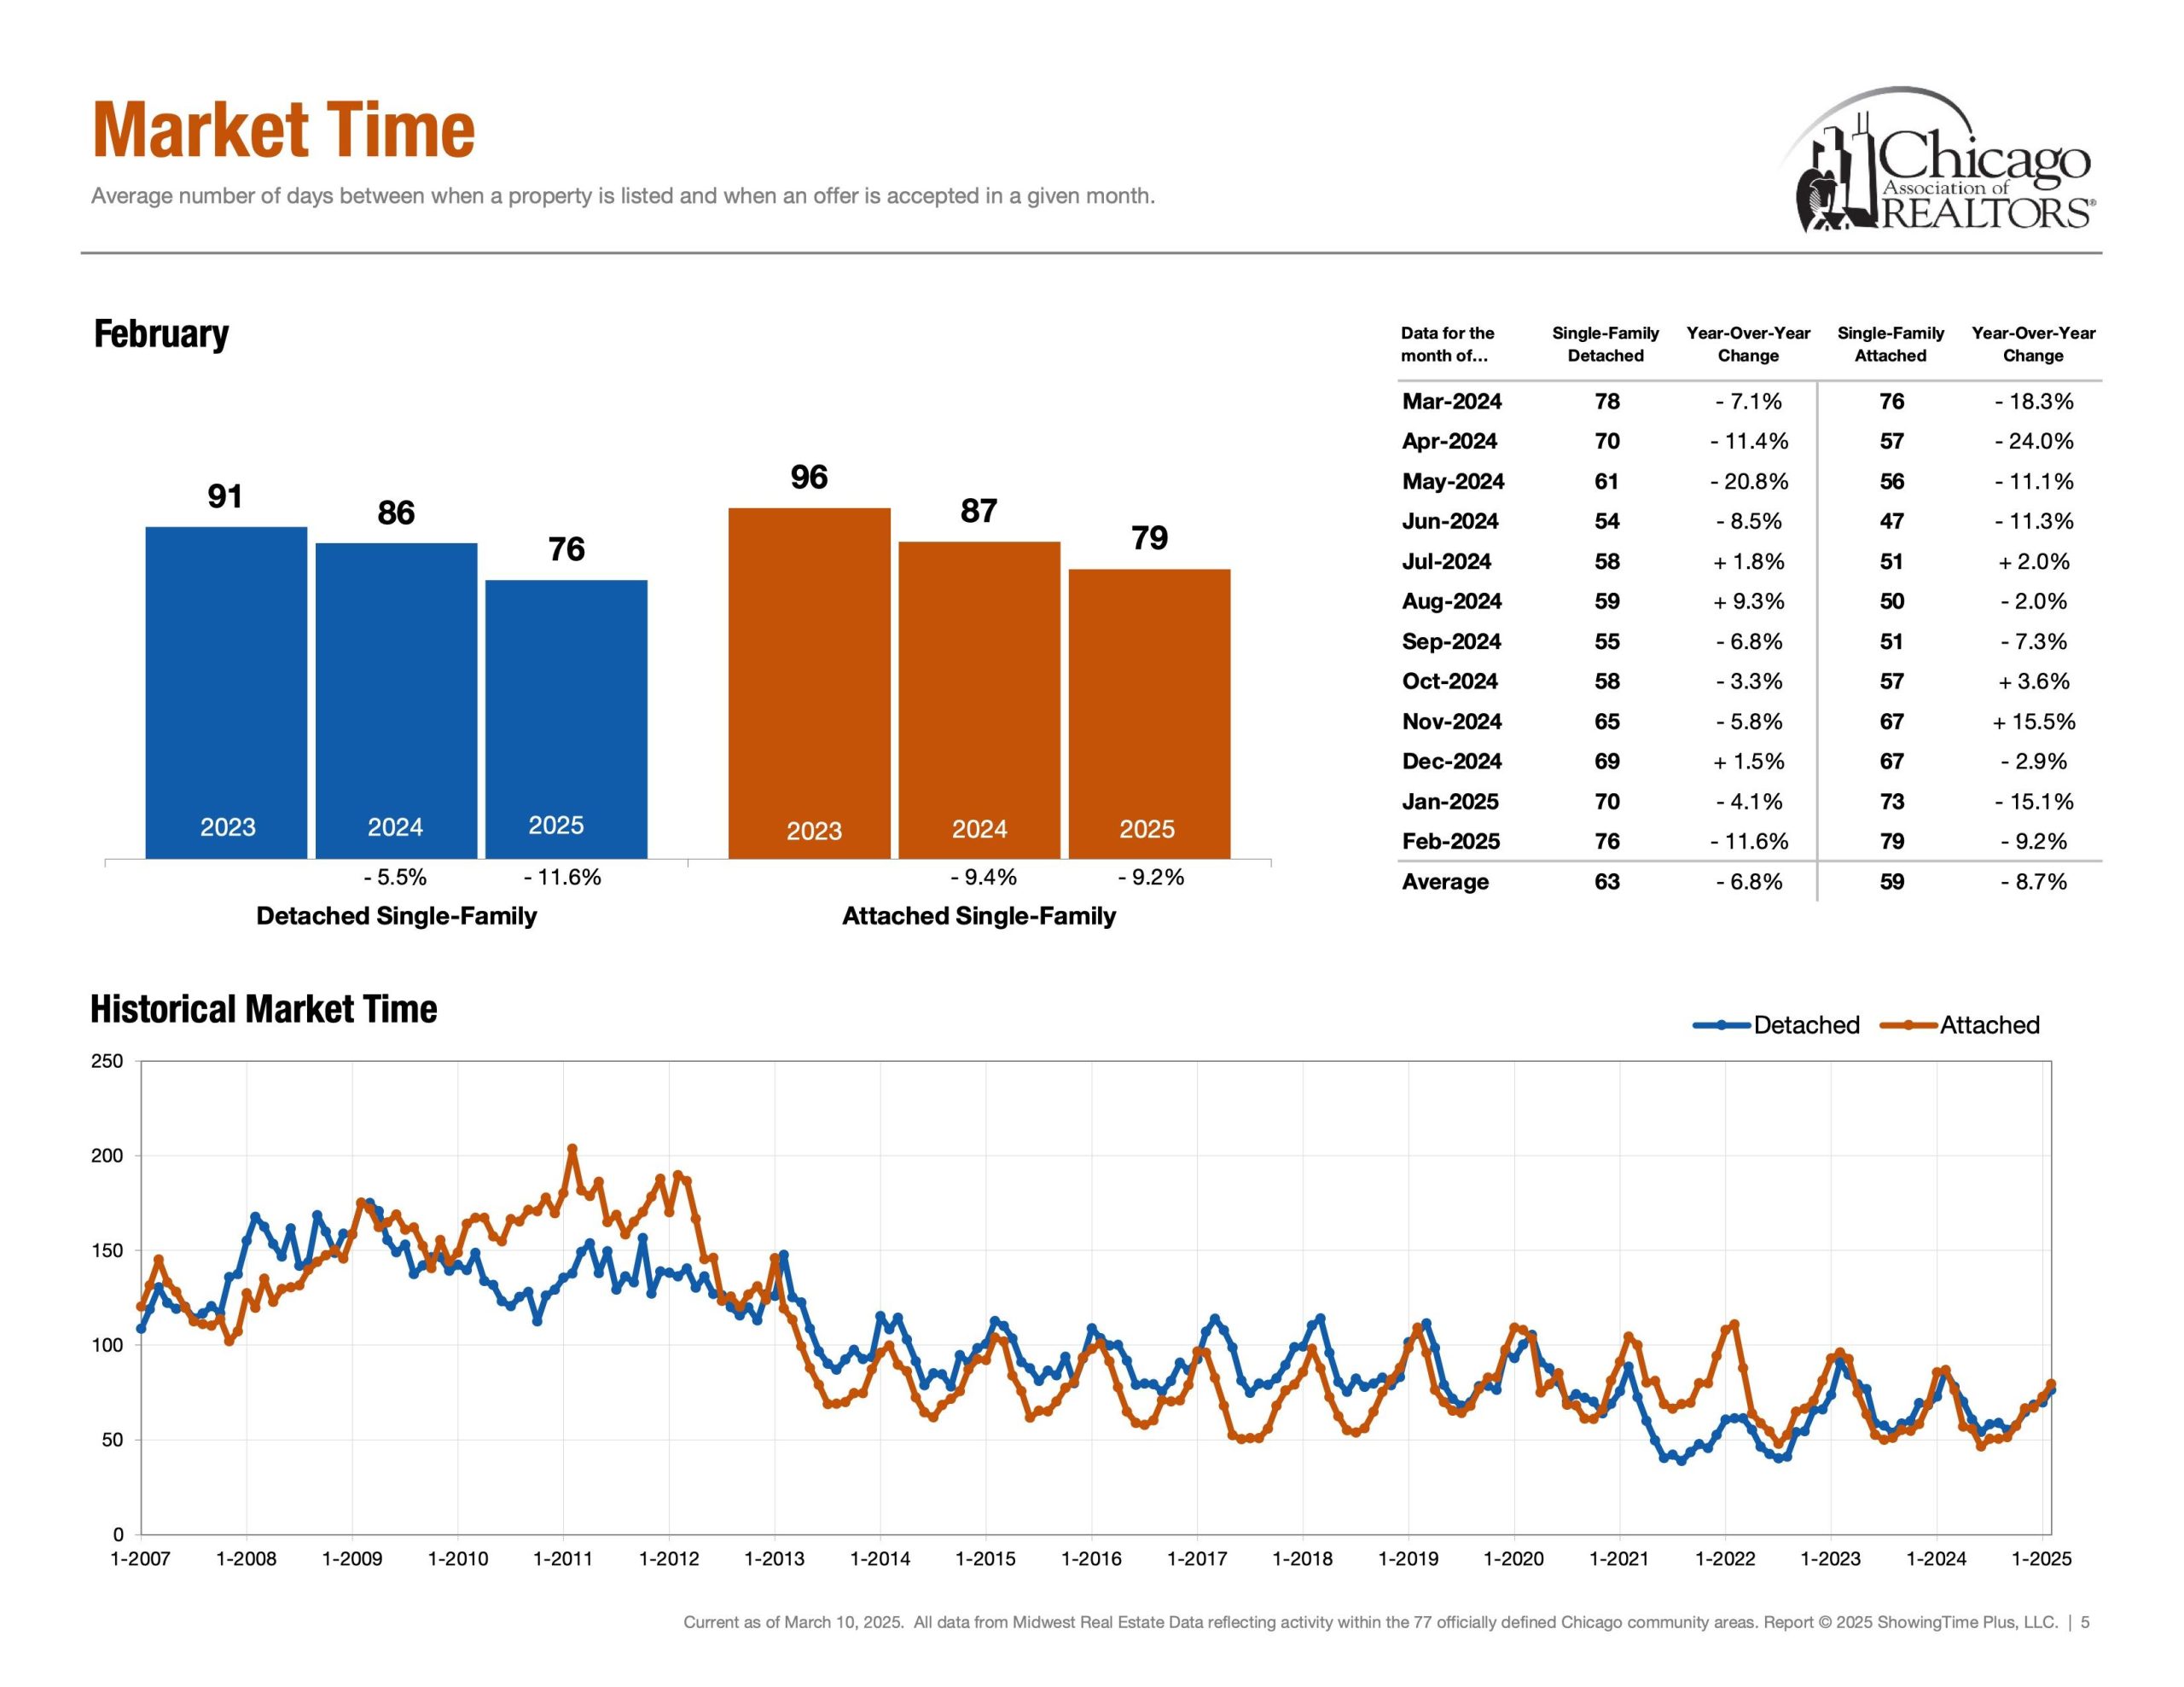
Speed | Healthy Market Time Range
Detached Single ~ 76 Days (Feb 25′)
Attached Single ~ 79 Days (Feb 25′)
First, market time is metric that showcases speed and whether a listing was priced too low, priced properly or priced too high. If a listing surpasses average days on market, it is a check engine light that your listing maybe overpriced.
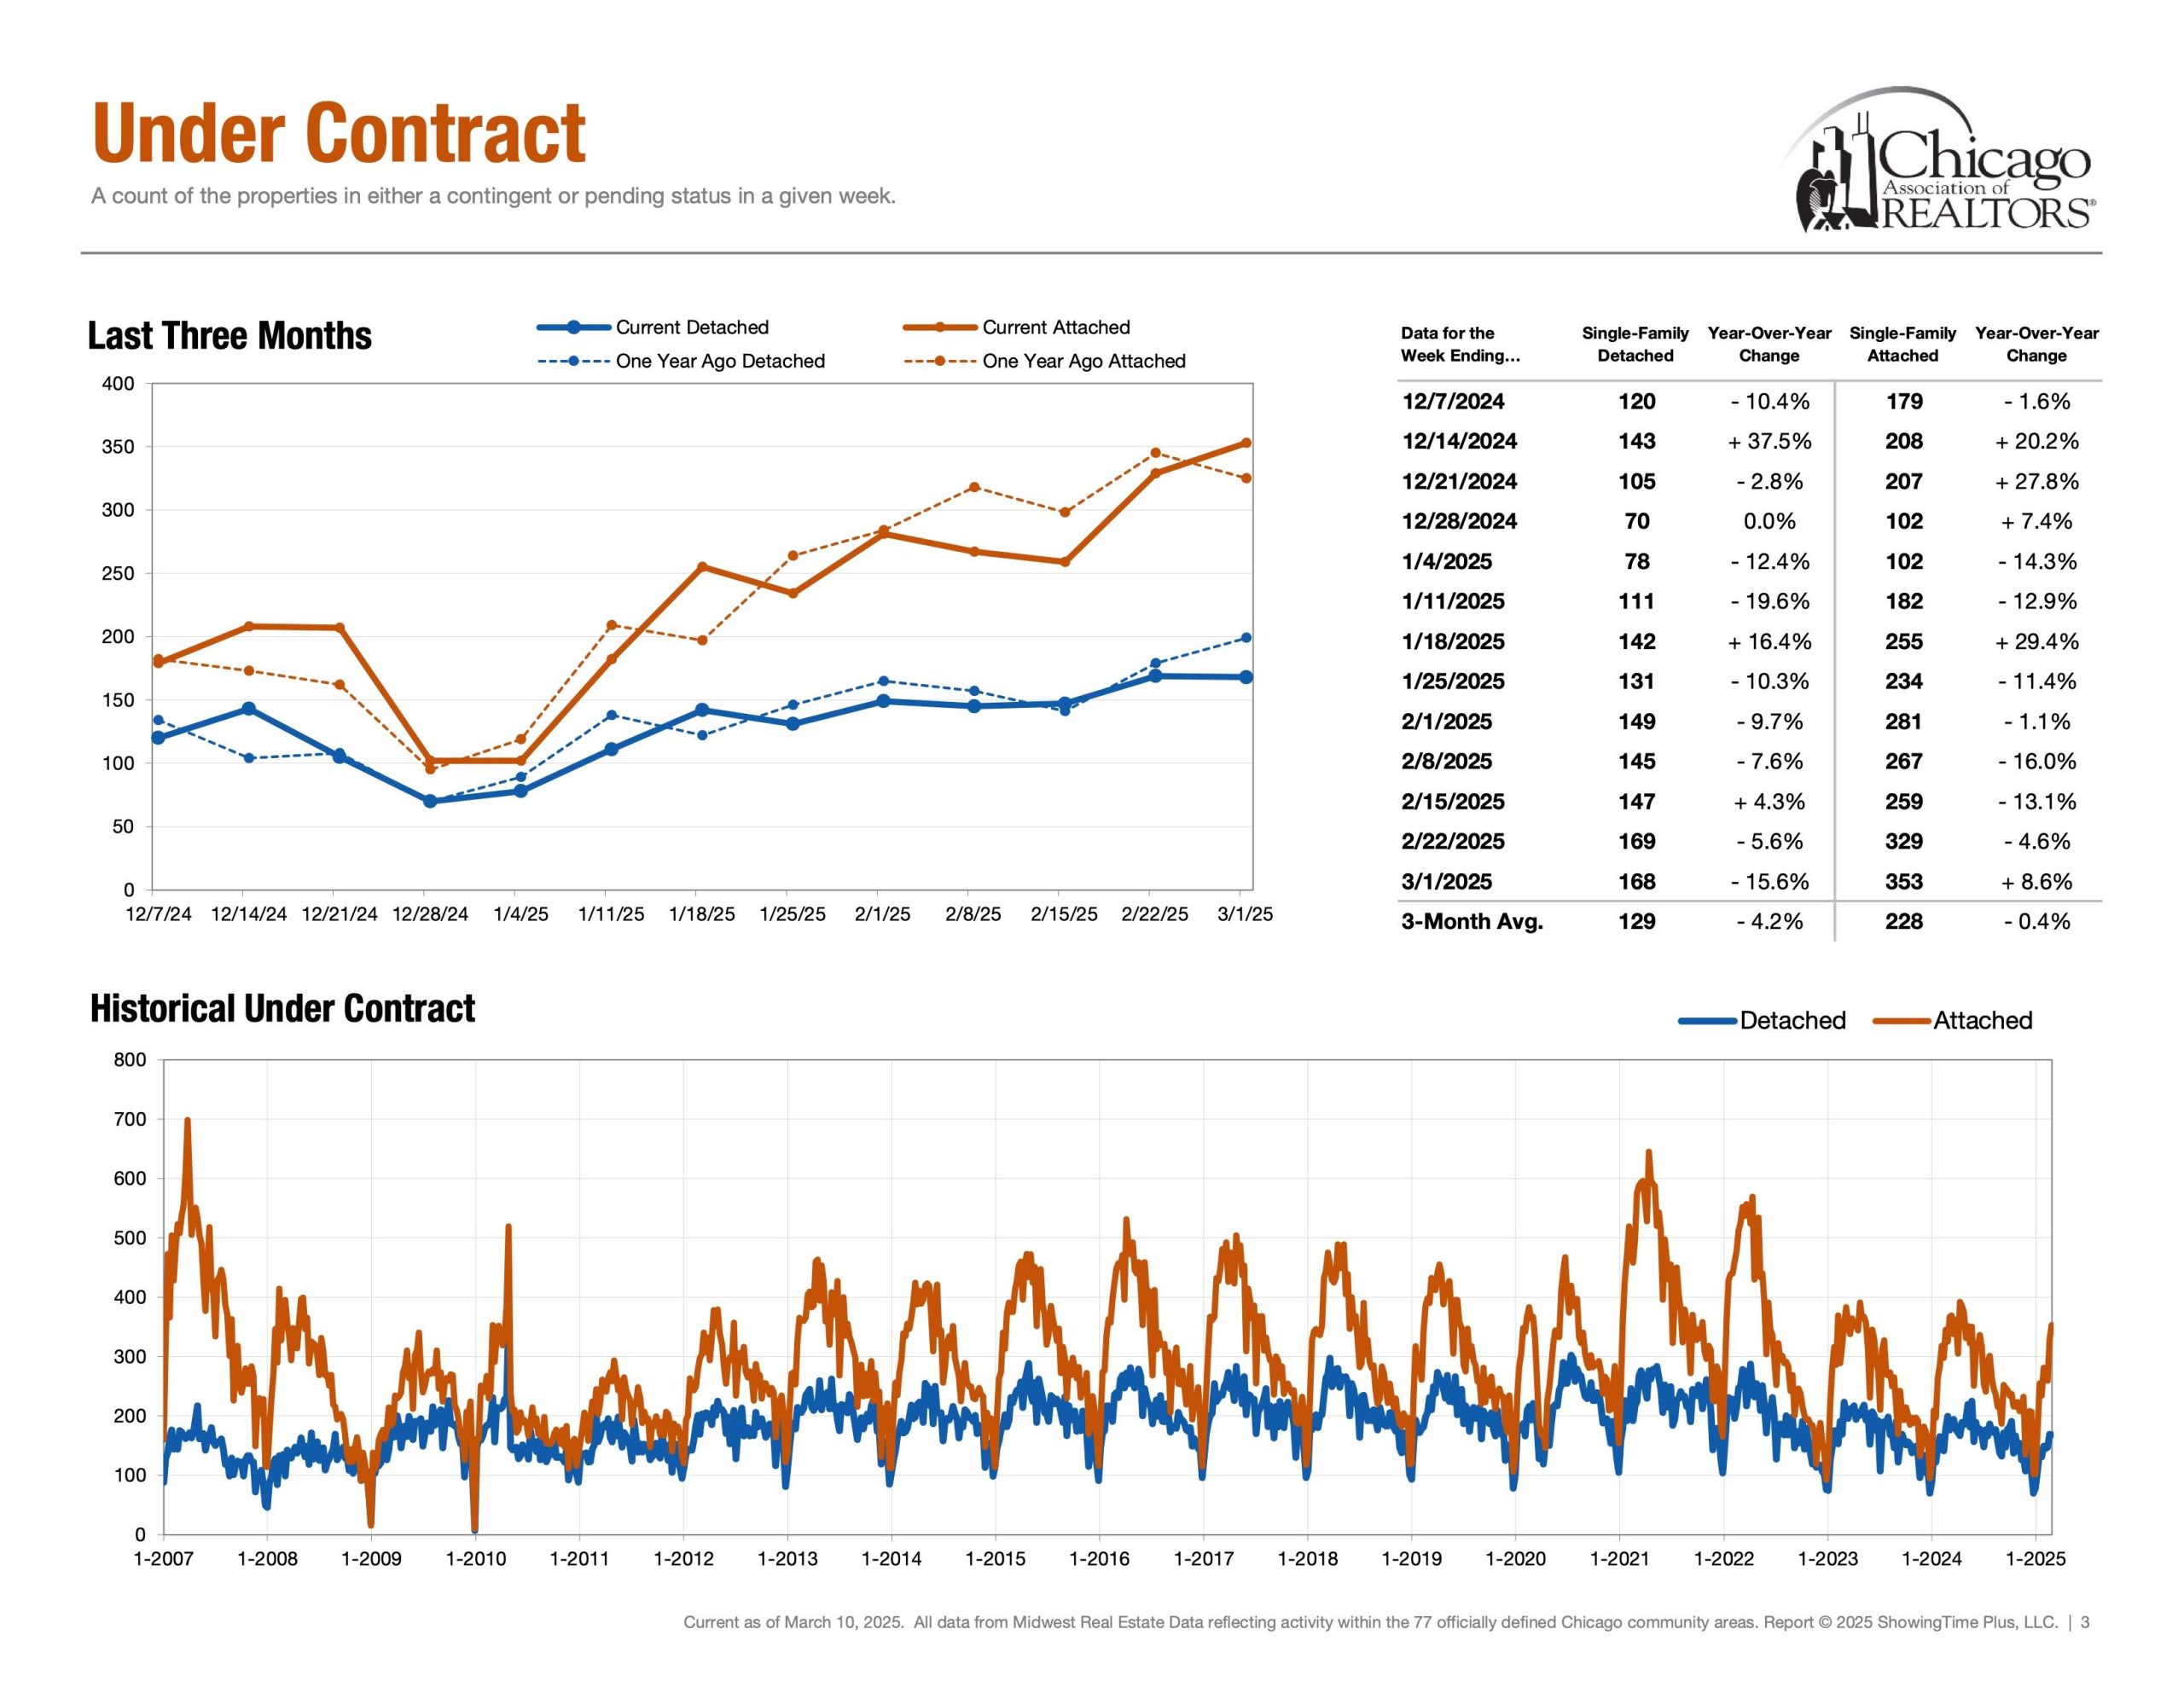
Demand | Under Contract
Detached Single = 168 Properties (Feb 23rd – March 1st)
Attached Single = 353 Properties (Feb 23rd – March 1st)
Secondly, under contract helps answer the question, “In our current market, how many buyers are buying?” Showcasing the heartbeat of the real estate market. Interestingly, demand metrics become more insightful when compared and contrasted with supply/inventory metrics.
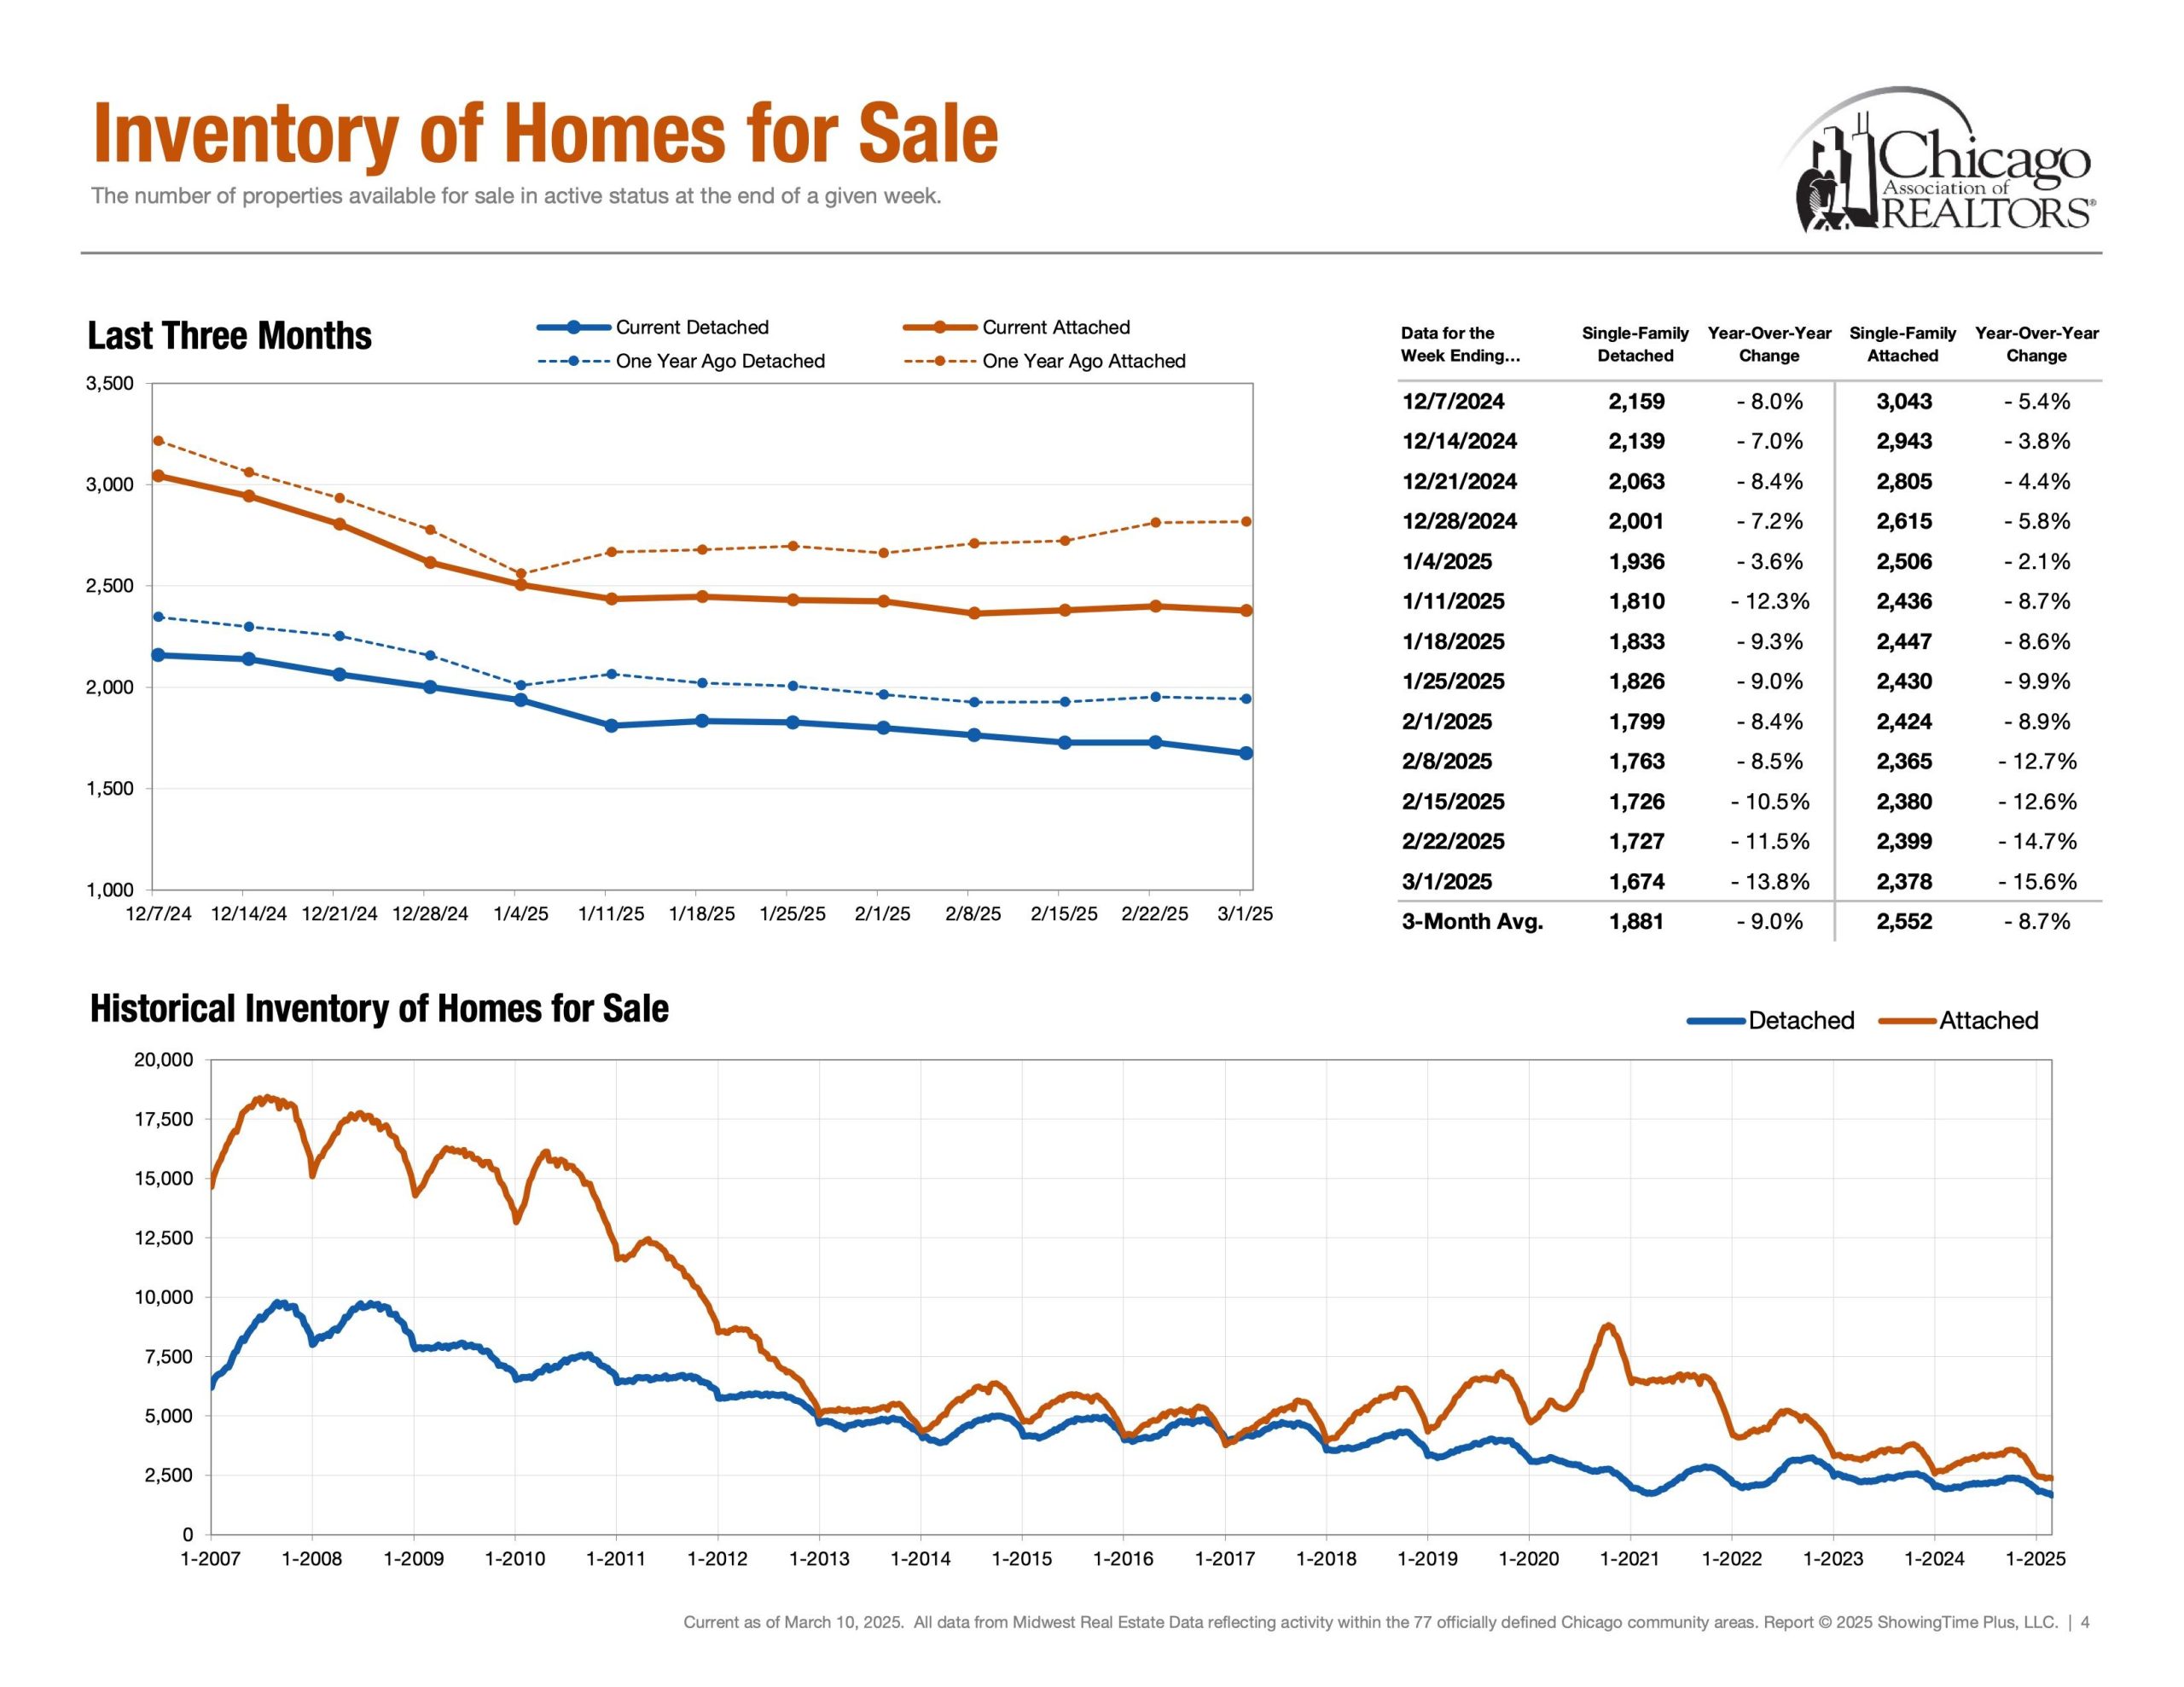
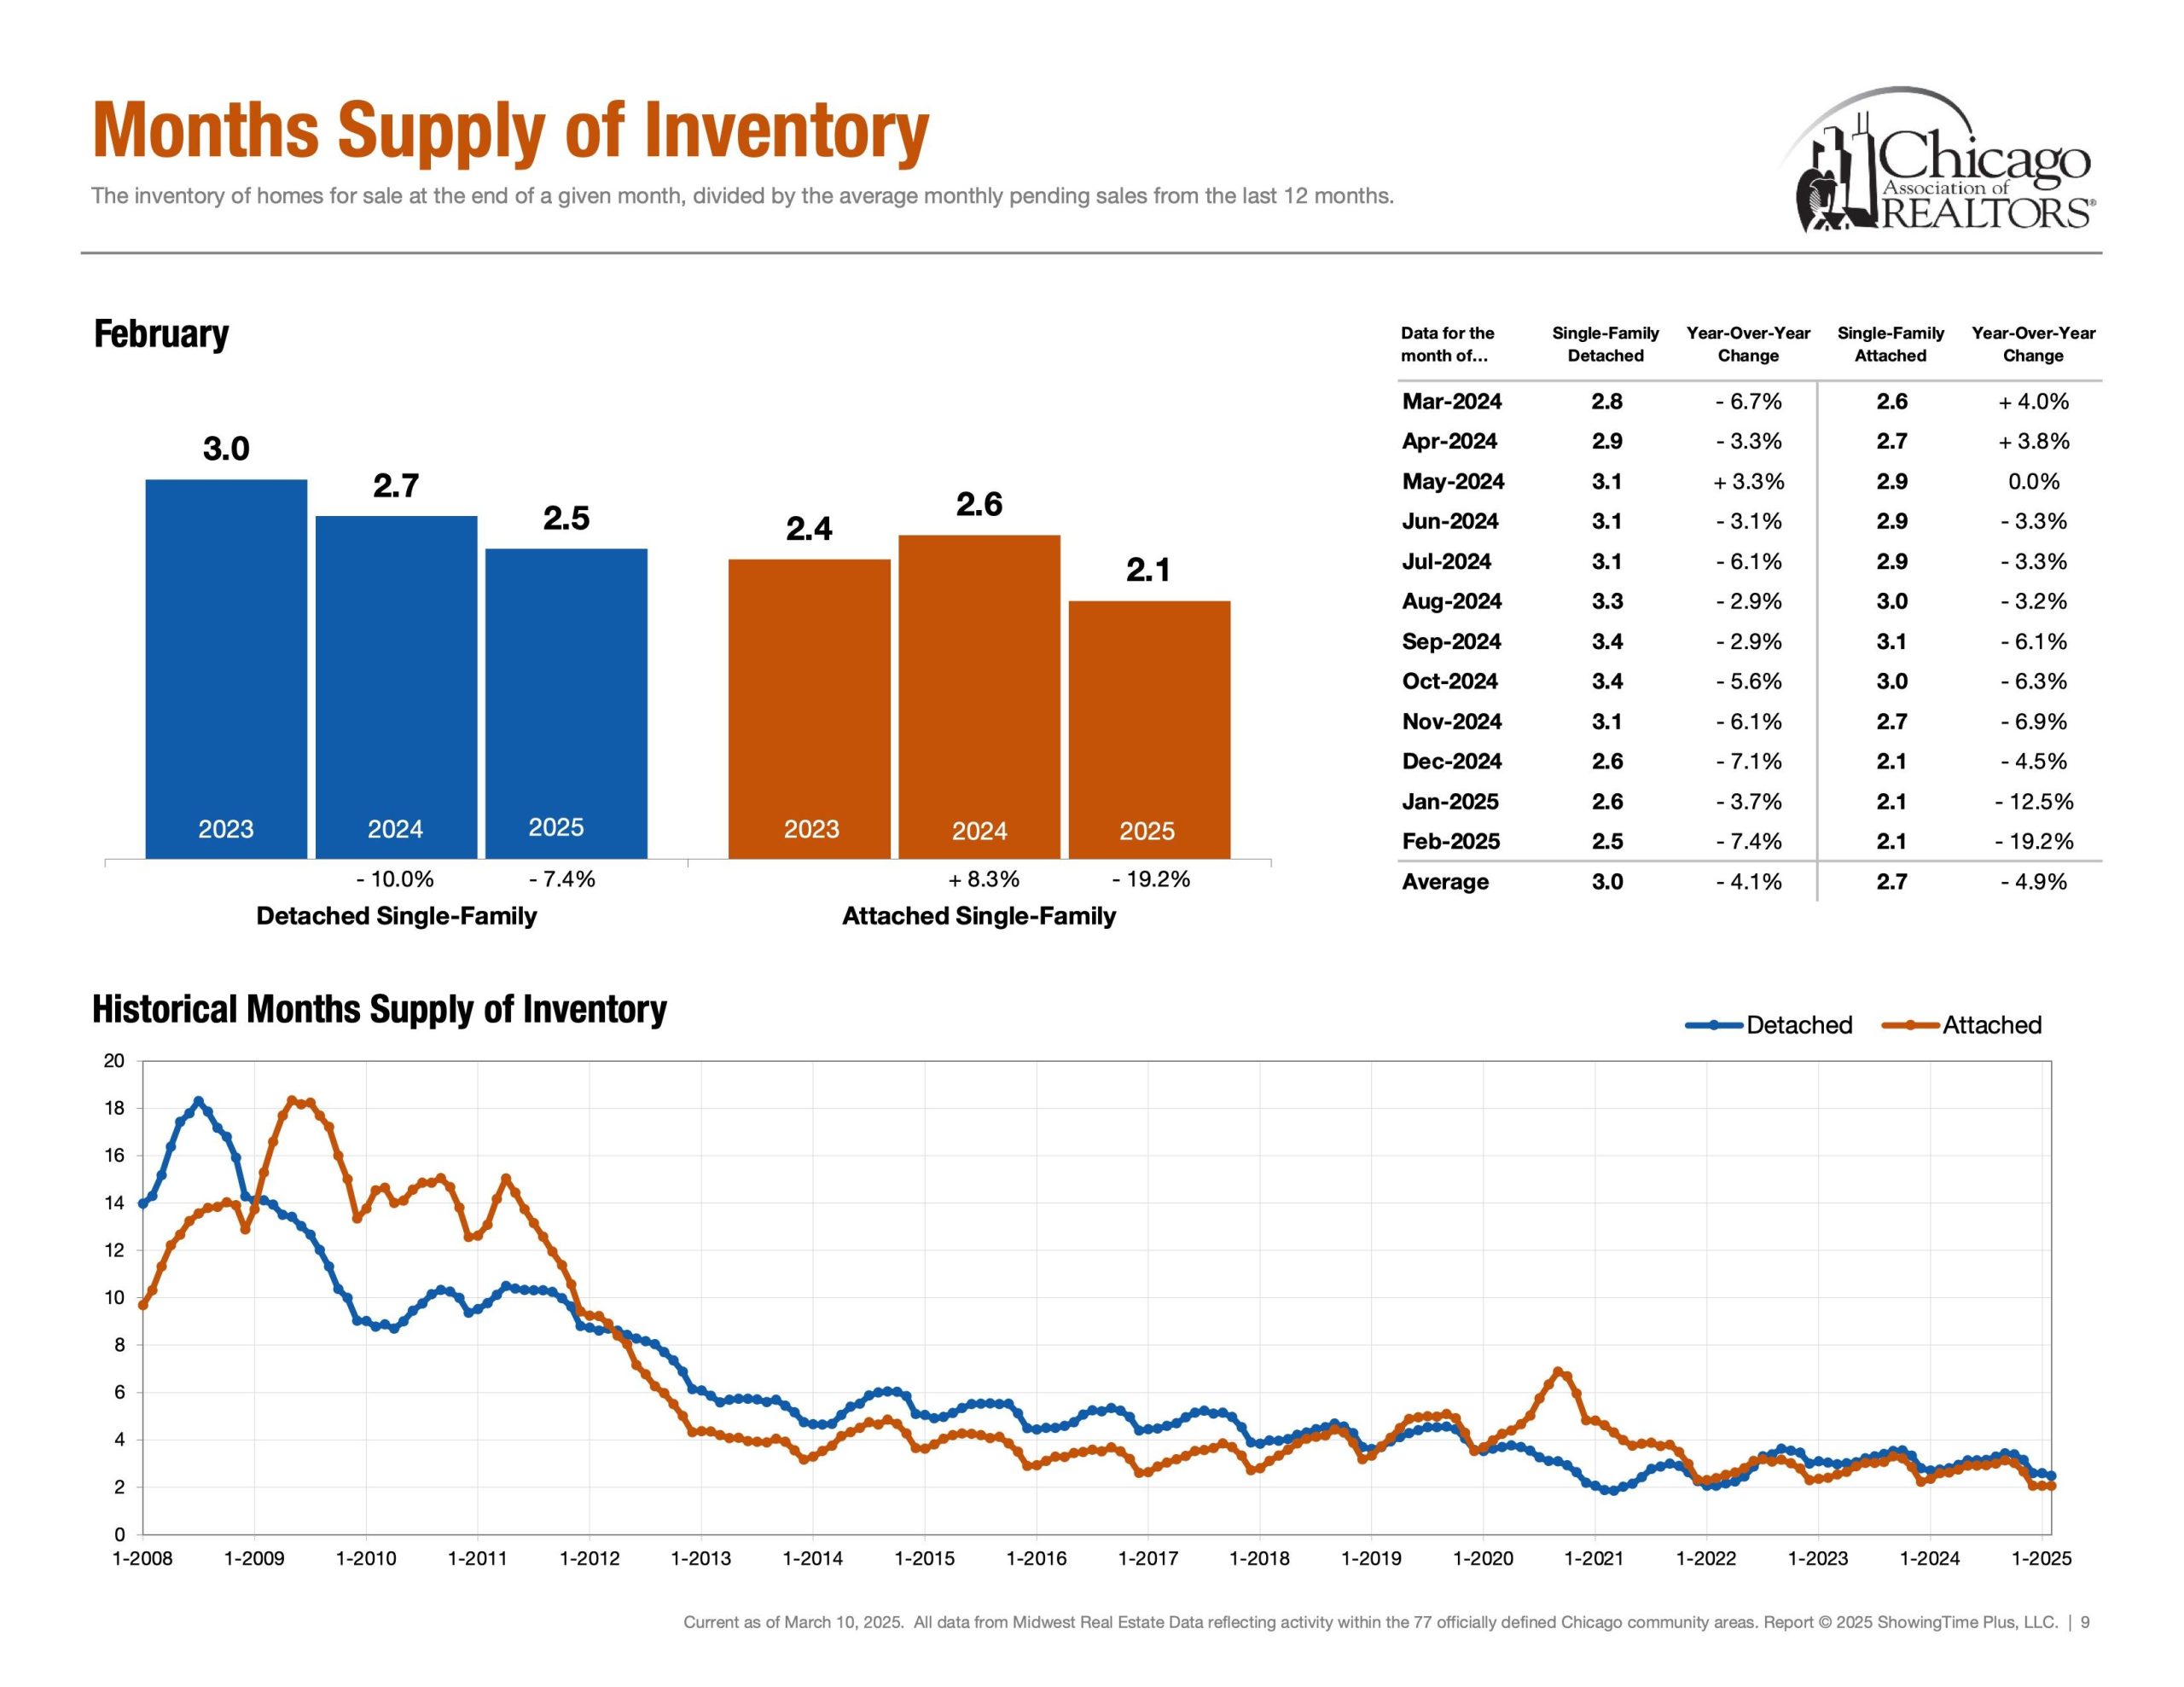
Supply | Inventory of Homes for Sale
Detached Single = 1,674 Properties (Feb 23rd – March 1st)
Attached Single = 2,378 Properties (Feb 23rd – March 1st)
Next, probably the metric of the year. Inventory of homes for sale showcases supply and answers the question, “How much inventory is available for buyers and how much competition sellers are up against?” Additionally, Months of Inventory, Homes for Sale, New Listings and Absorption Rate are also other key metrics in the conversation of supply.
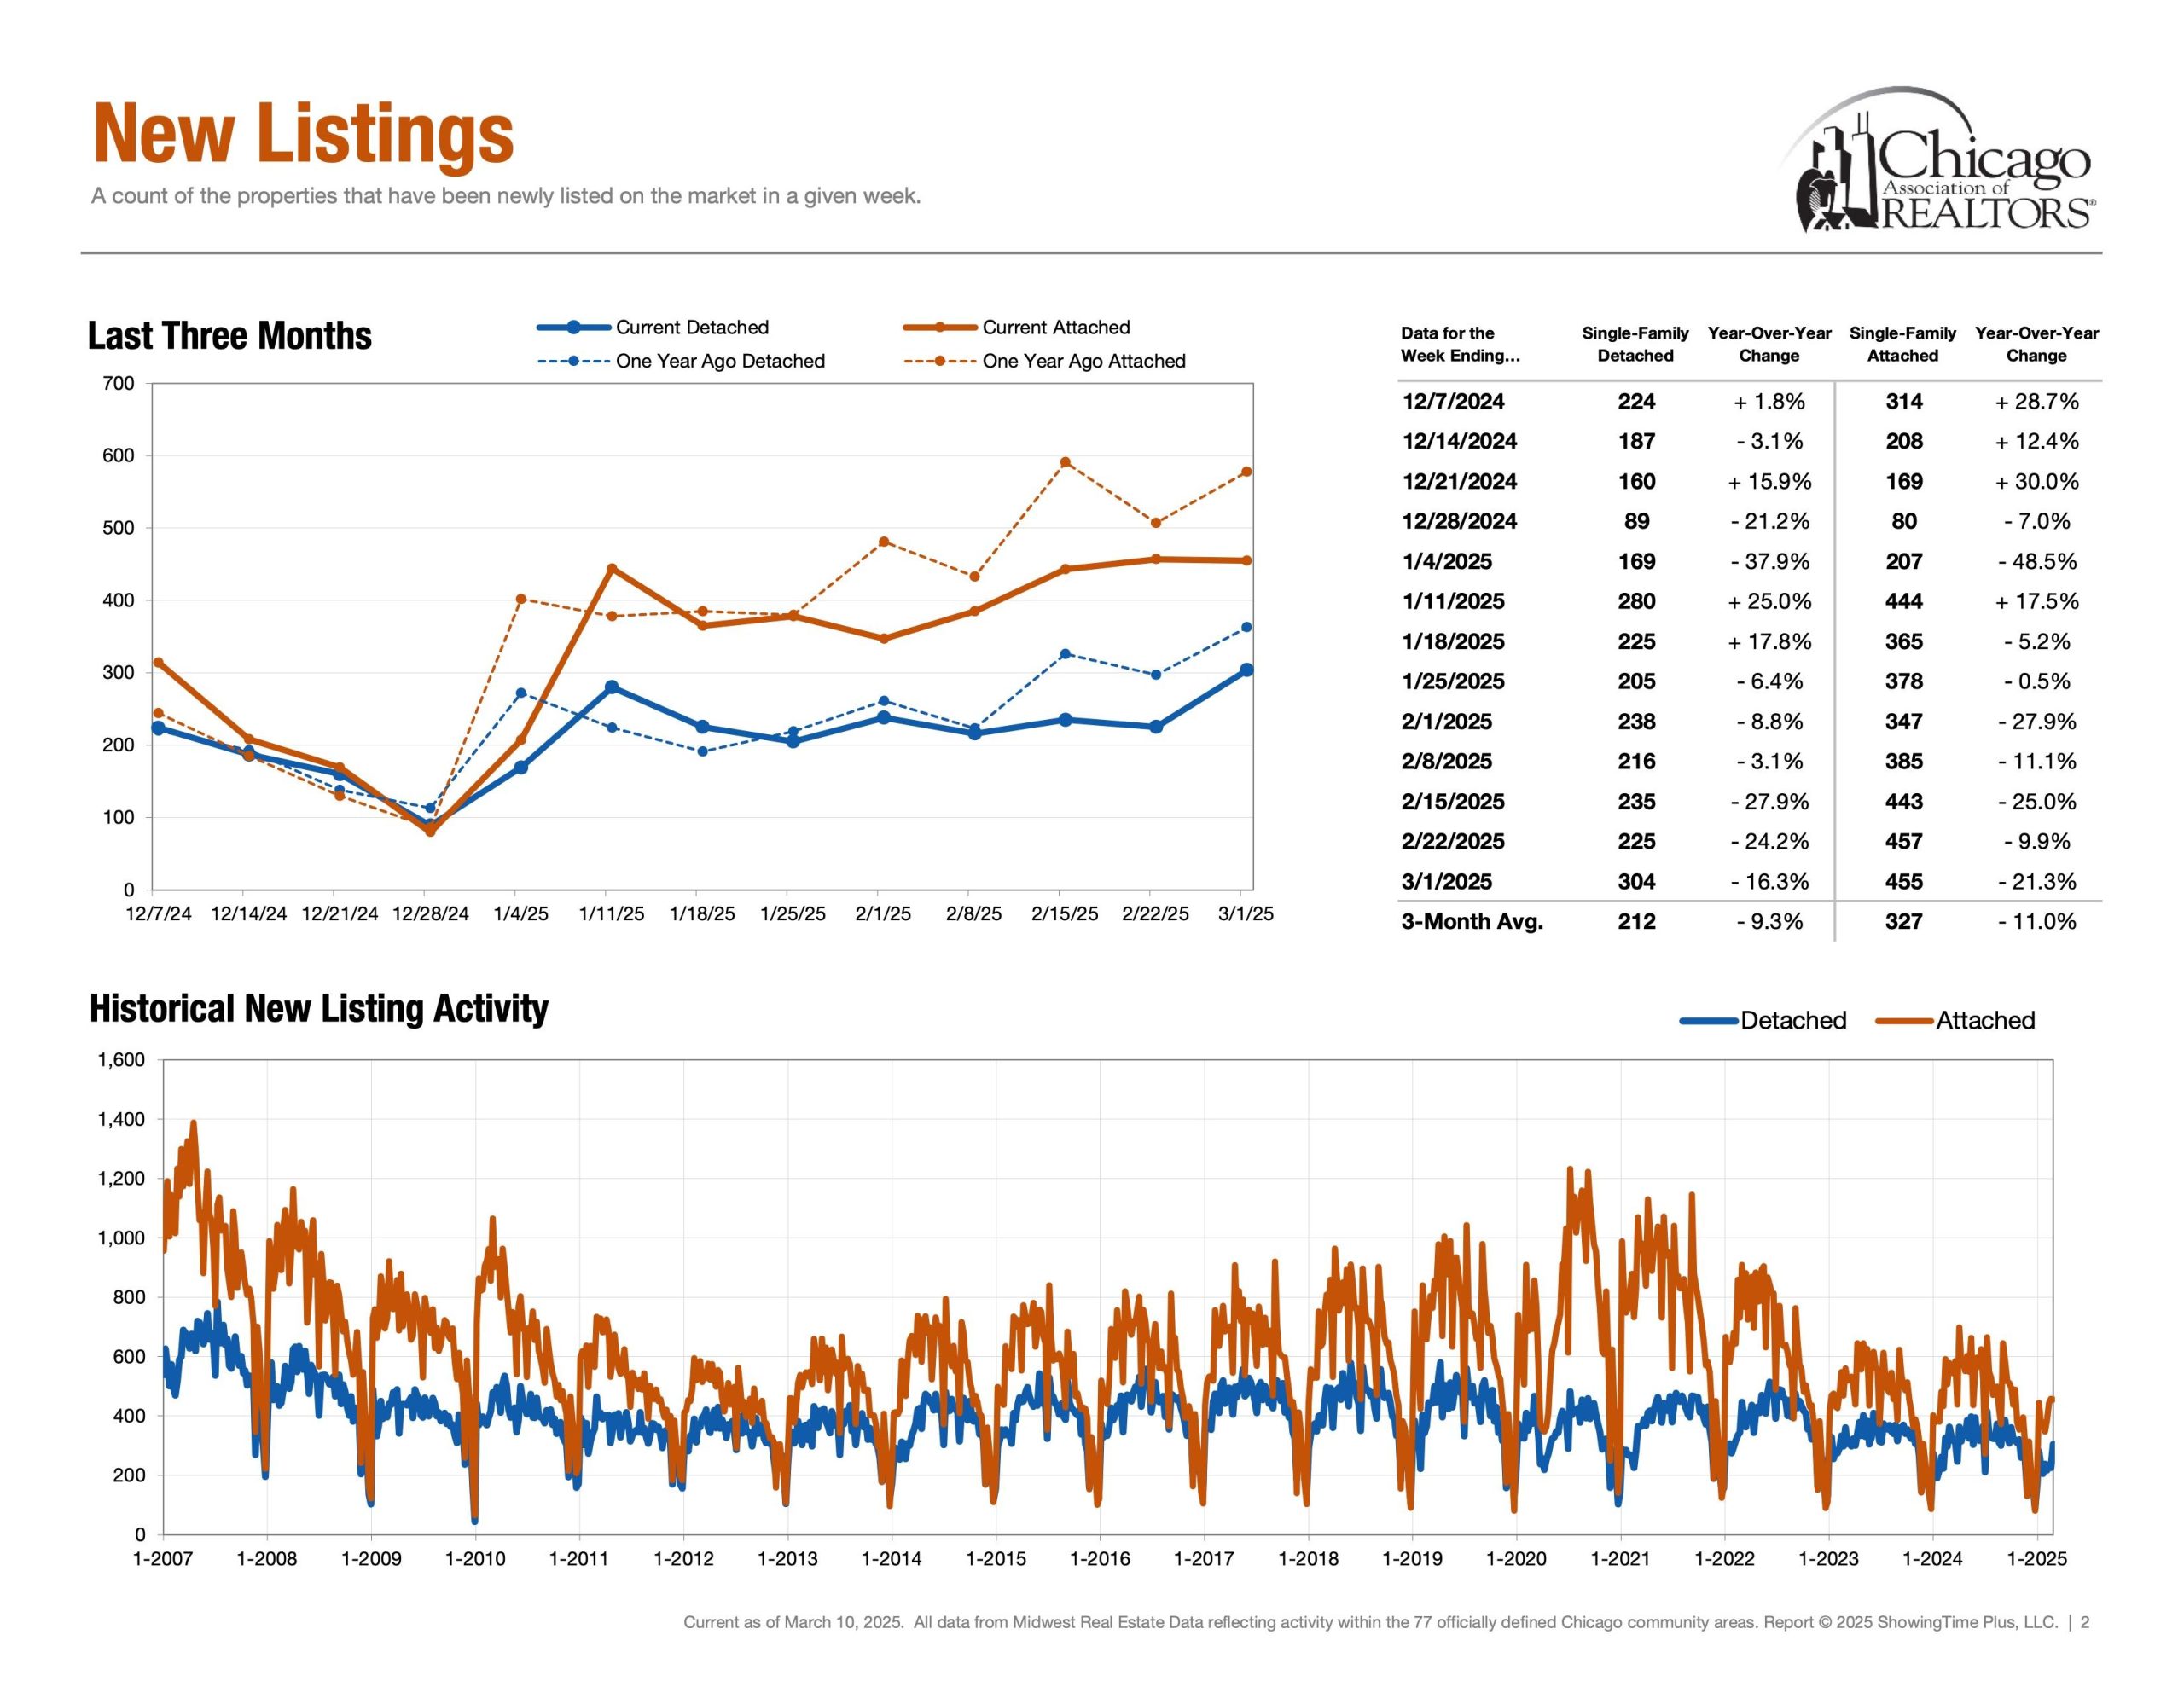
Supply | New Listings
Detached Single = 304 Properties (Feb 23rd – March 1st)
Attached Single = 455 Properties (Feb 23rd – March 1st)
New Listings is a foreshadowing metric and helps visualize when inventory enters the market.
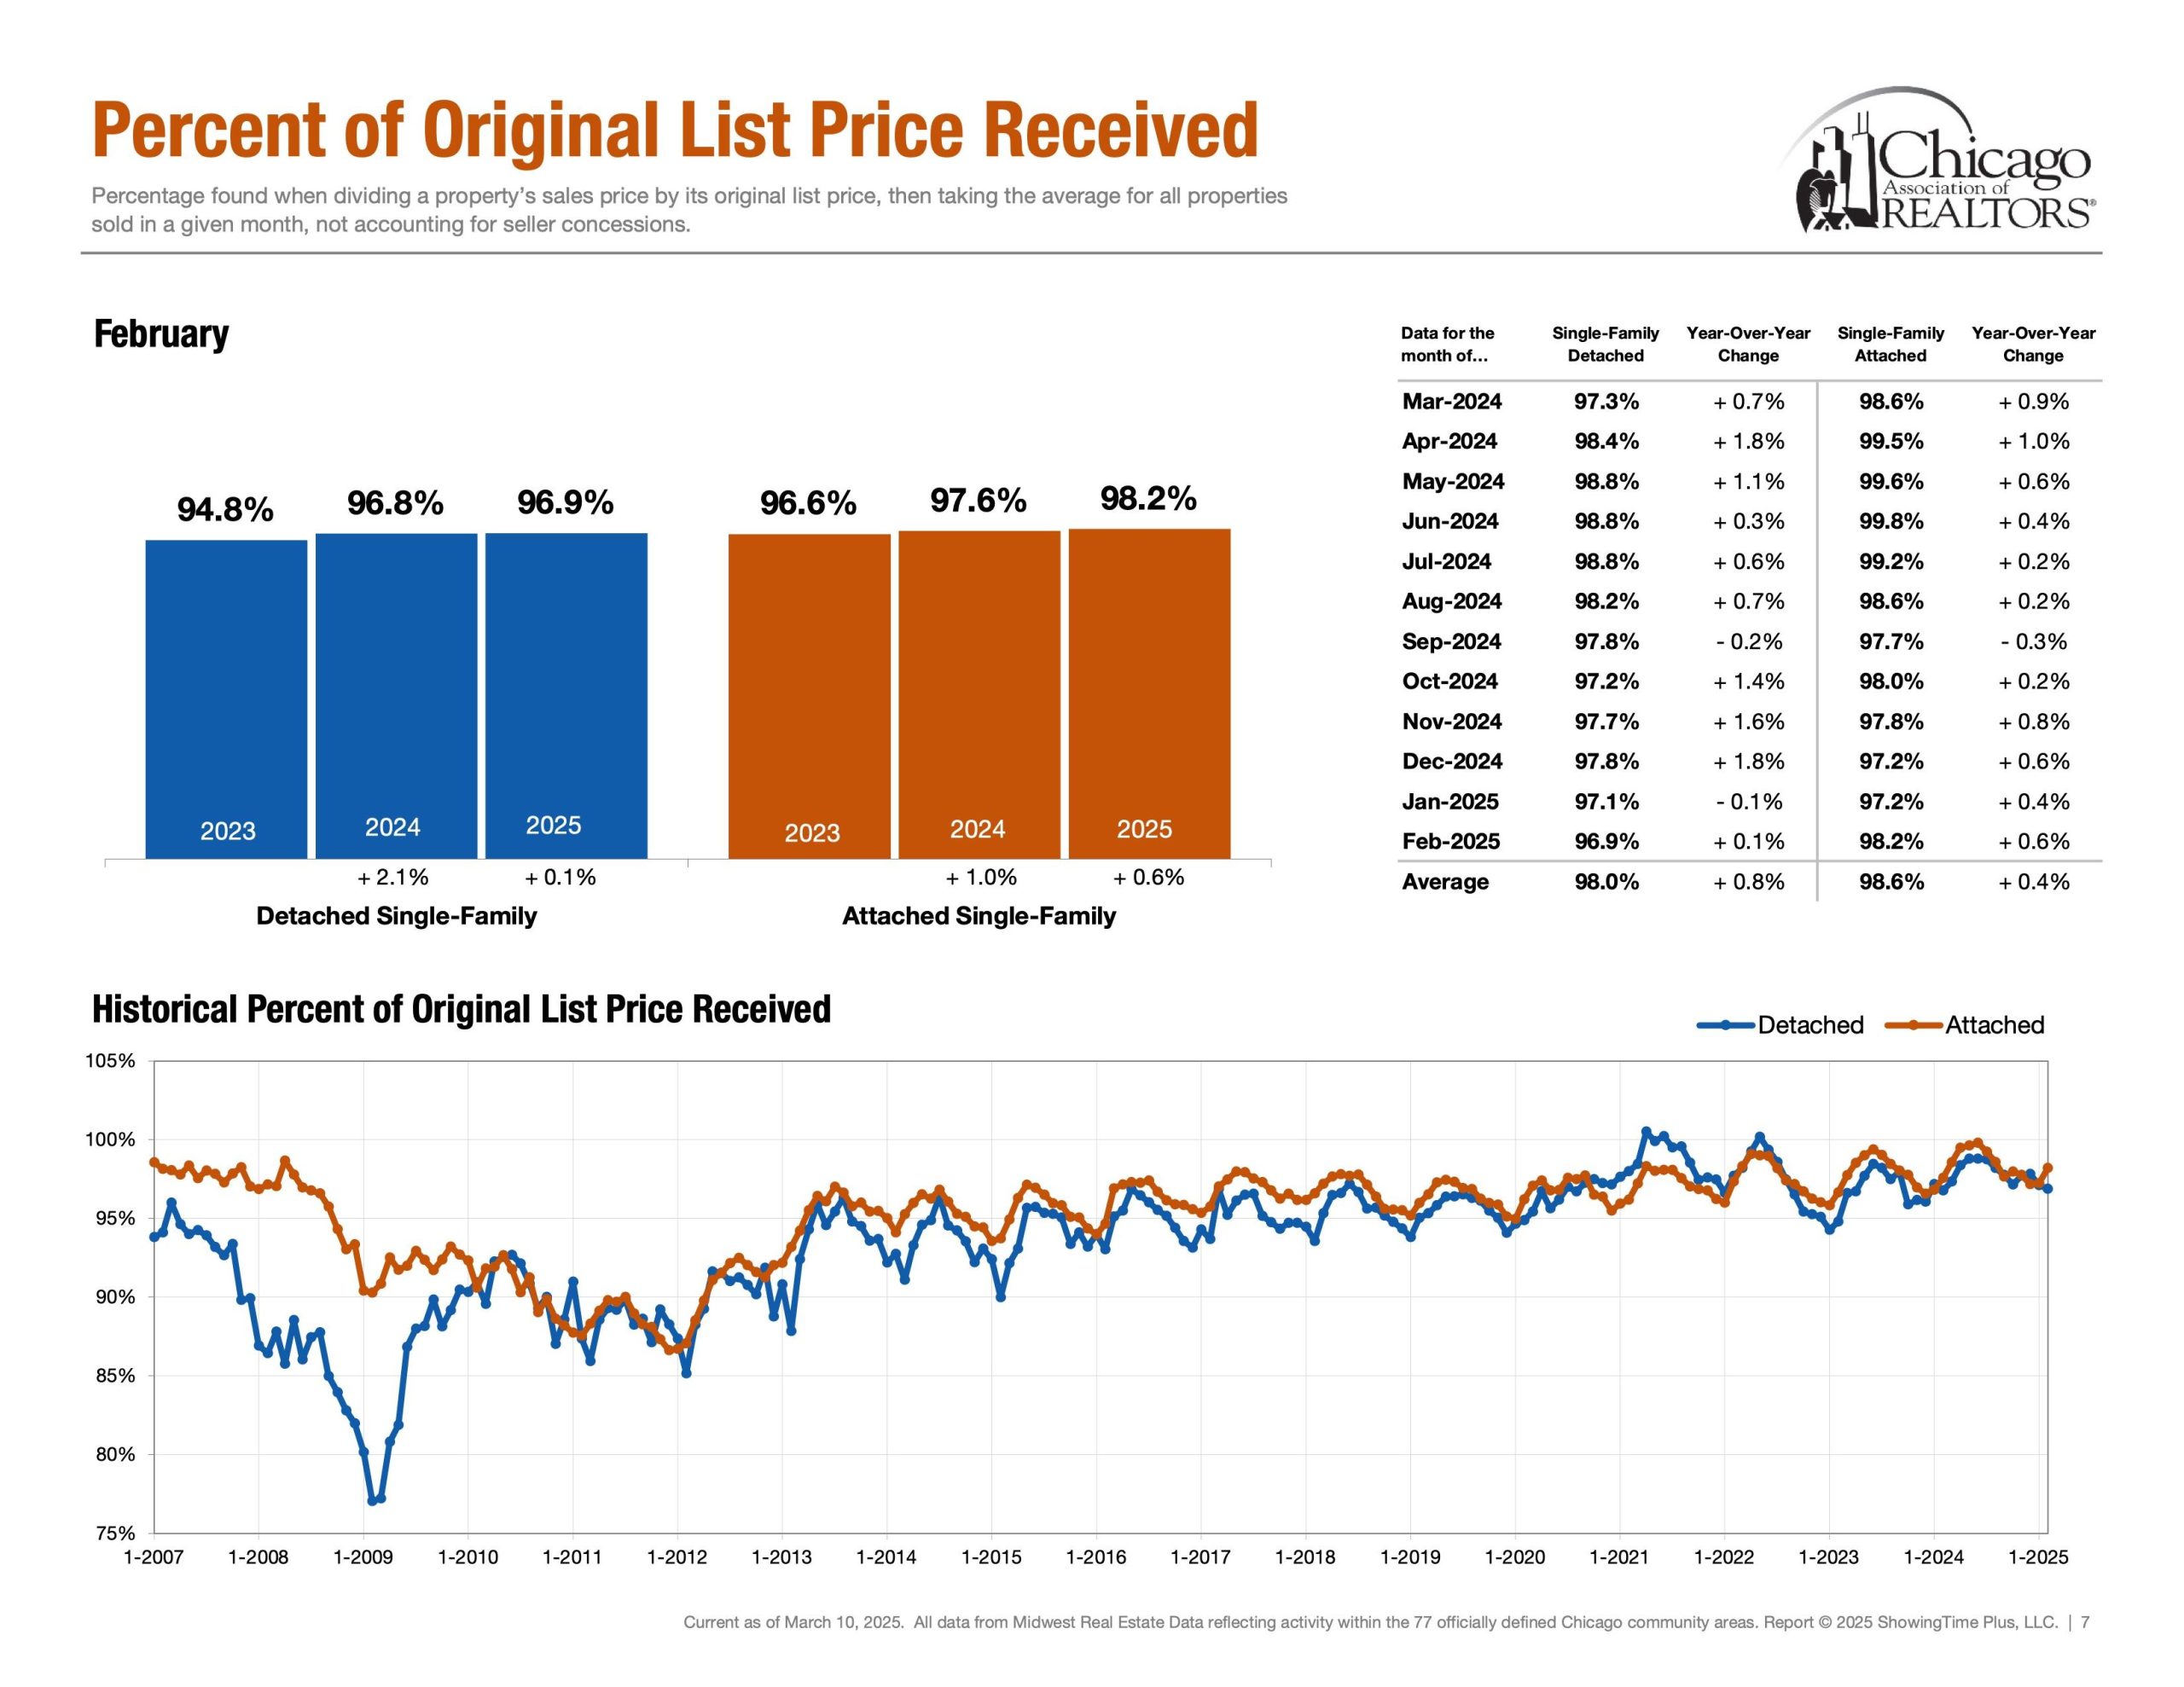
Negotiations | Percentage of Original List Price Received
Detached Single ~ 98% (Rolling 12 Months Avg) & ~ 97.1% (Feb 25′)
Attached Single ~ 98.6% (Rolling 12 Months Avg) & ~ 97.2% (Feb 25′)
Lastly, Percentage of Original List Price Received to Closed Price is a metric that showcases what the average accepted purchase price is relative to the list price. How much below asking price can an offer go while still getting accepted? How much would one have to offer above ask in order to be an above average purchase price?
The End | Have A Great Day!
Please note all of these metrics are along a spectrum as opposed to a specific number. Below is “The Weekly Market Activity Report” which is a research tool reflecting residential real estate activity within the 77 officially defined Chicago community areas provided by the Chicago Association of Realtors®. It is essential to keep in mind that real estate markets can vary across neighborhoods and property types within a city. In conclusion, economic conditions and external factors can influence market trends. Staying updated on these metrics and trends is crucial for making informed decisions.