Facebook
 X
X
 Pinterest
 Copy Link
How Is The Chicago Real Estate Market?
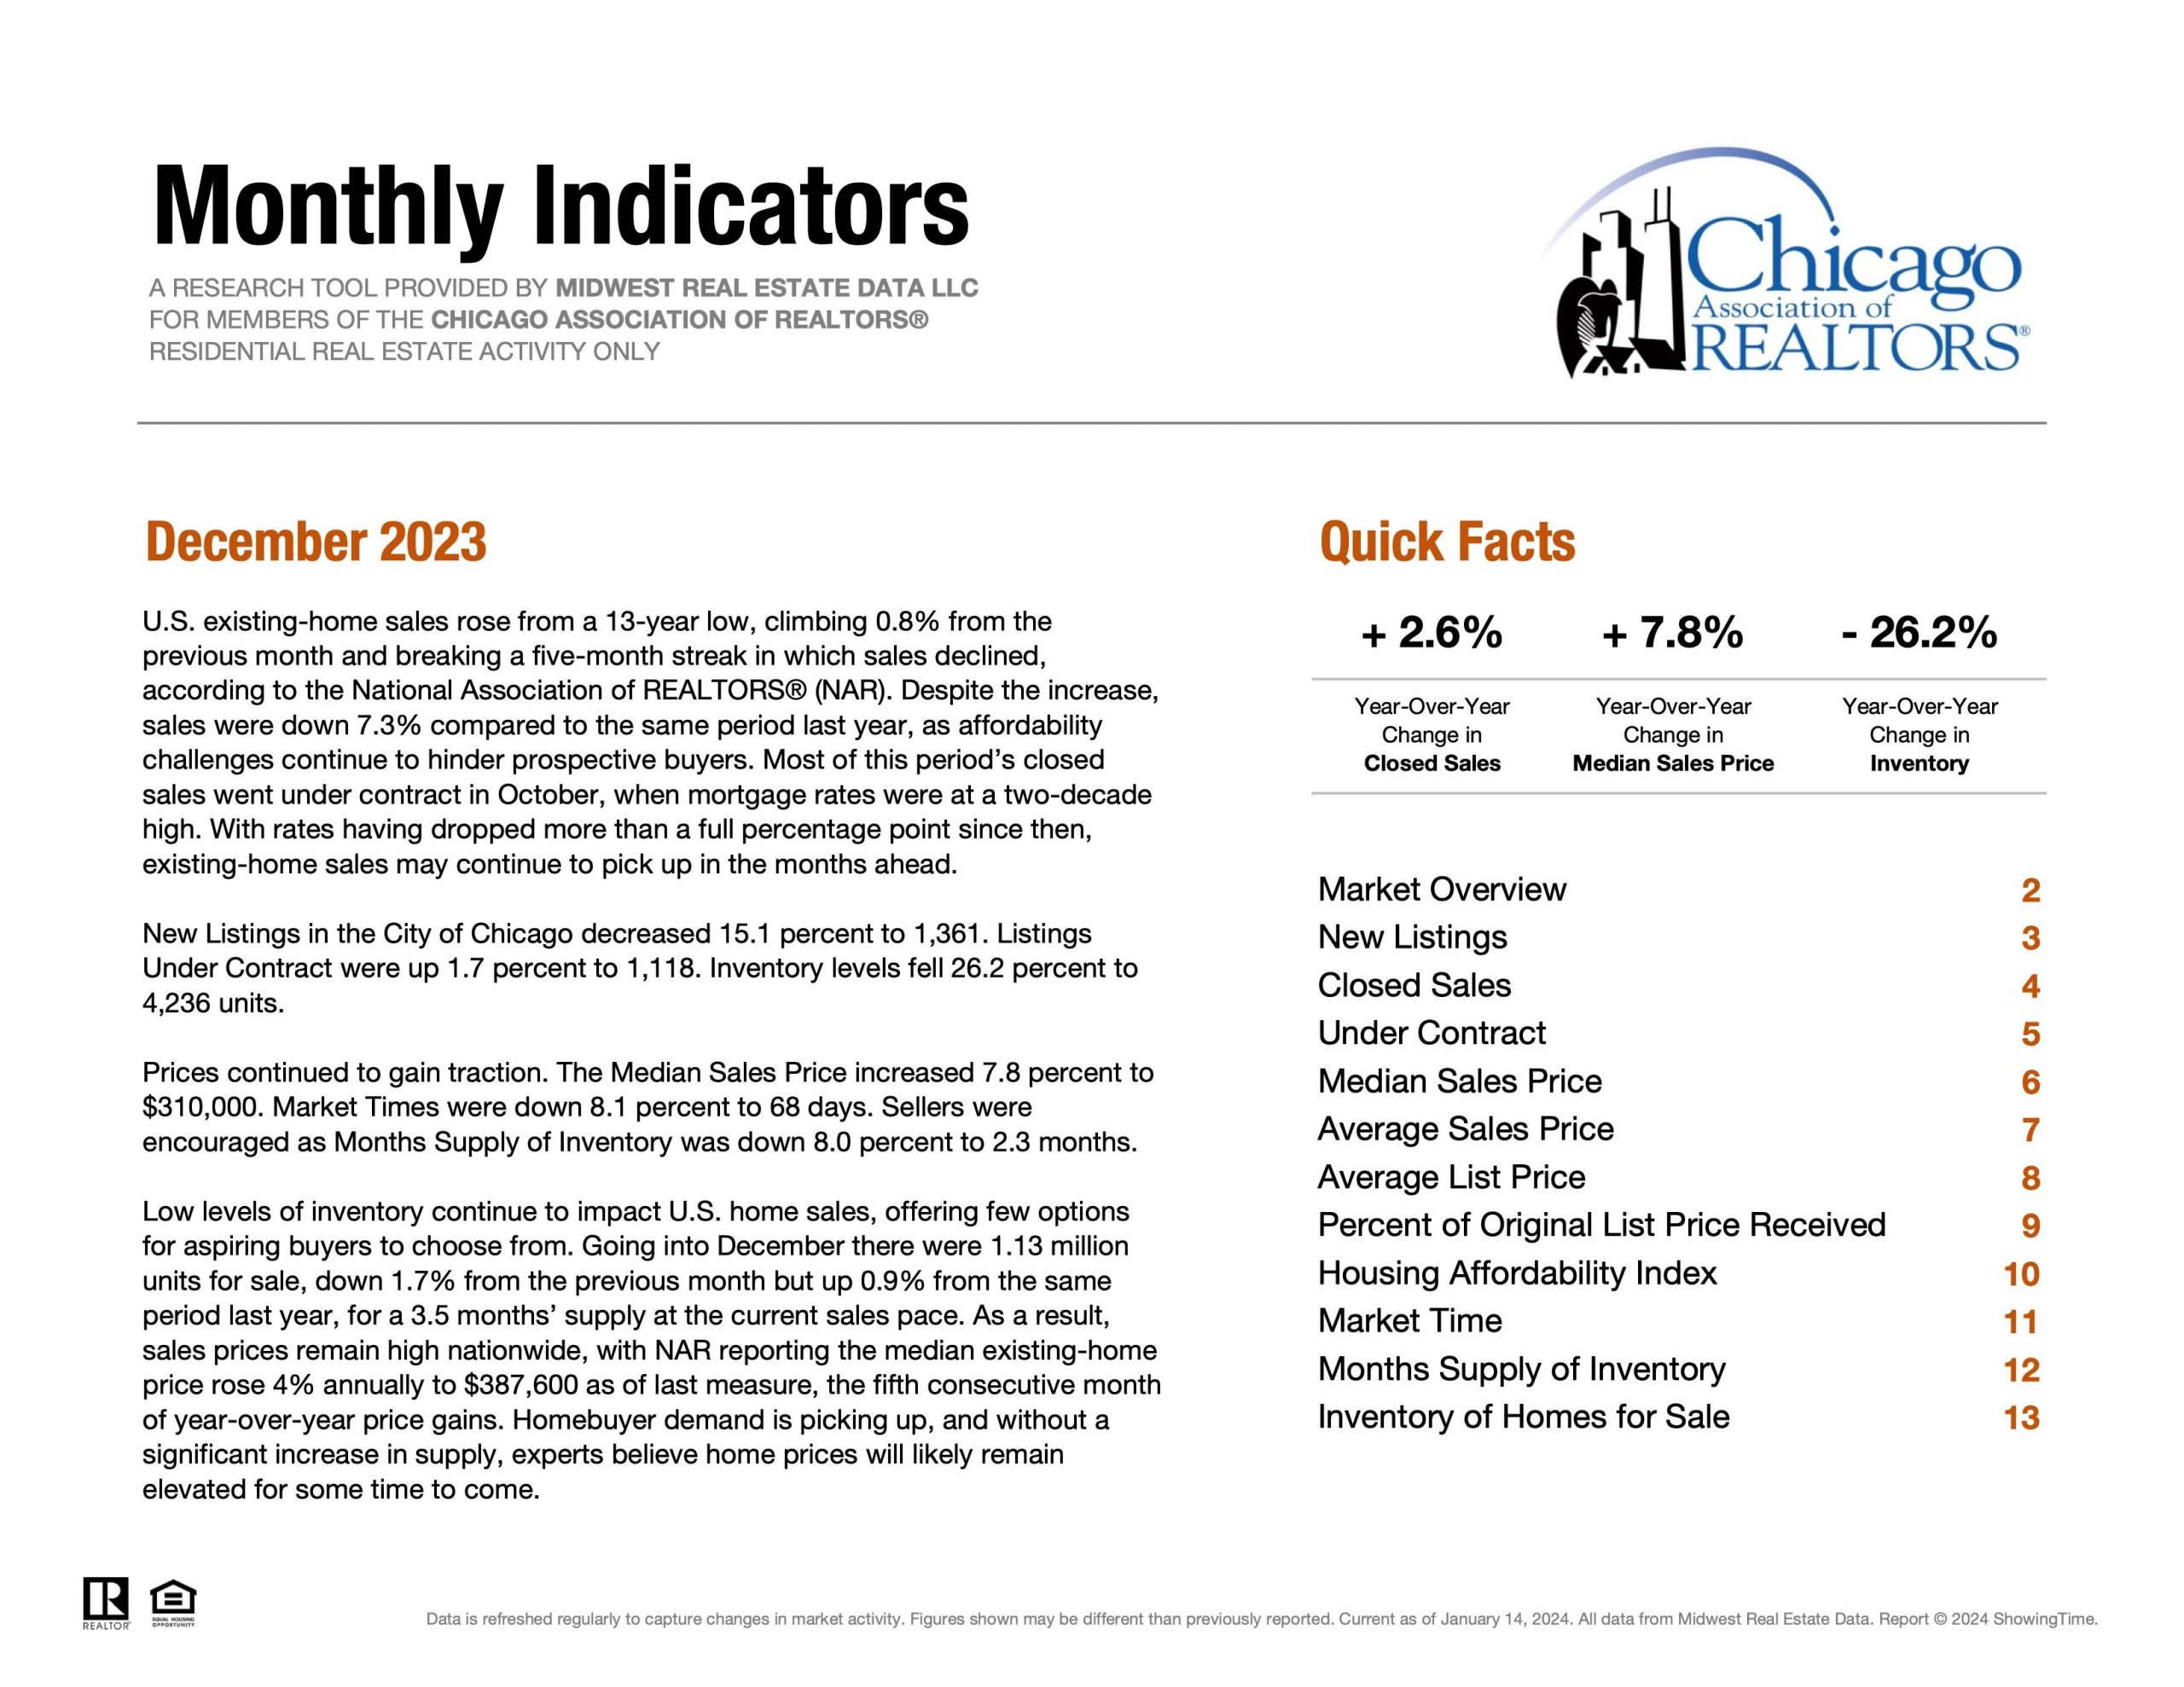
Monthly Indicators December 2023 | Residential Real Estate
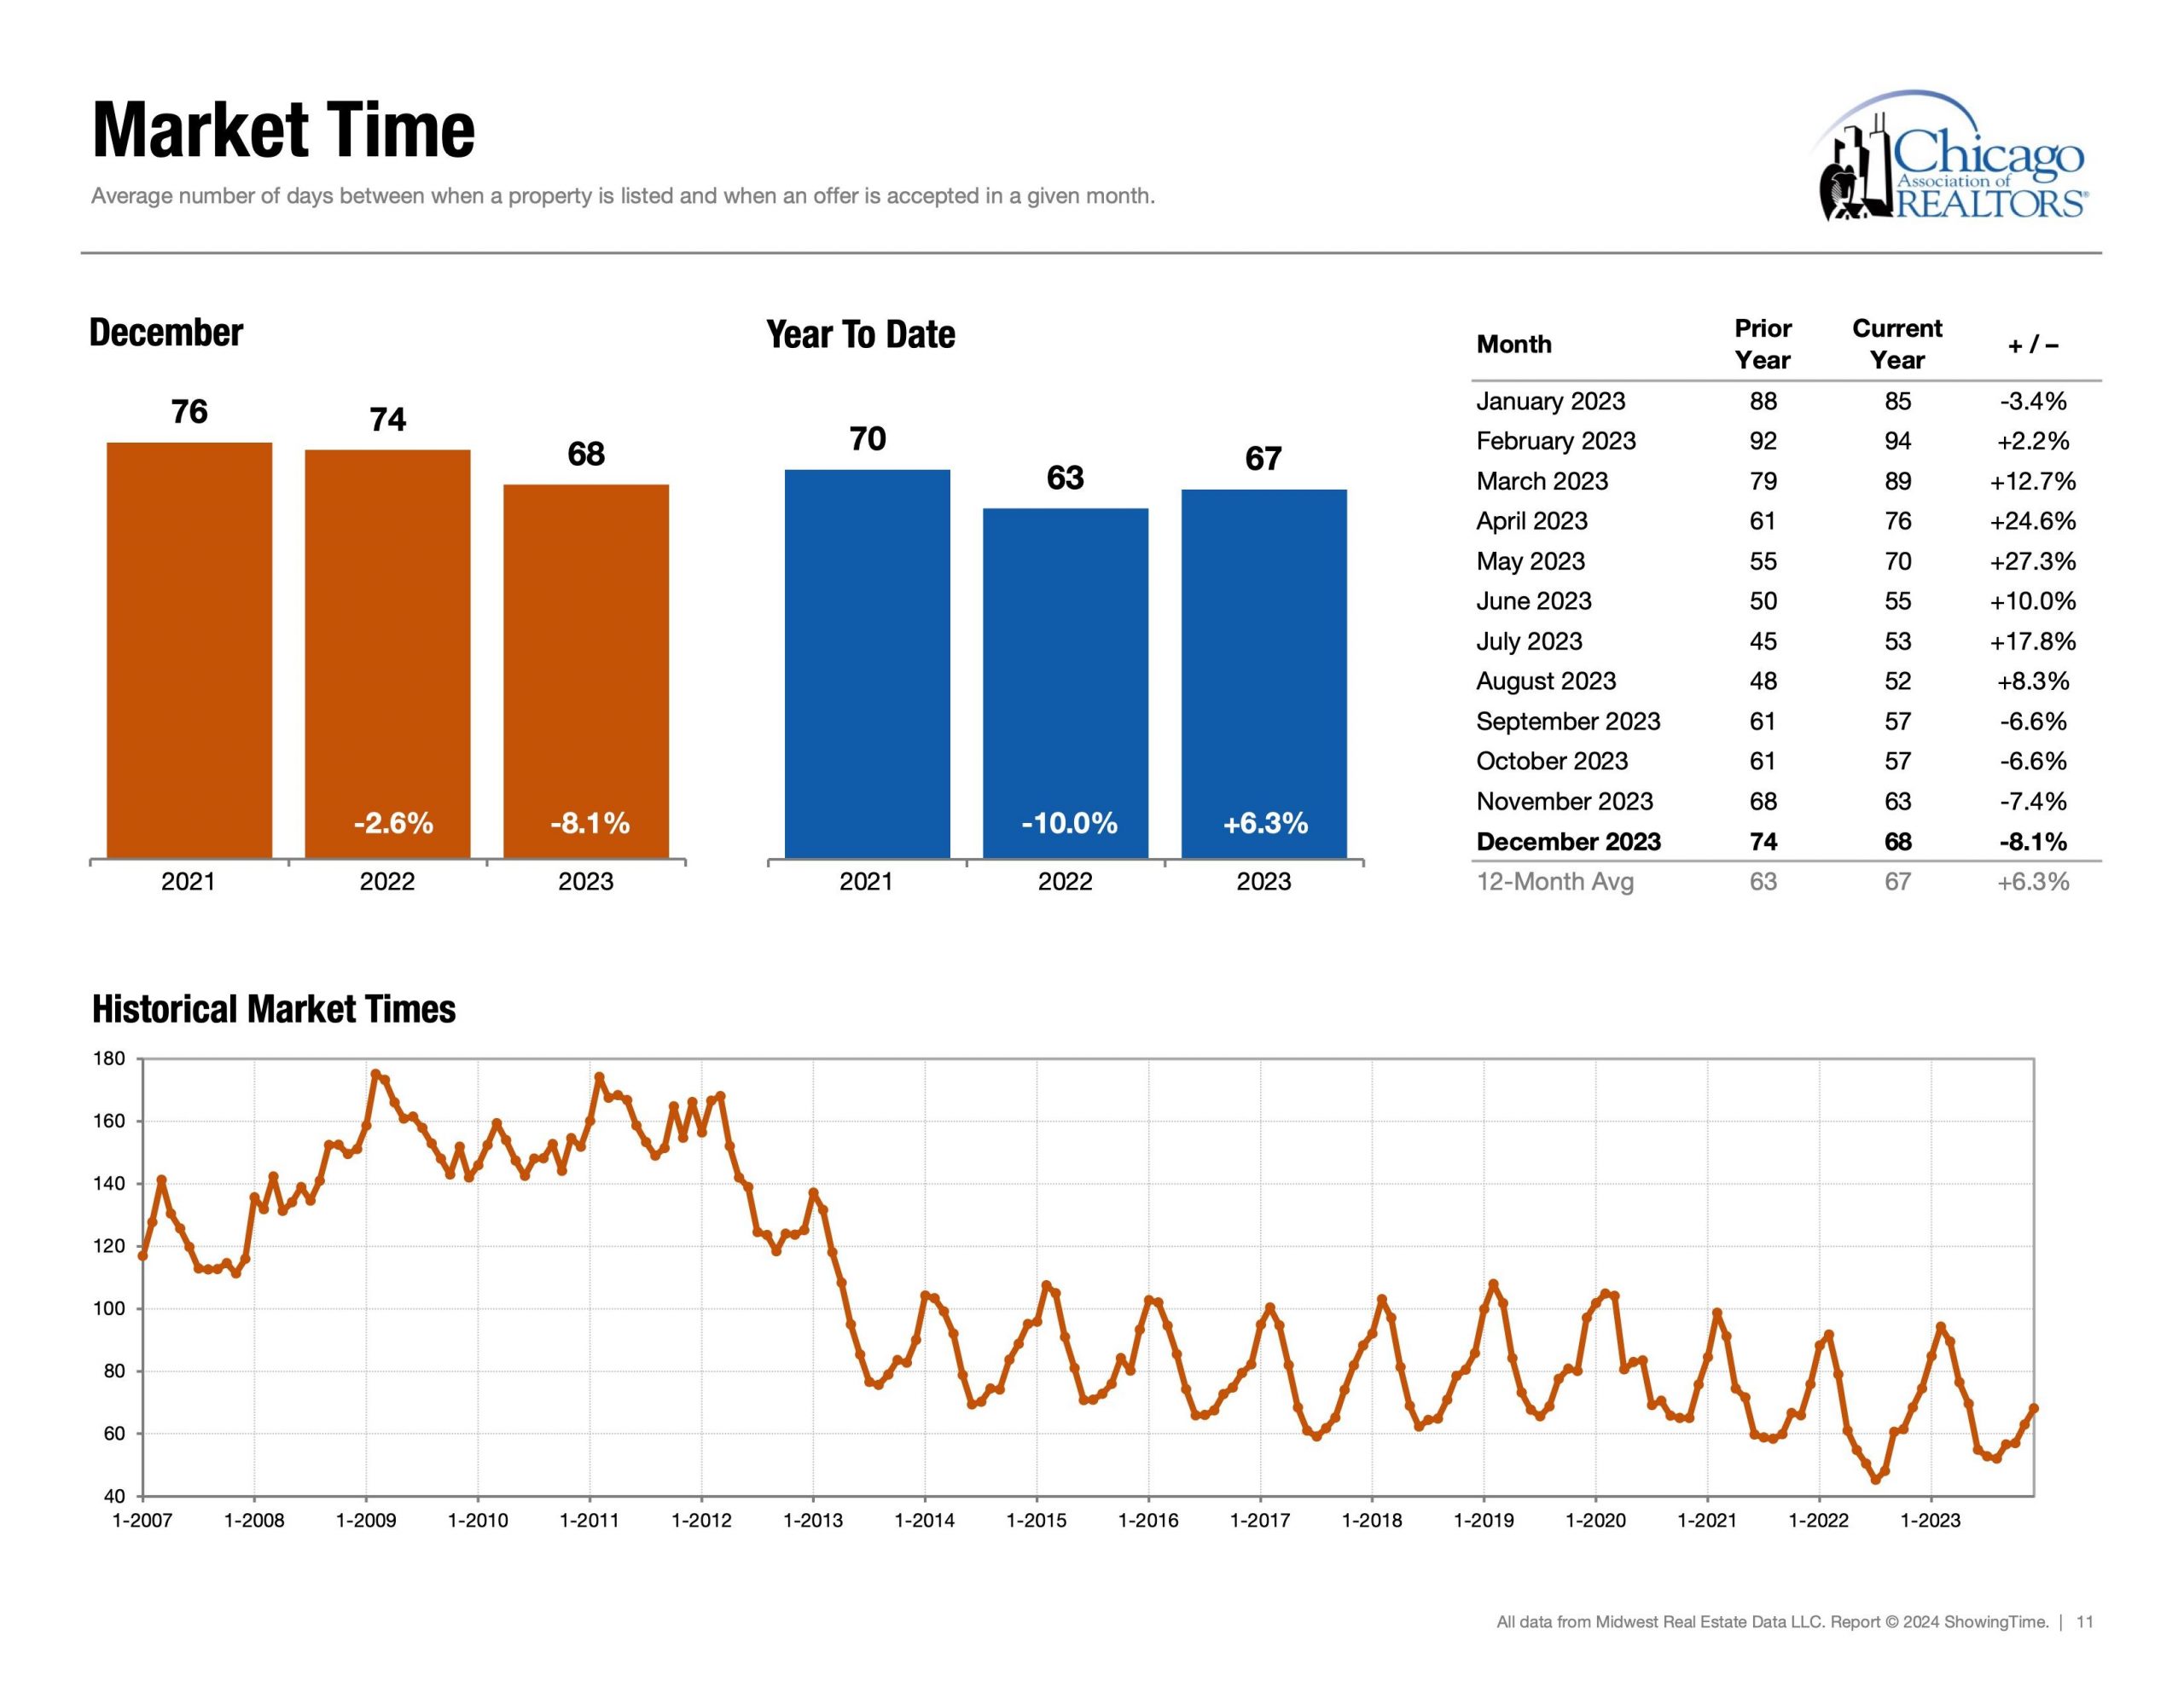
Speed | Healthy Market Time Range:
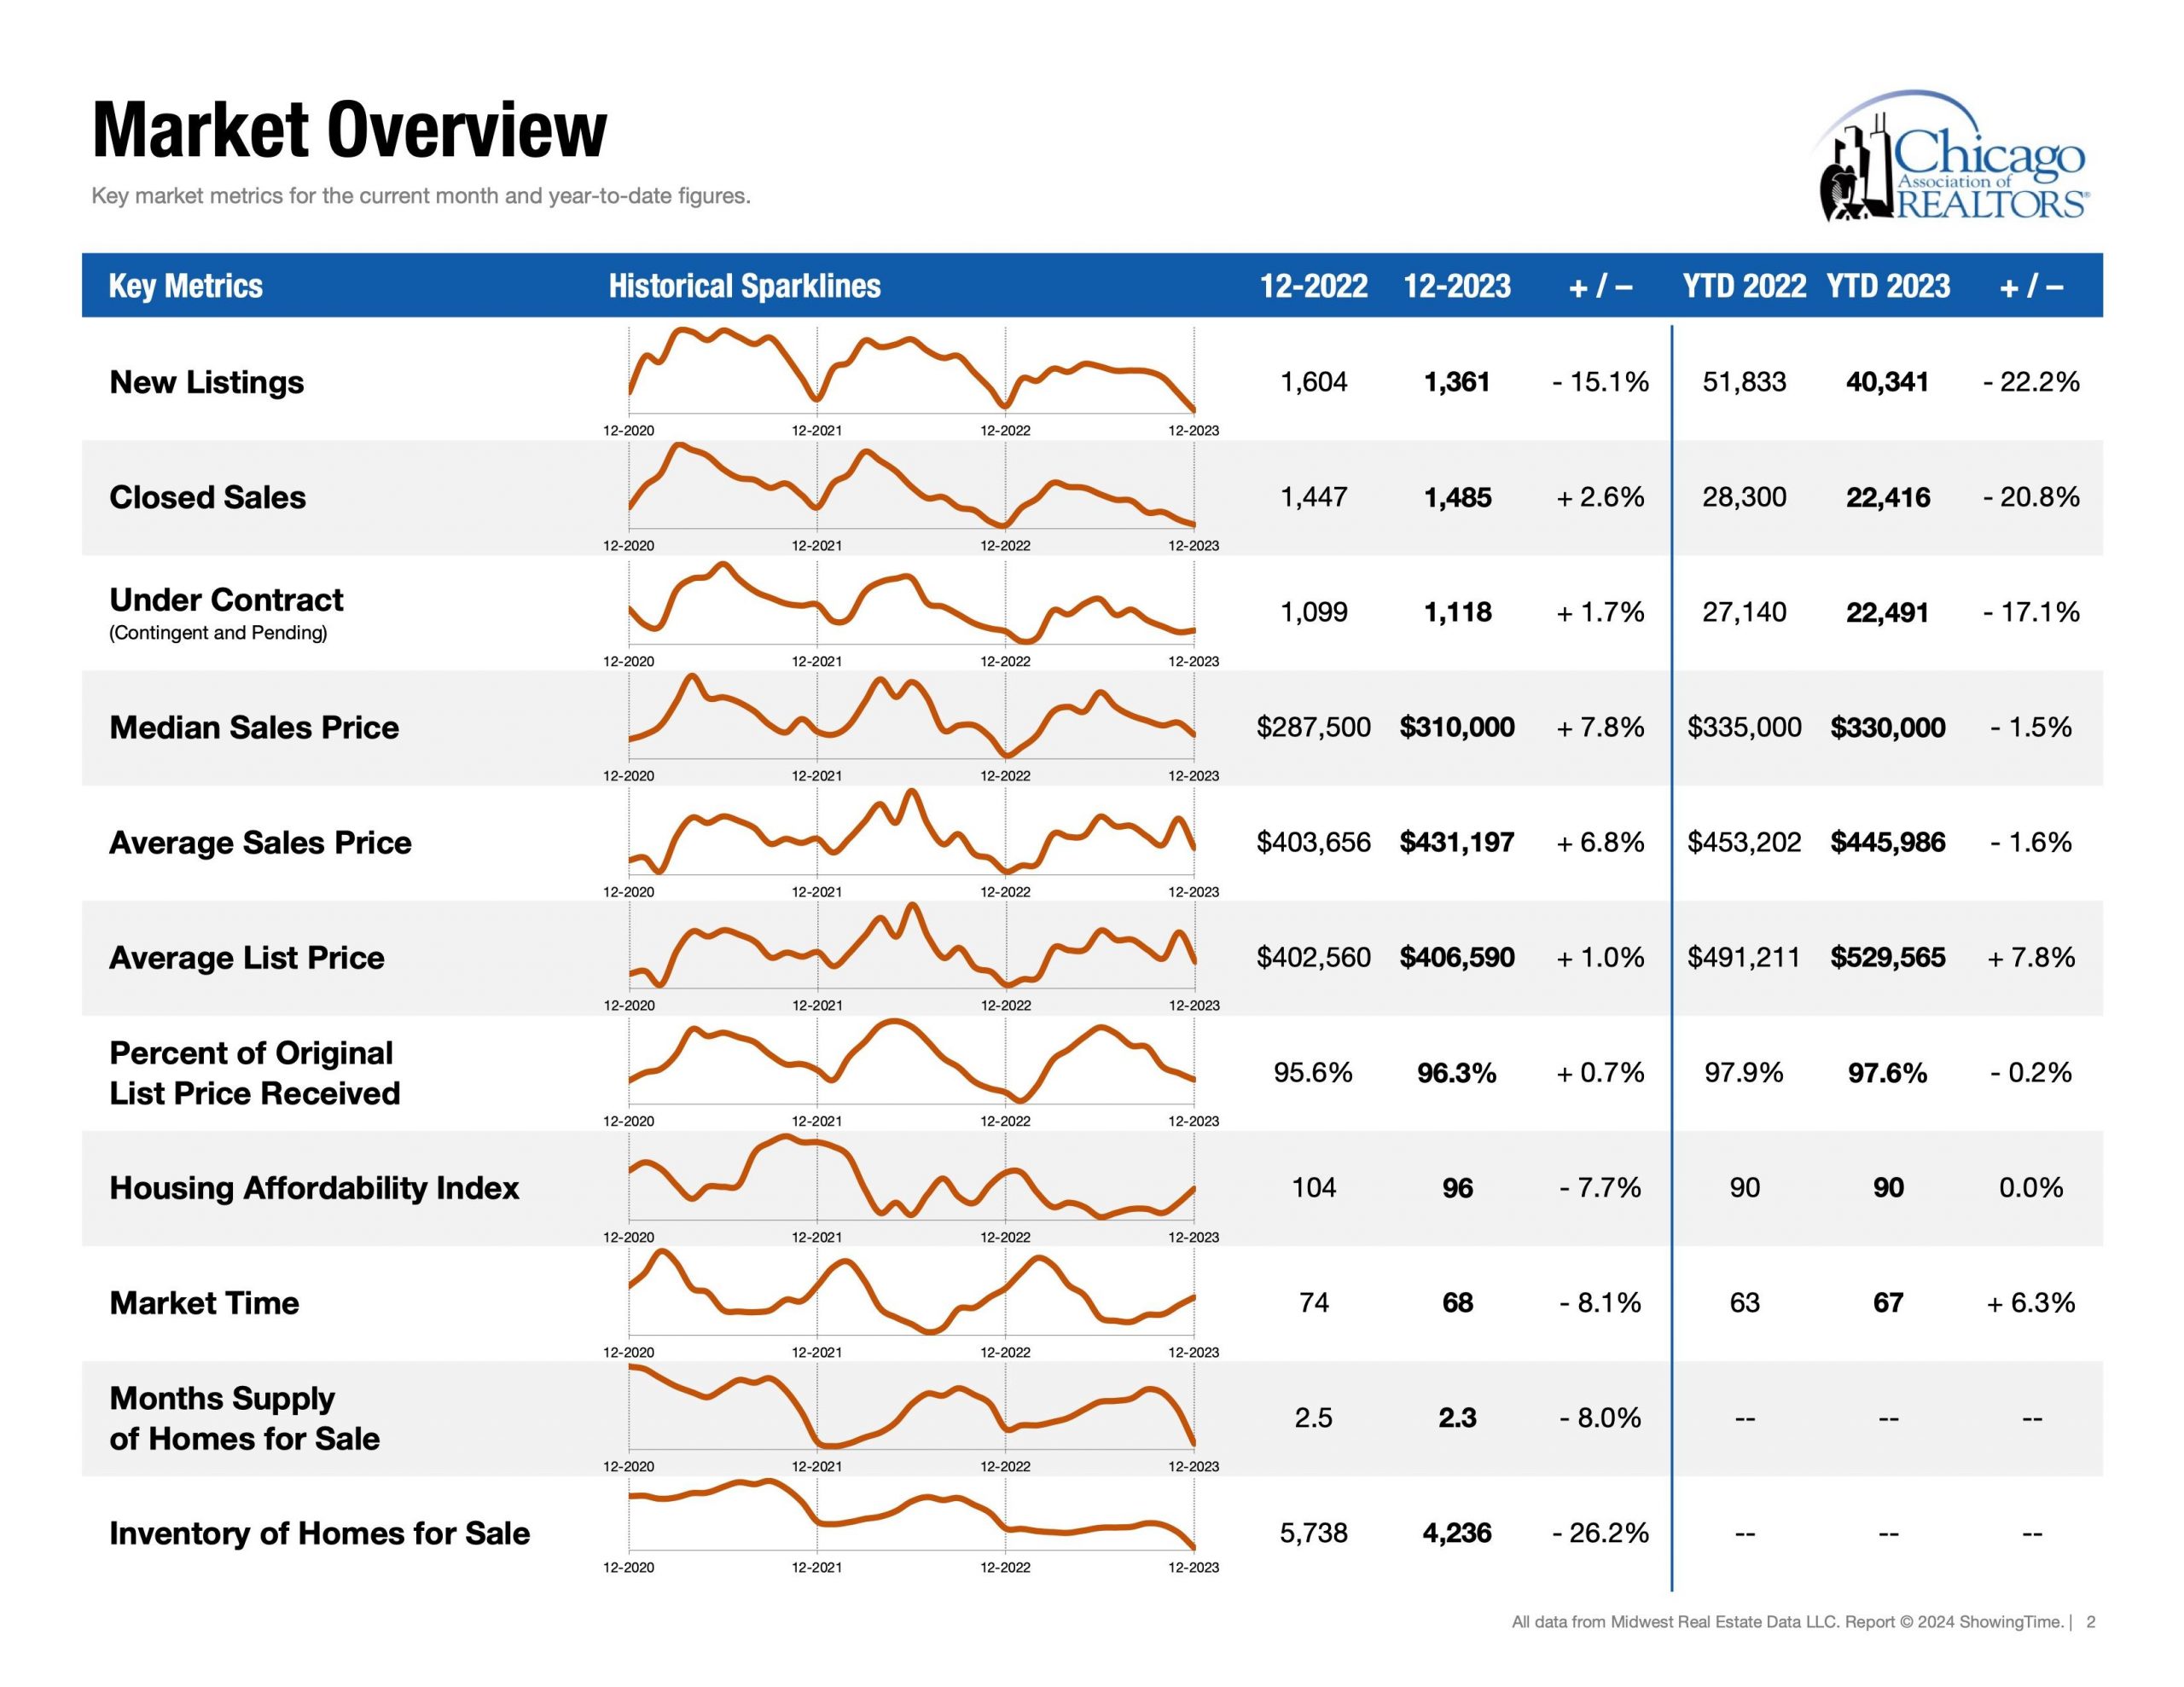
~ 67 days(yearly avg) ~68 Days(month of Dec 23′). If you are a seller and go beyond average market time you are either: 1) an outlier (ie. a distressed or luxury property) or 2) overpriced. Evidently, if the property was worth the list price, “Why have showings decreased on a listing?” additionally, “Why has the listing, not received any offers?” It is not a lack of creativity or a lack of effort or even a lack of knowledge on the real estate partitioners’ part. It’s because the market has spoken in loud silence. They have seen our listing and have said, “No thank you.” We need showings to get a contract.
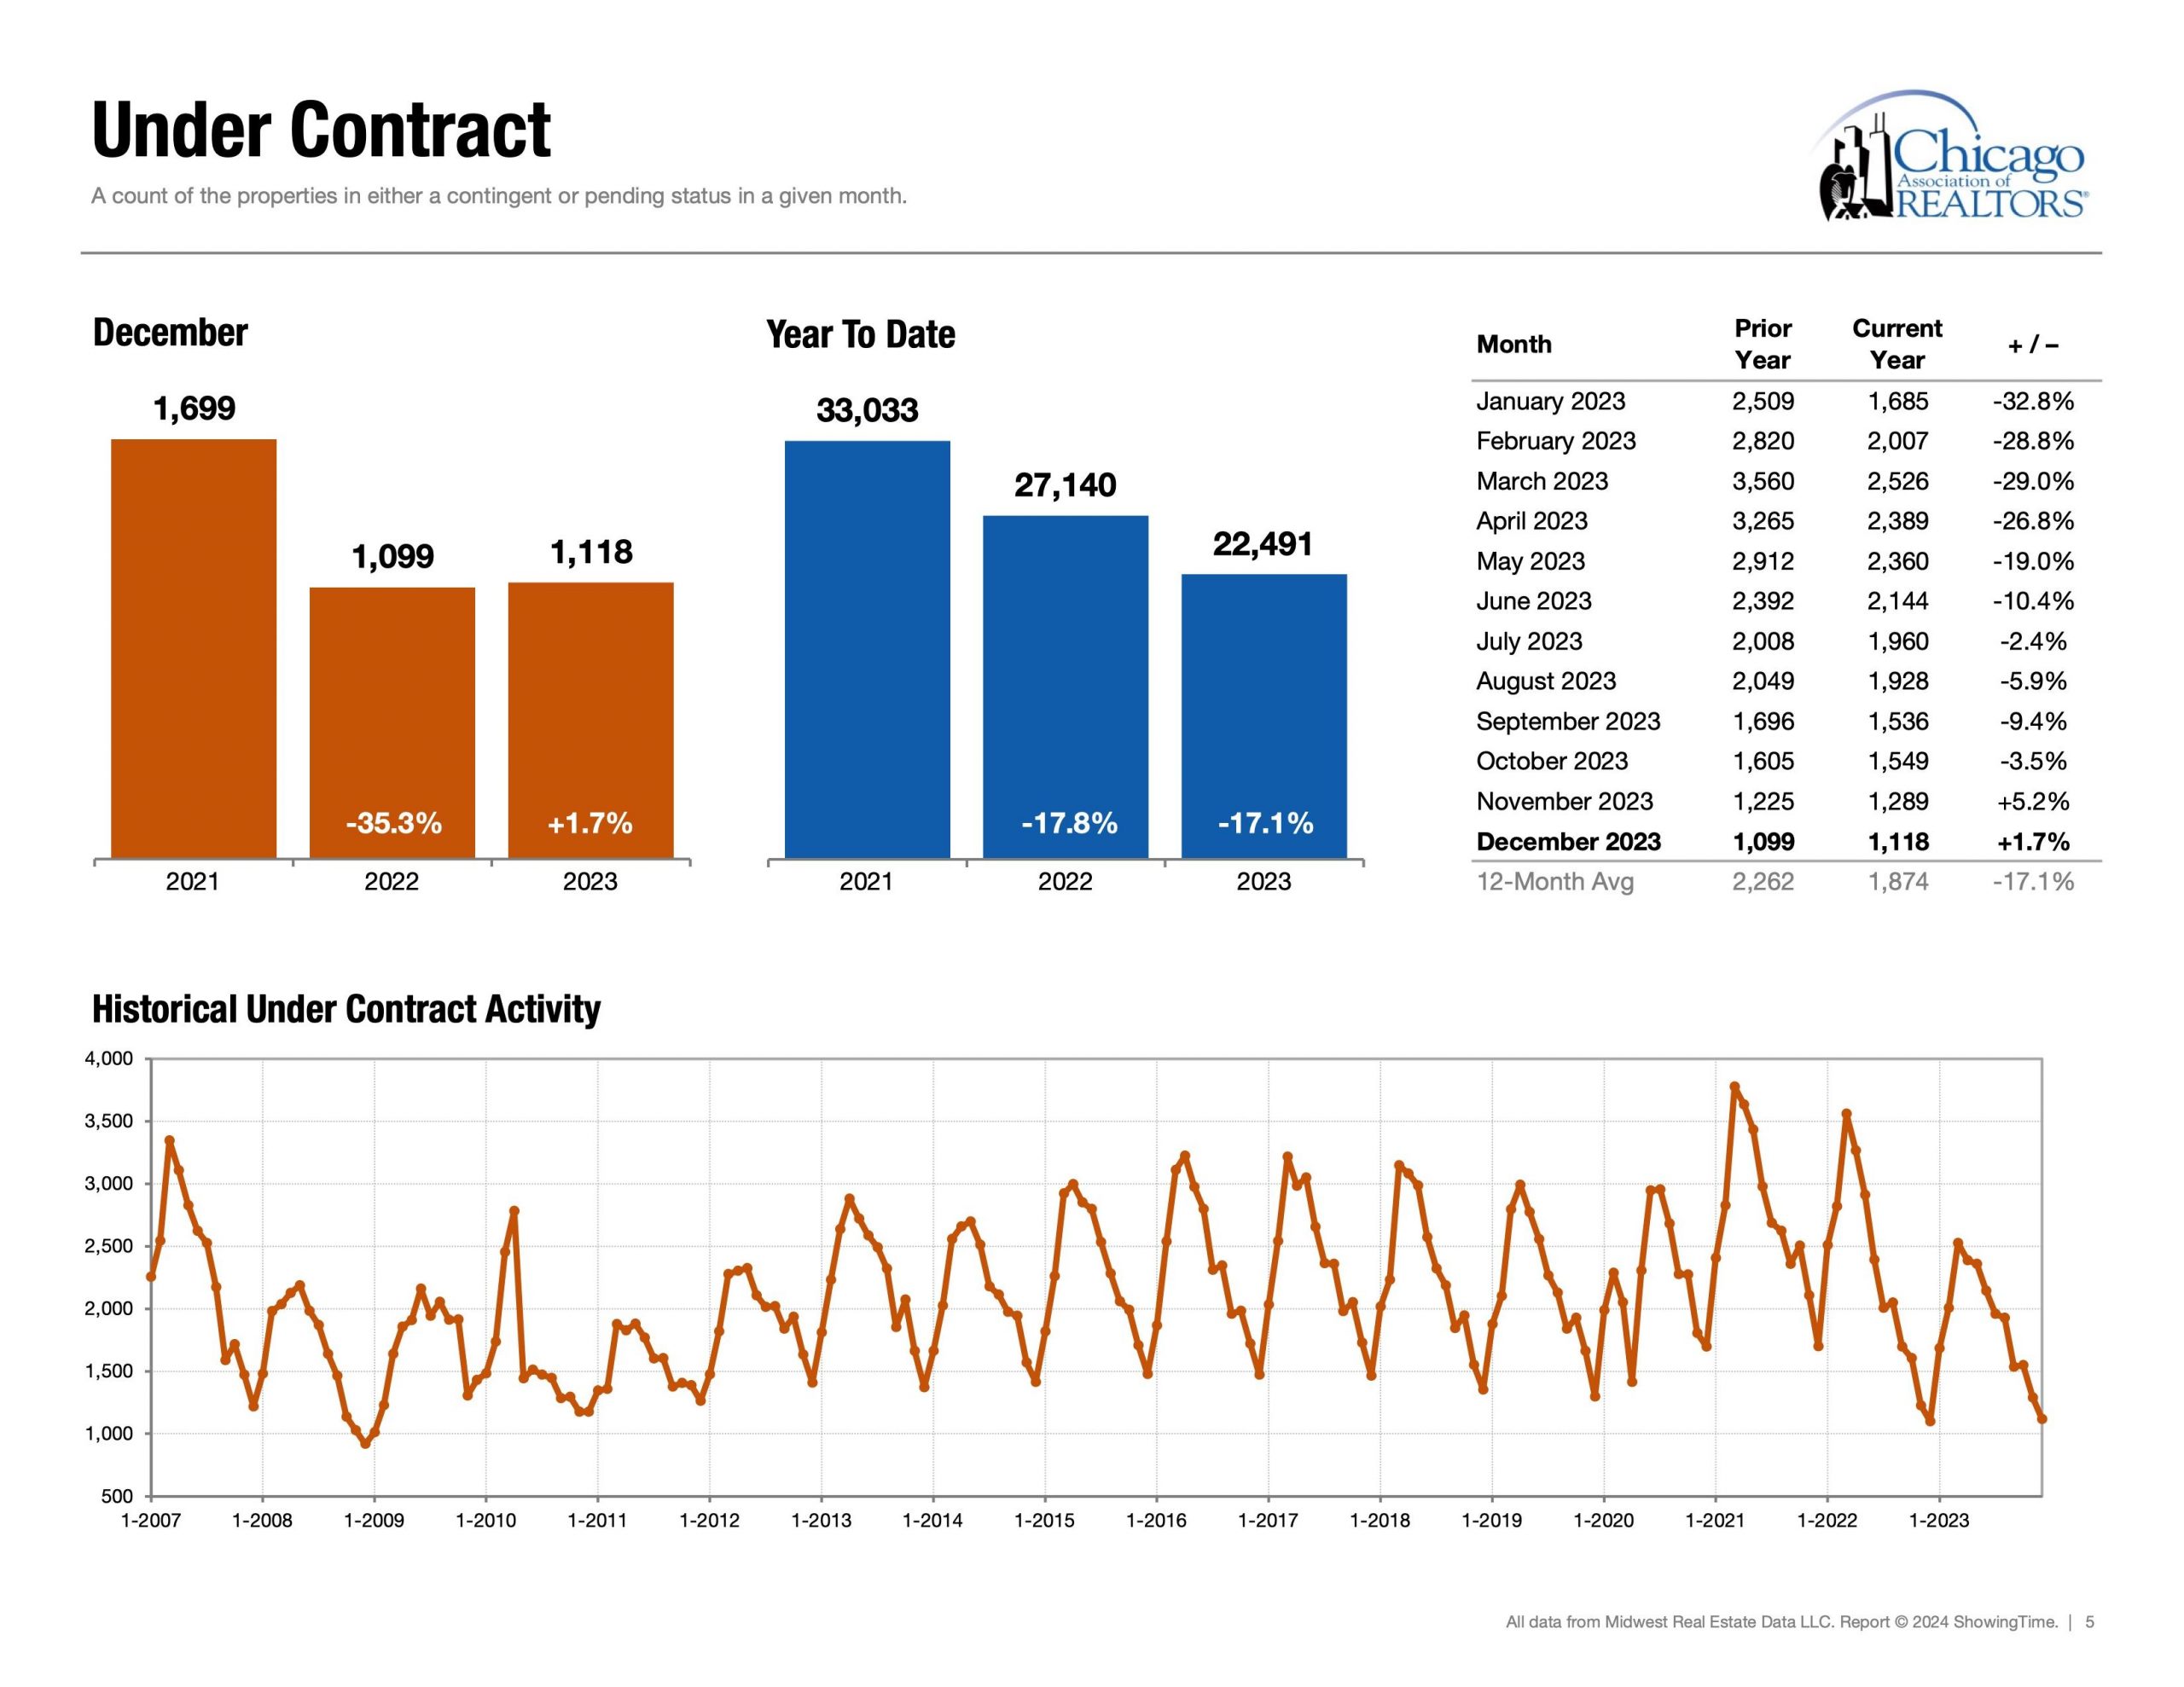
Demand | Under Contract:
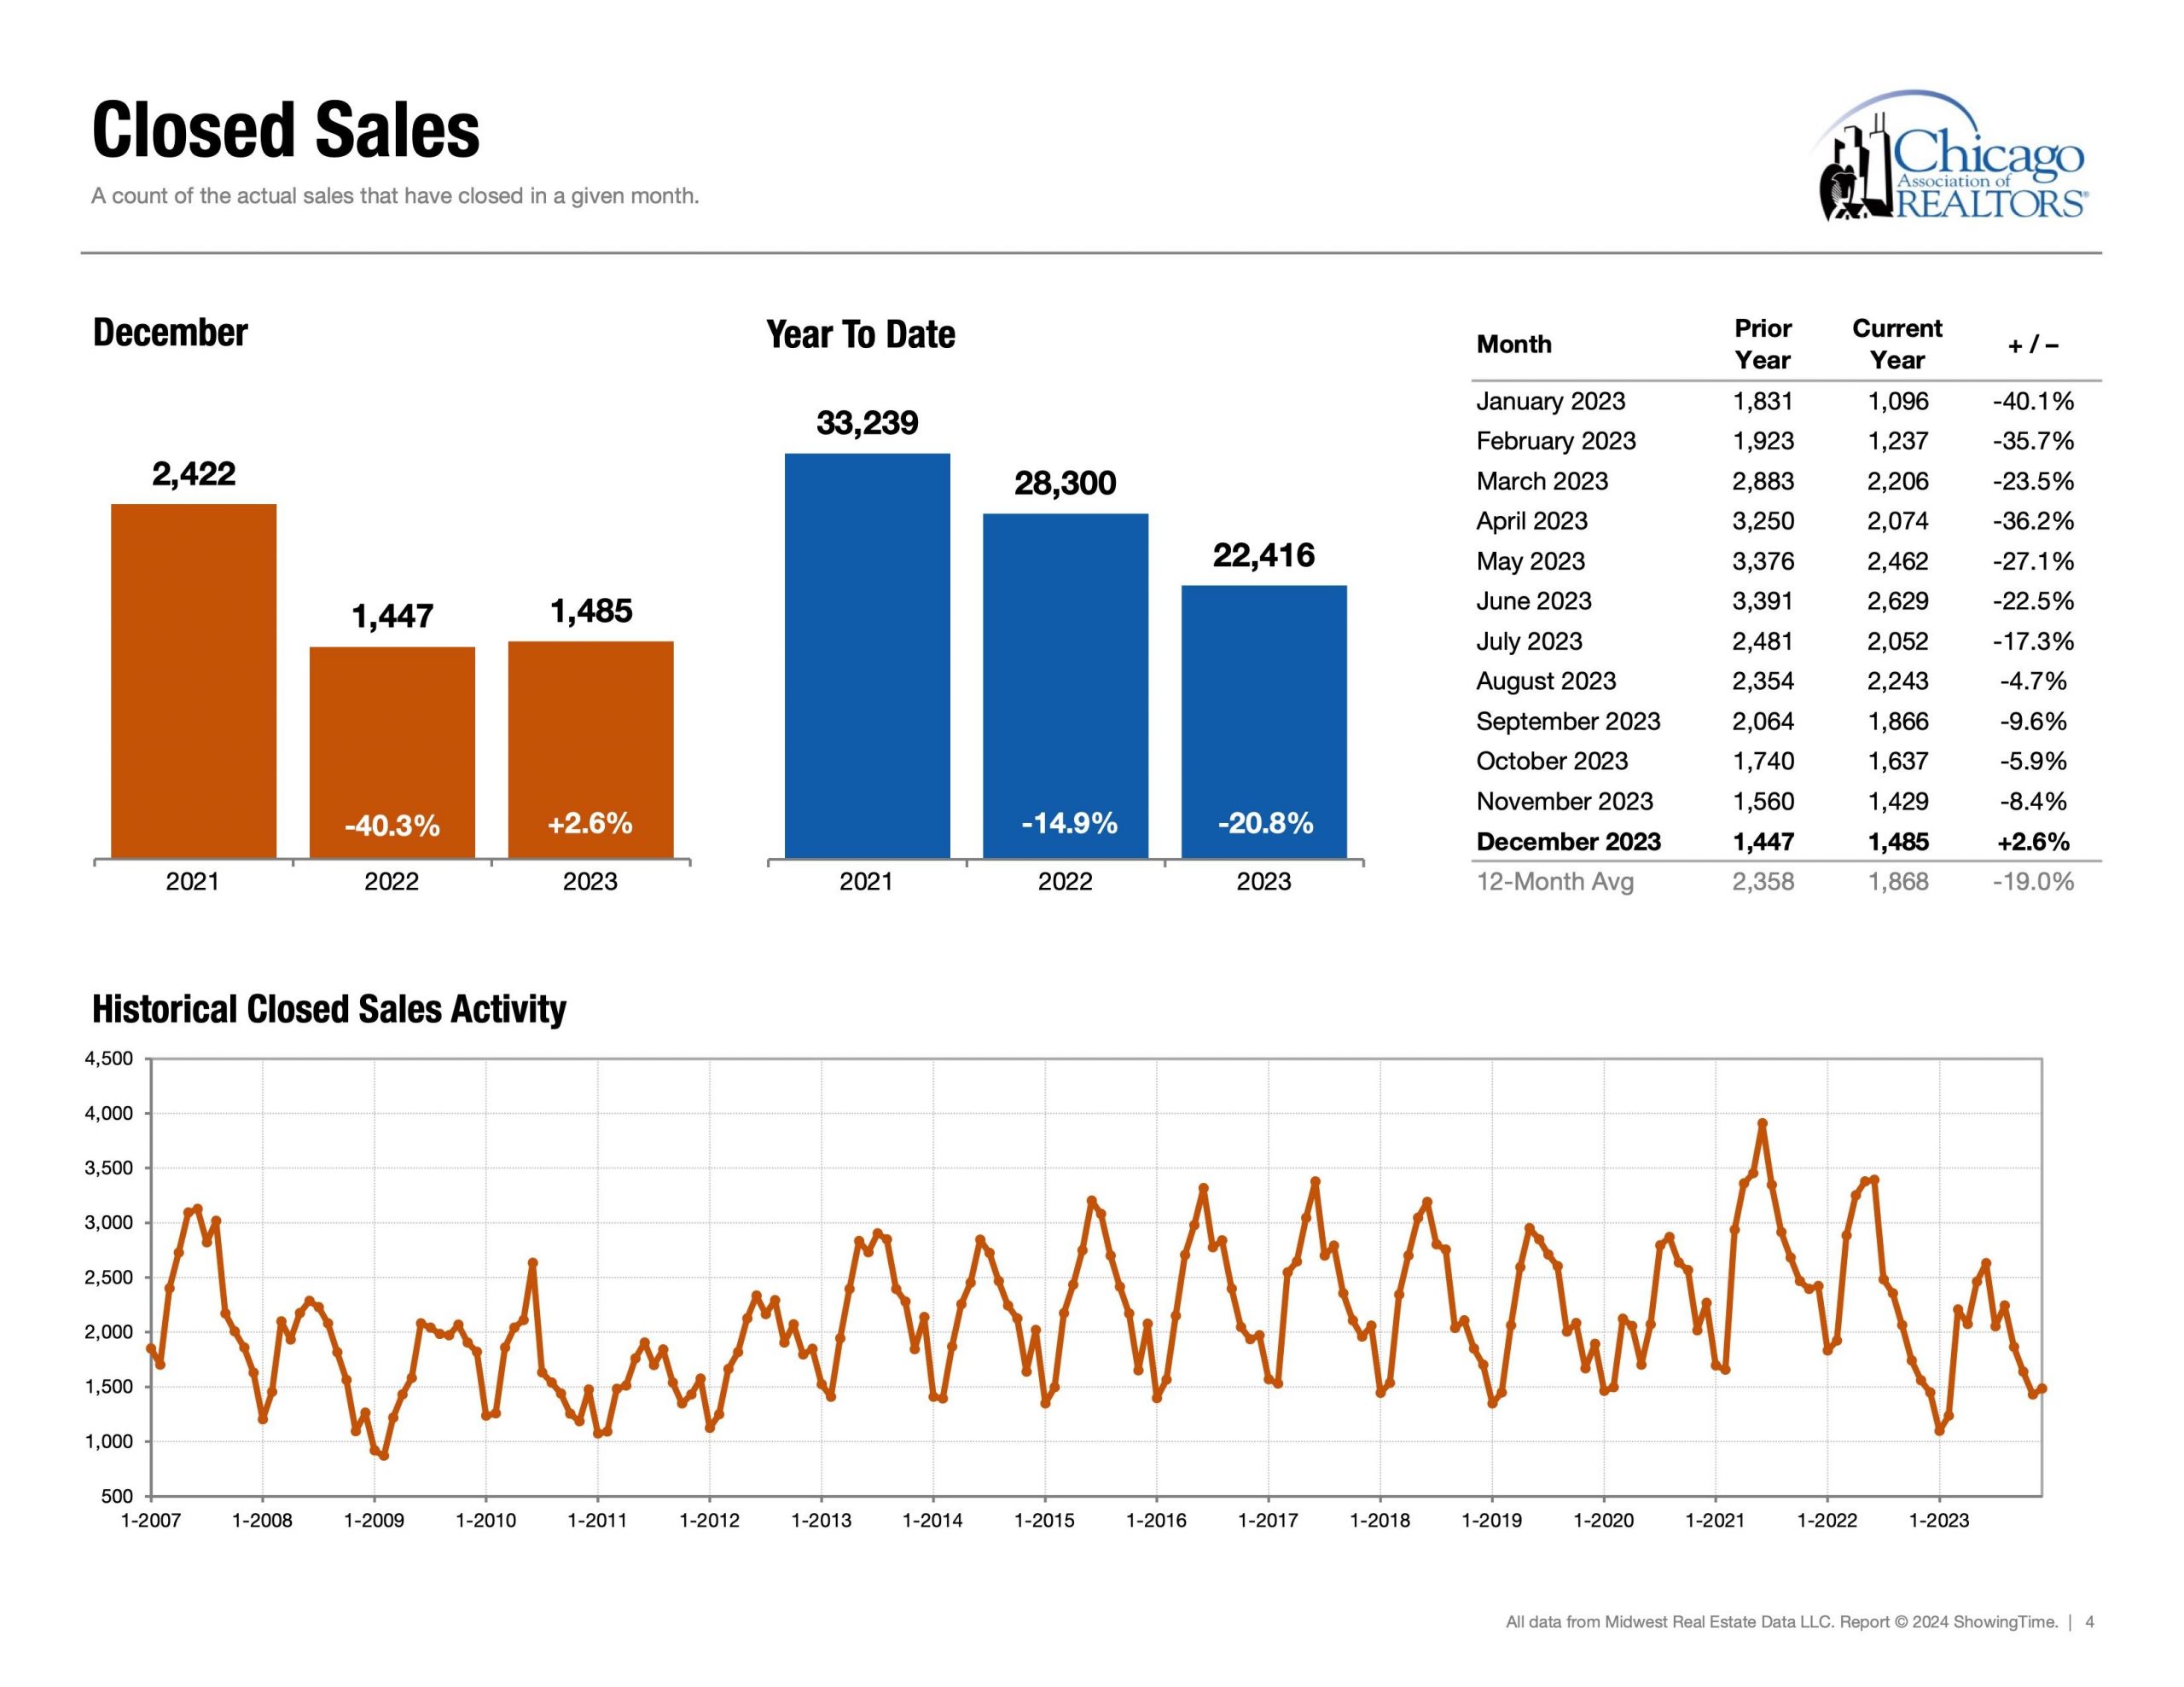
1,118 properties (Dec 2023) Under Contract showcases demand helps explain, “How many buyers are buying?” Another example is, under contract is the heartbeat of the real estate market. With this in mind comparing the month of Dec 22 vs Dec 23: Buying Demand has increase +1.7% (see Under Contract Chart below) Next up is supply because demand metrics become insightful when compared in contrast with supply/inventory metrics.
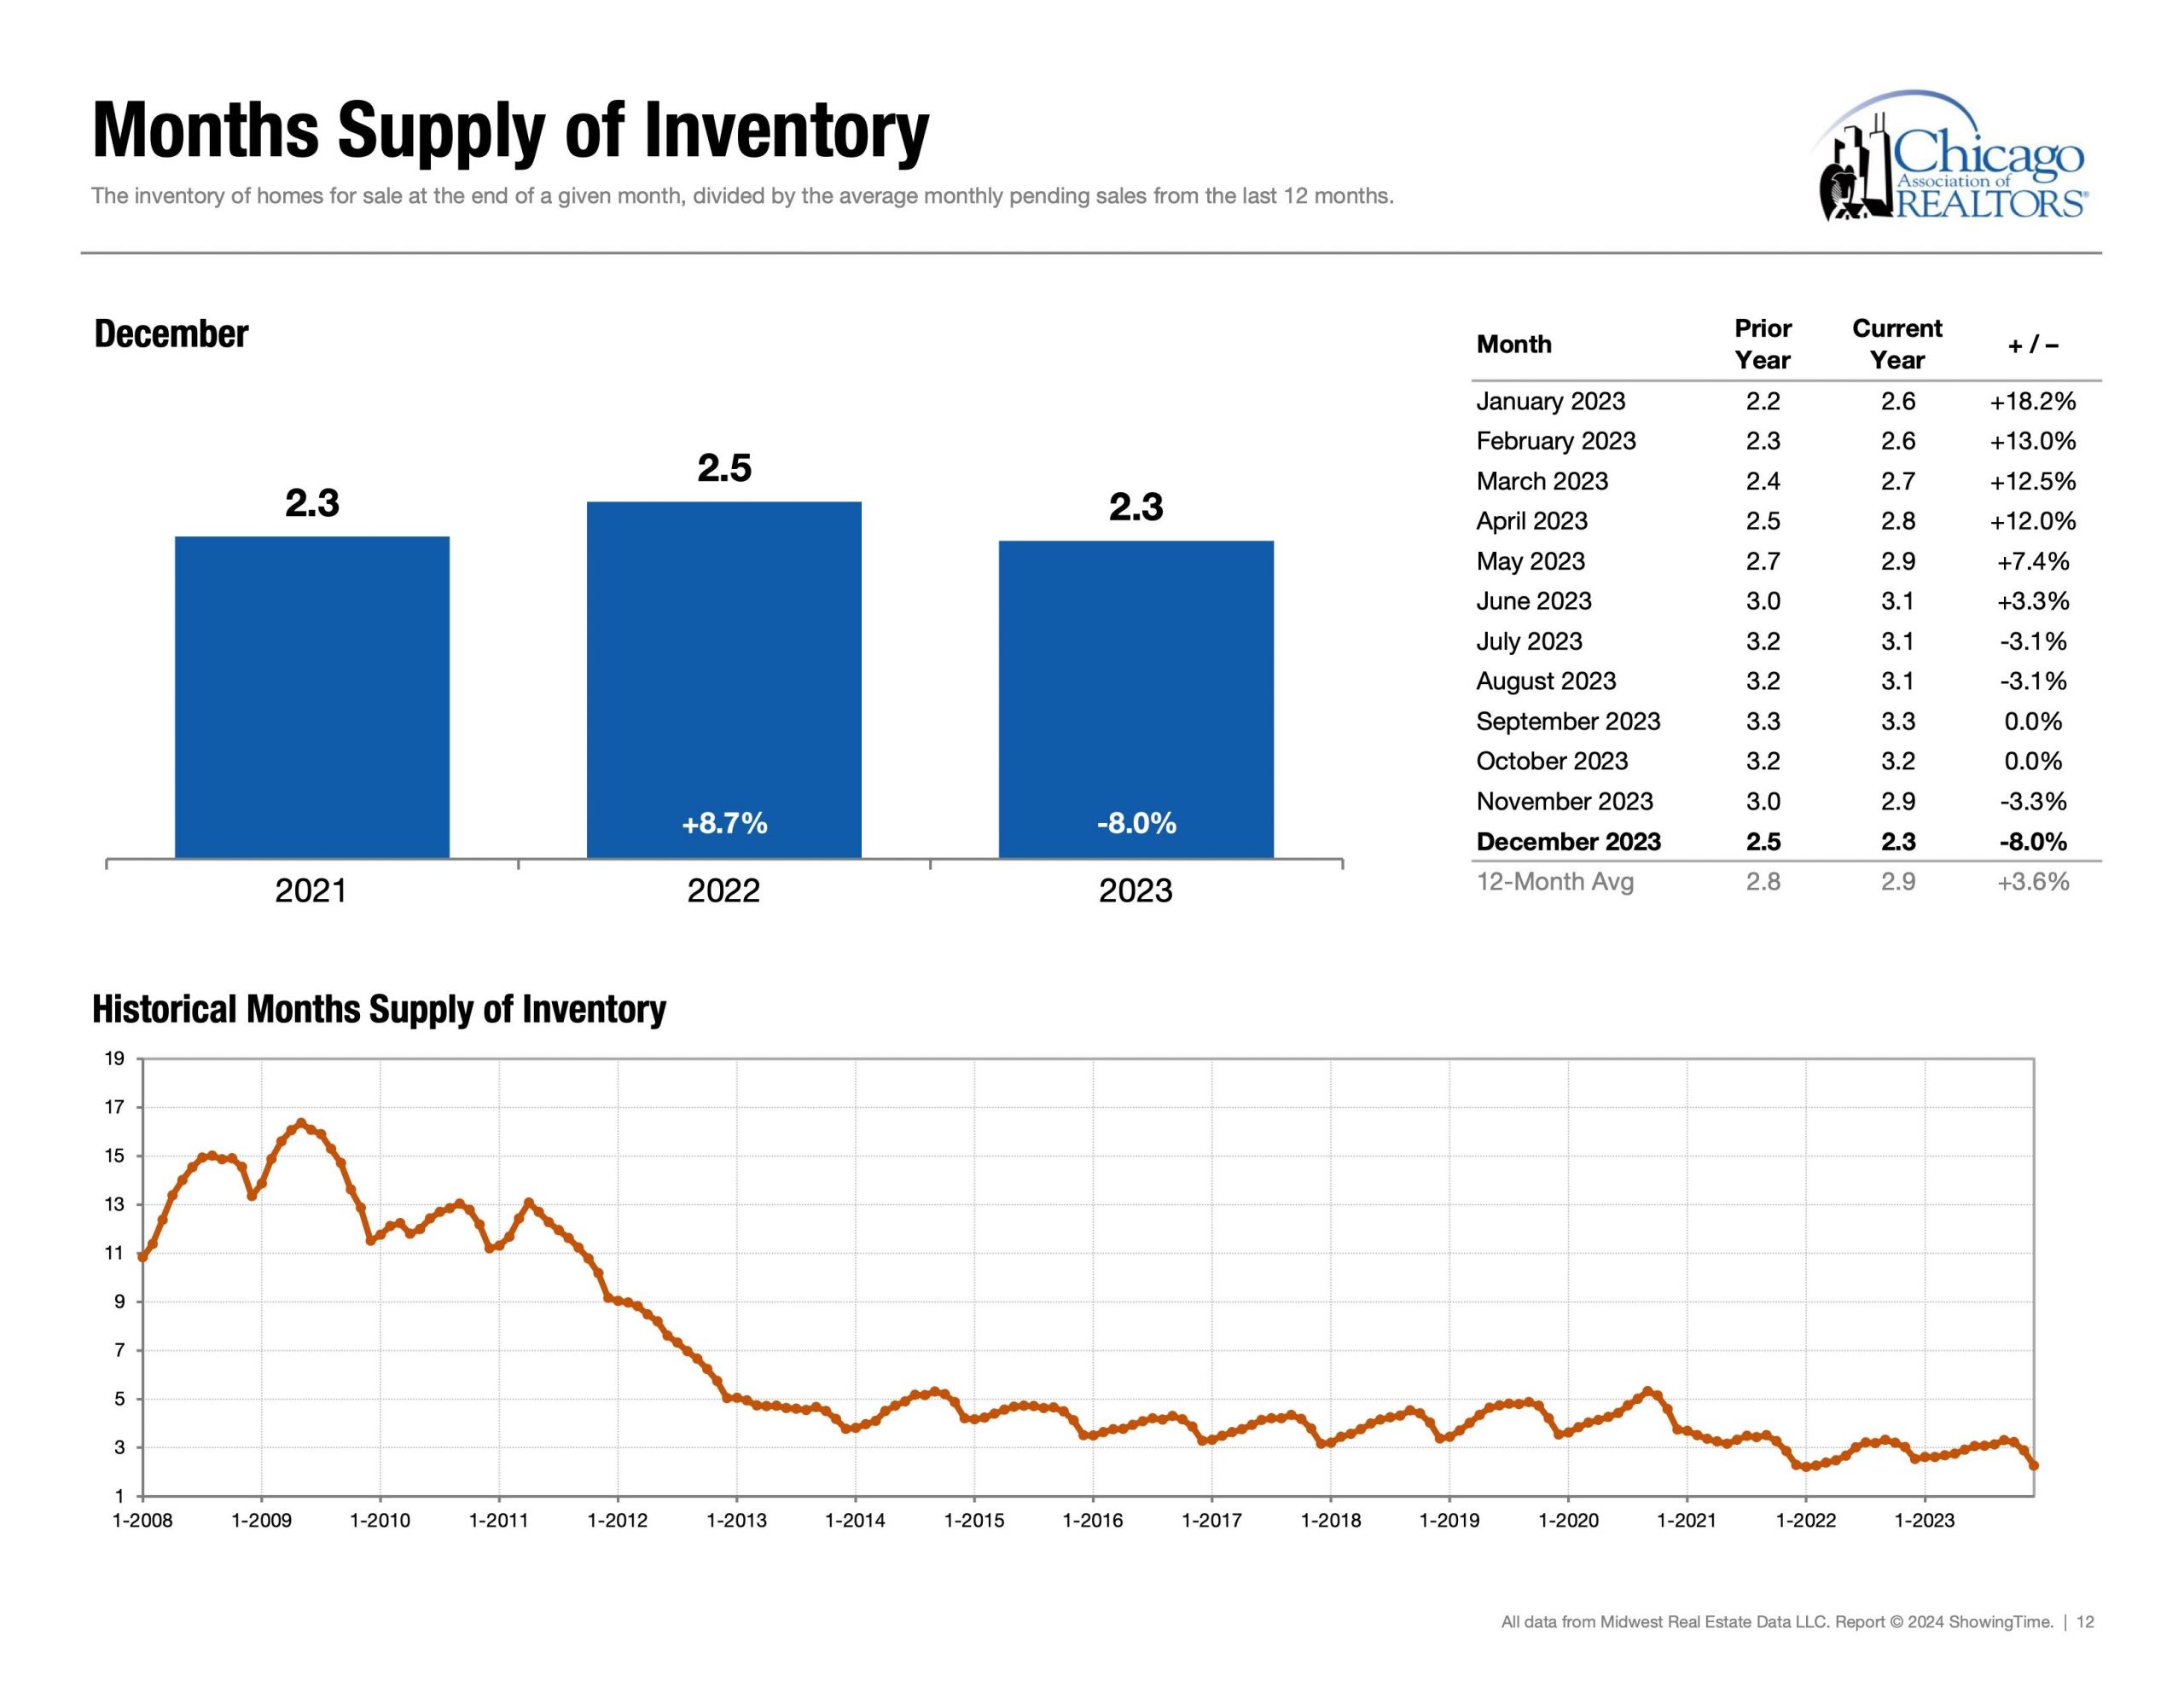
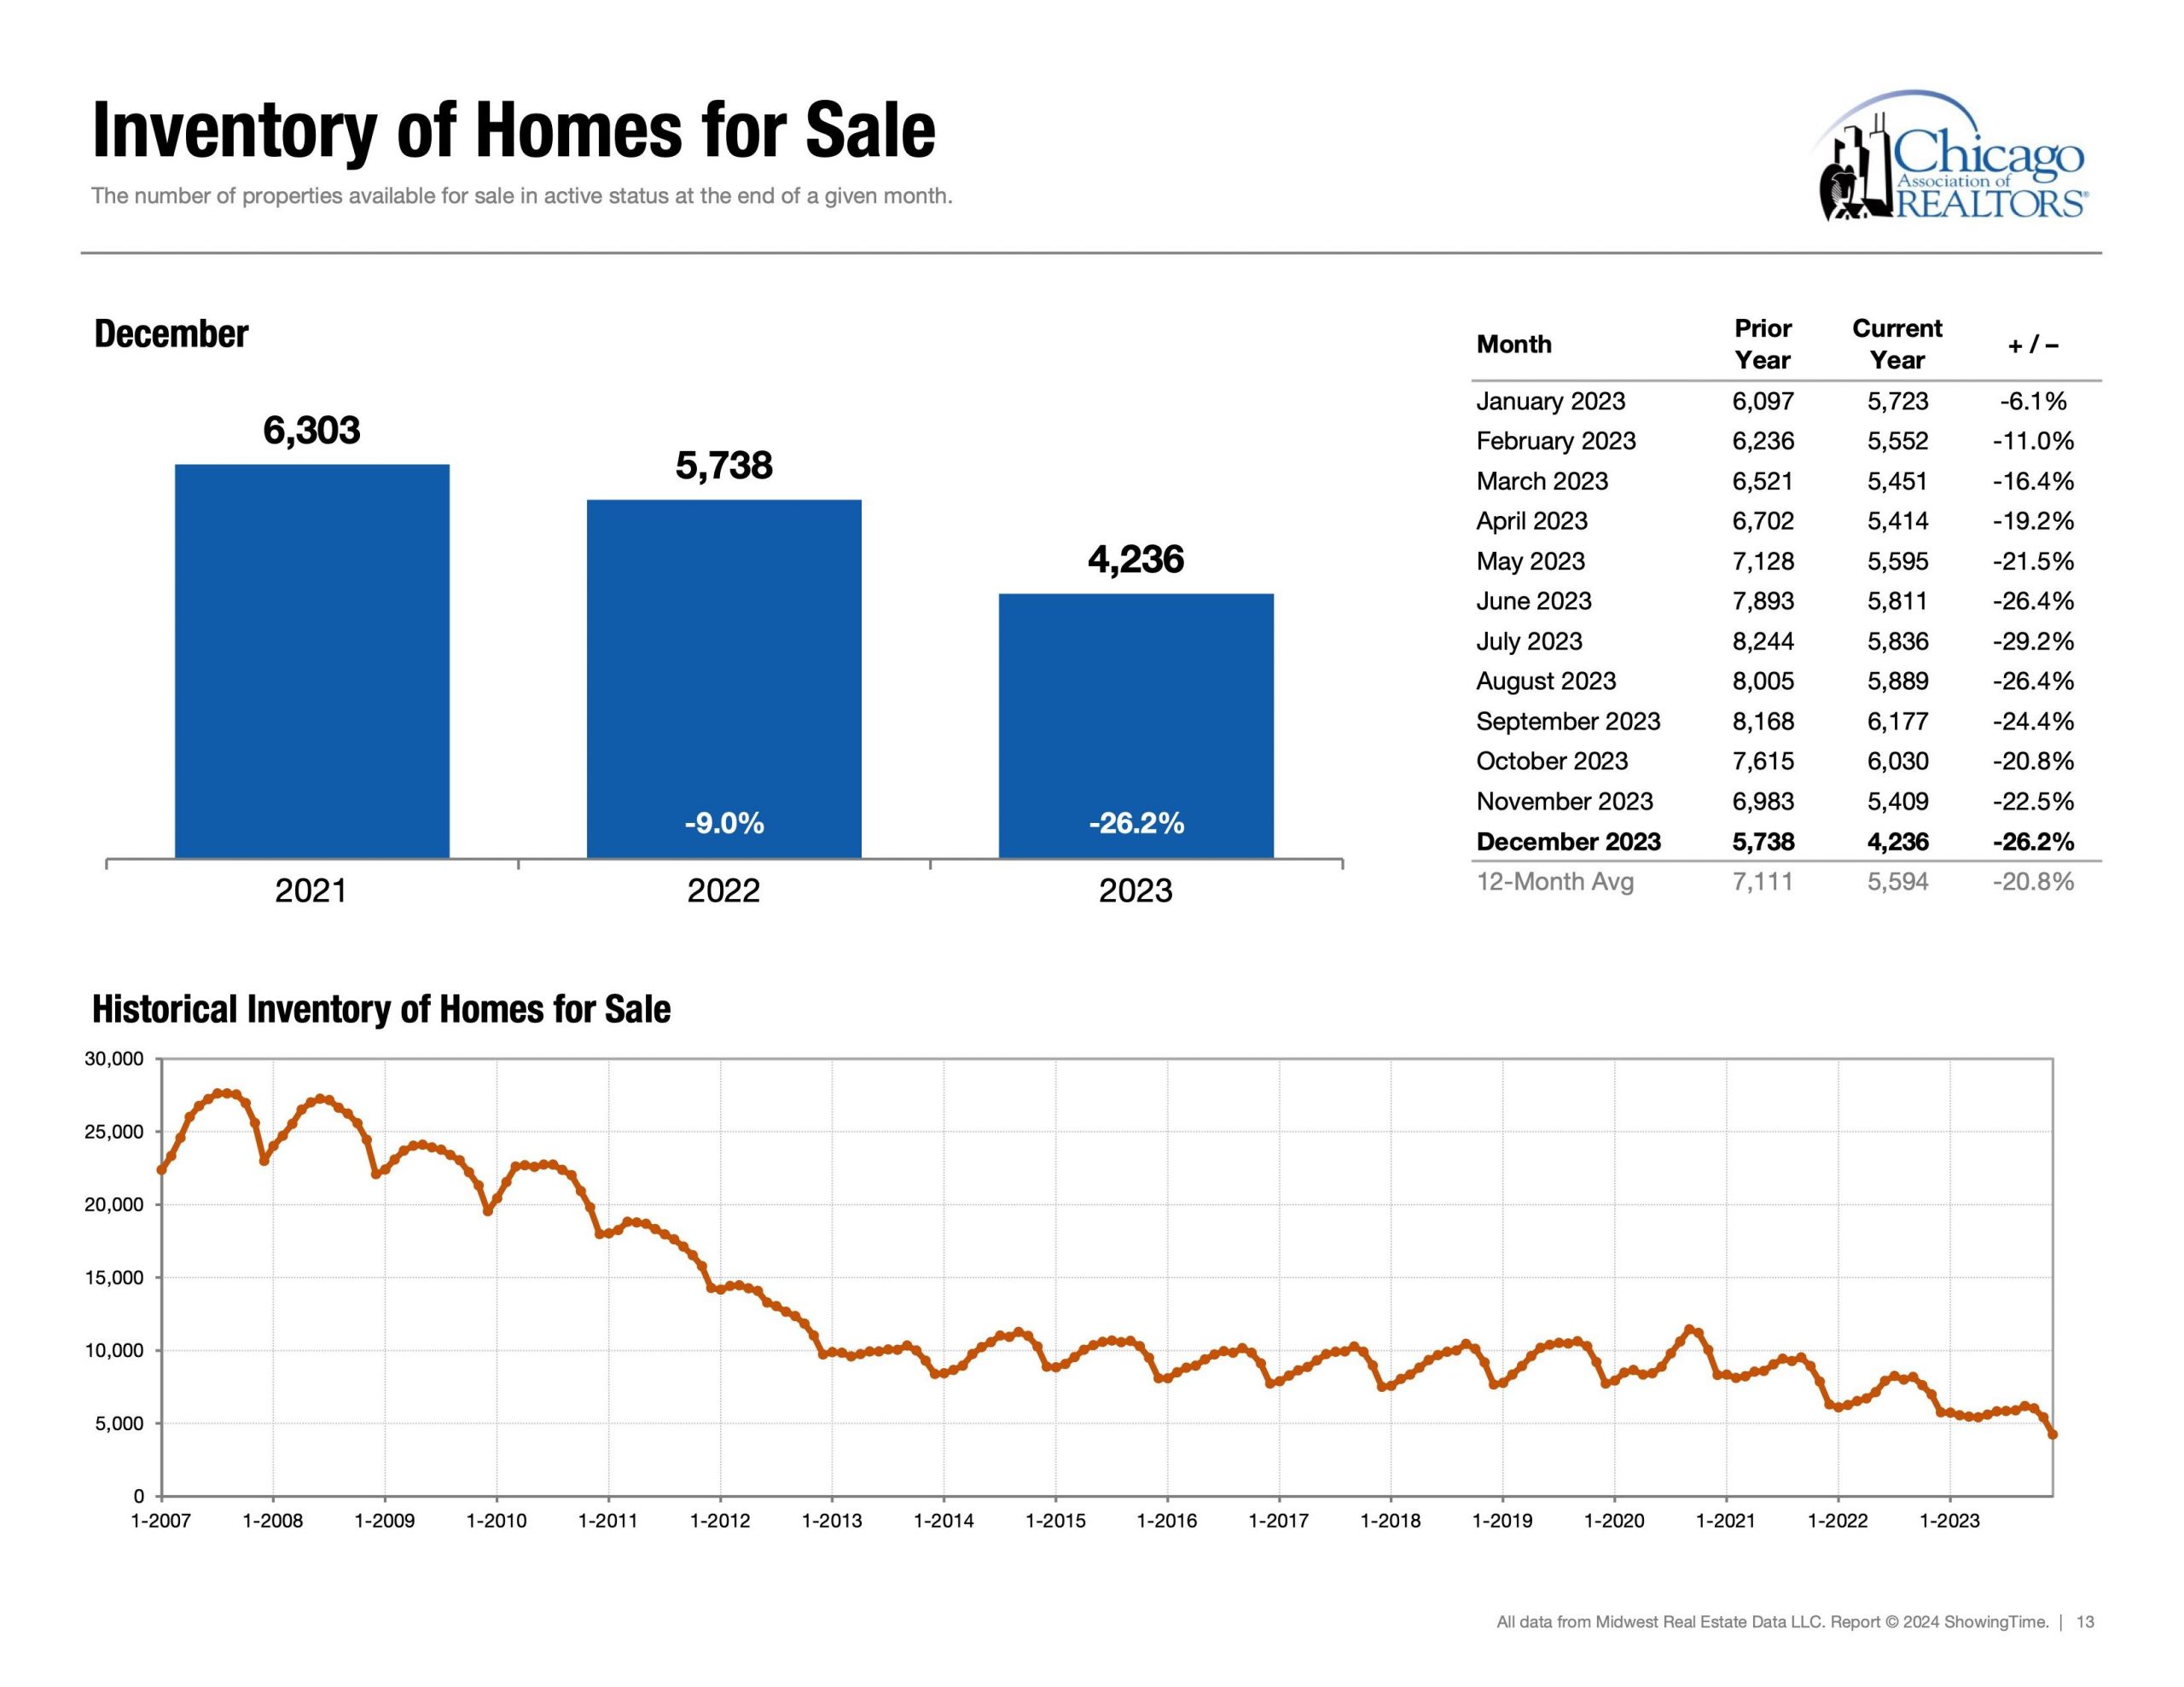
Supply | Inventory of Homes for Sale:
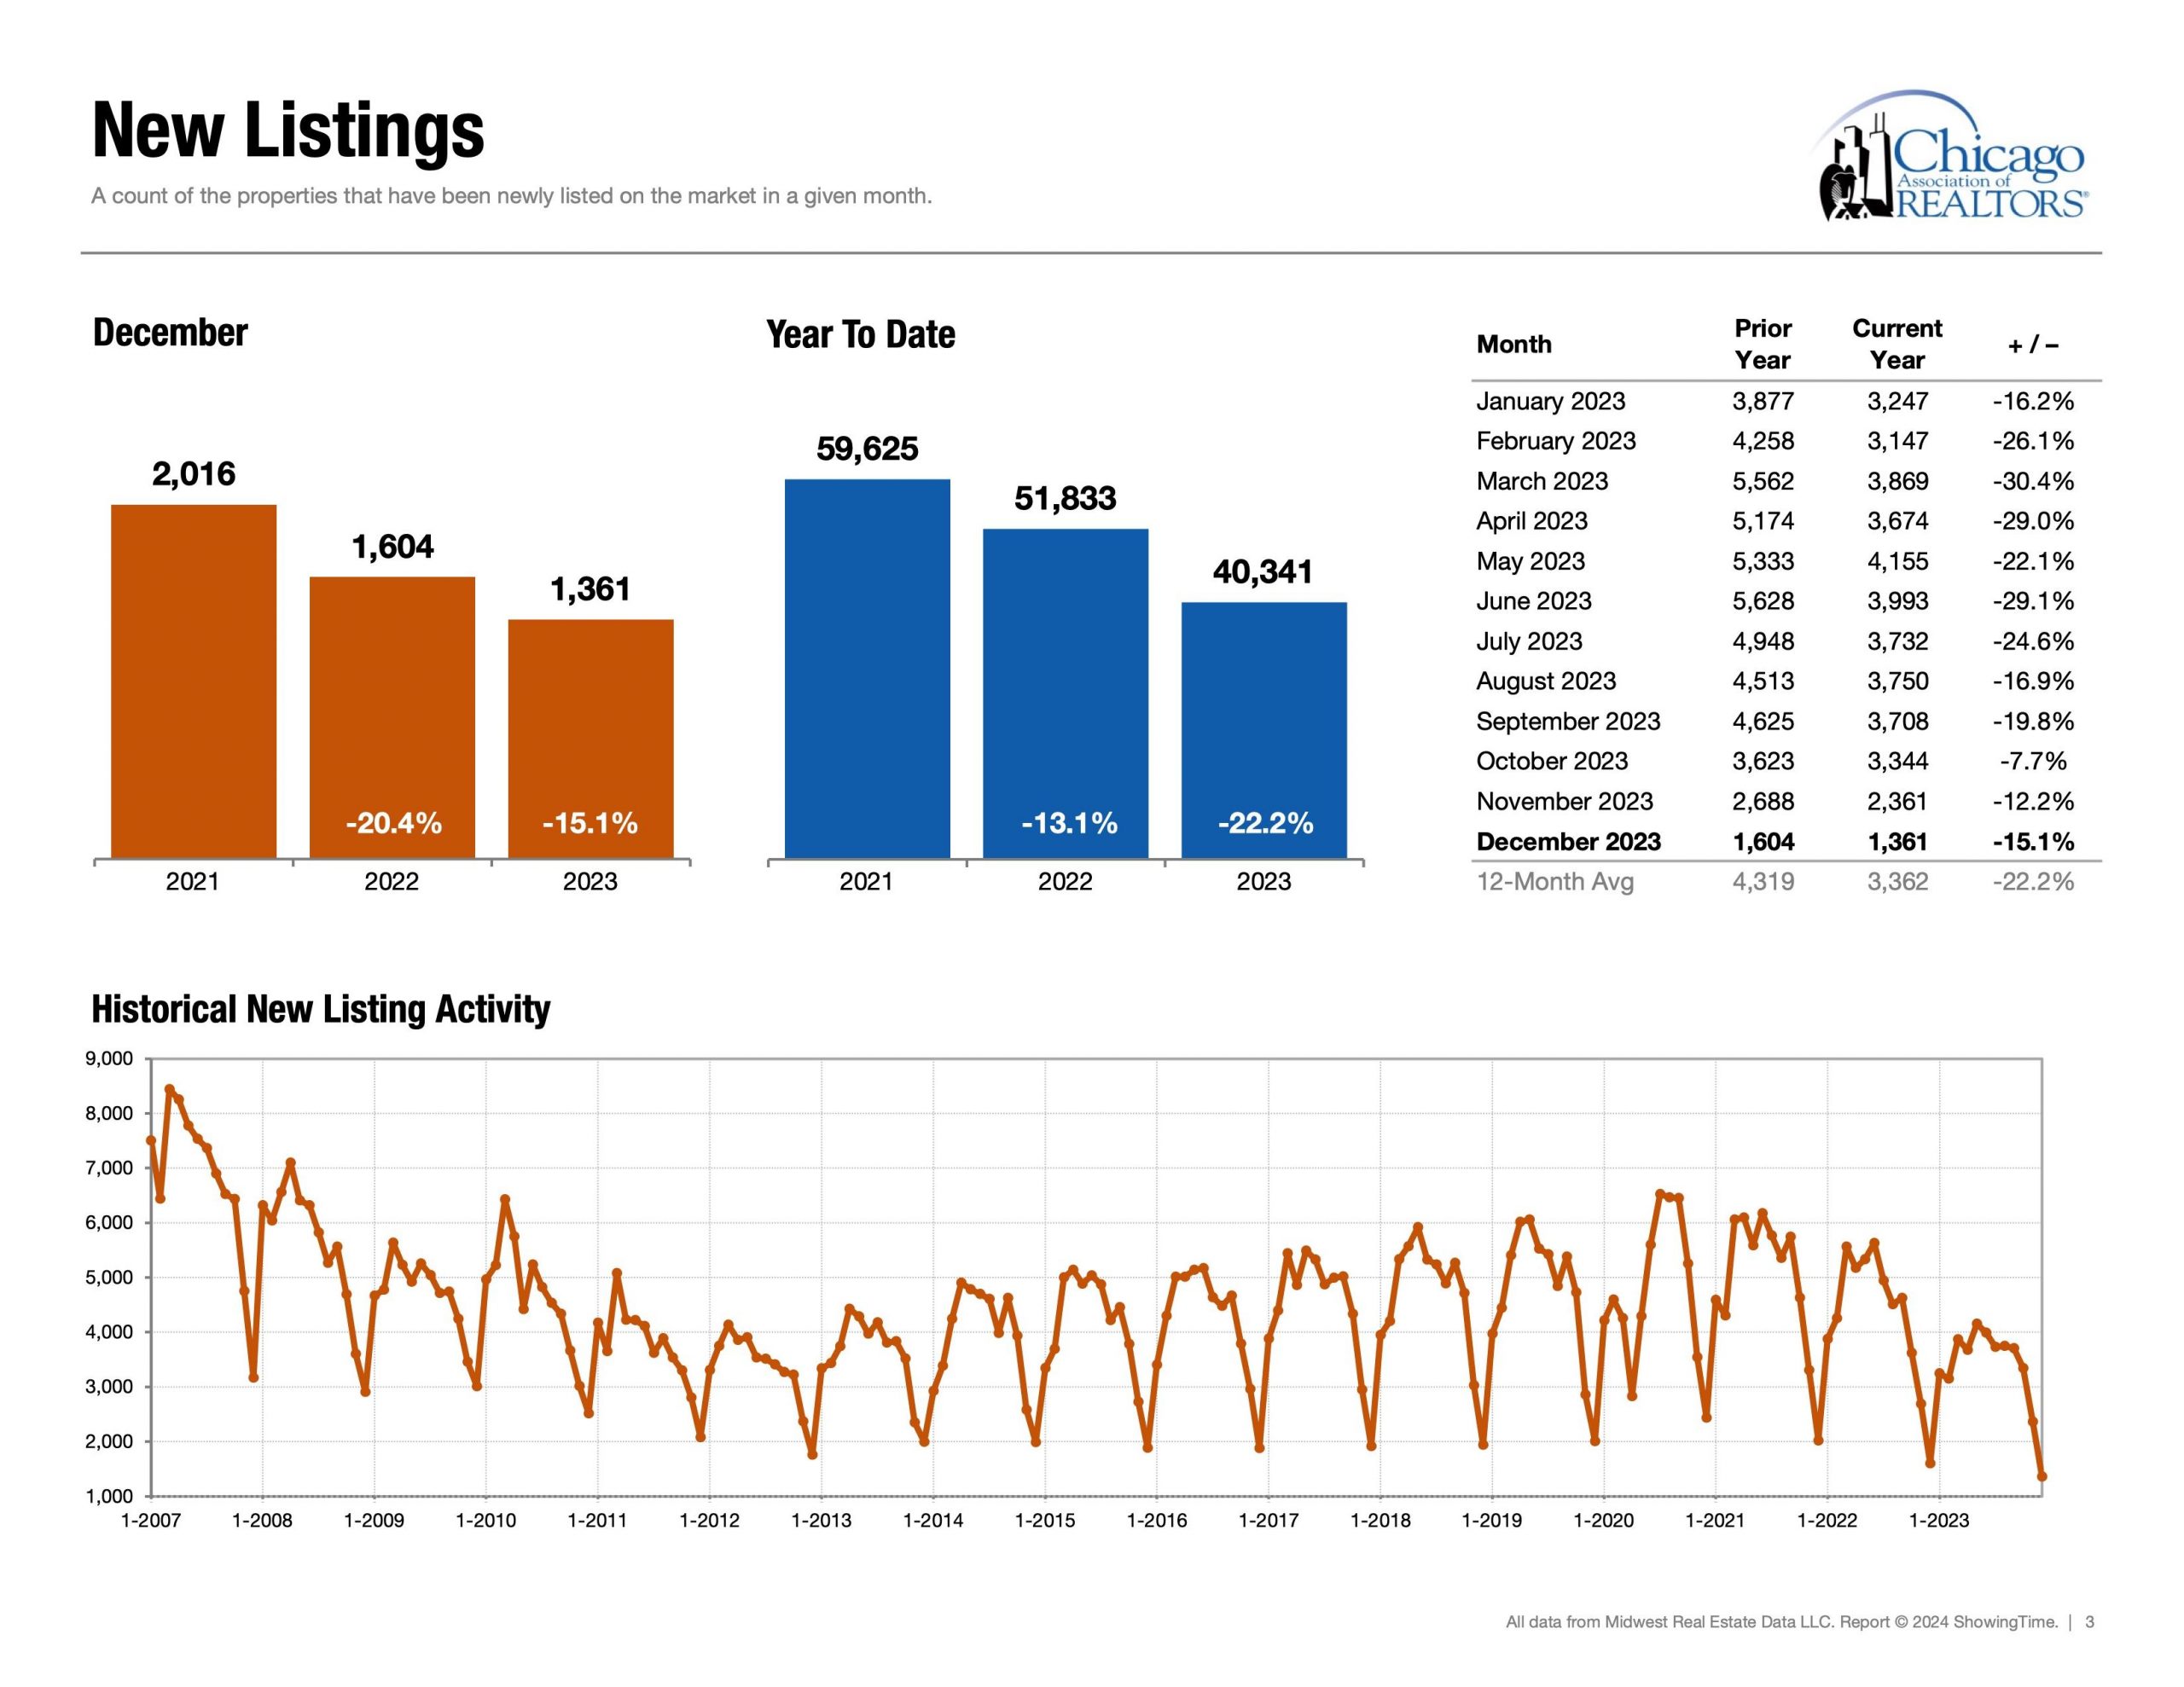
4,236 properties (Dec 2023) This shows that the supply in the Chicago Market is 4,236 and the demand is 1,118. Henceforth, if we take 4,236 supply and divide that by 1,118 demand we get ~ 3.7889. The insight to take from this is that a buyer in Chicago right now has the opportunity to “look around” at ~3.7 properties and select which one they want from those options. Additionally, Dec 22′ vs Dec 23′ saw a decrease of -26.2%; to this end inventory is dwindling. Buyers do not have as many options as they did in 2021 or 2022. Lastly, let us look at negotiations.
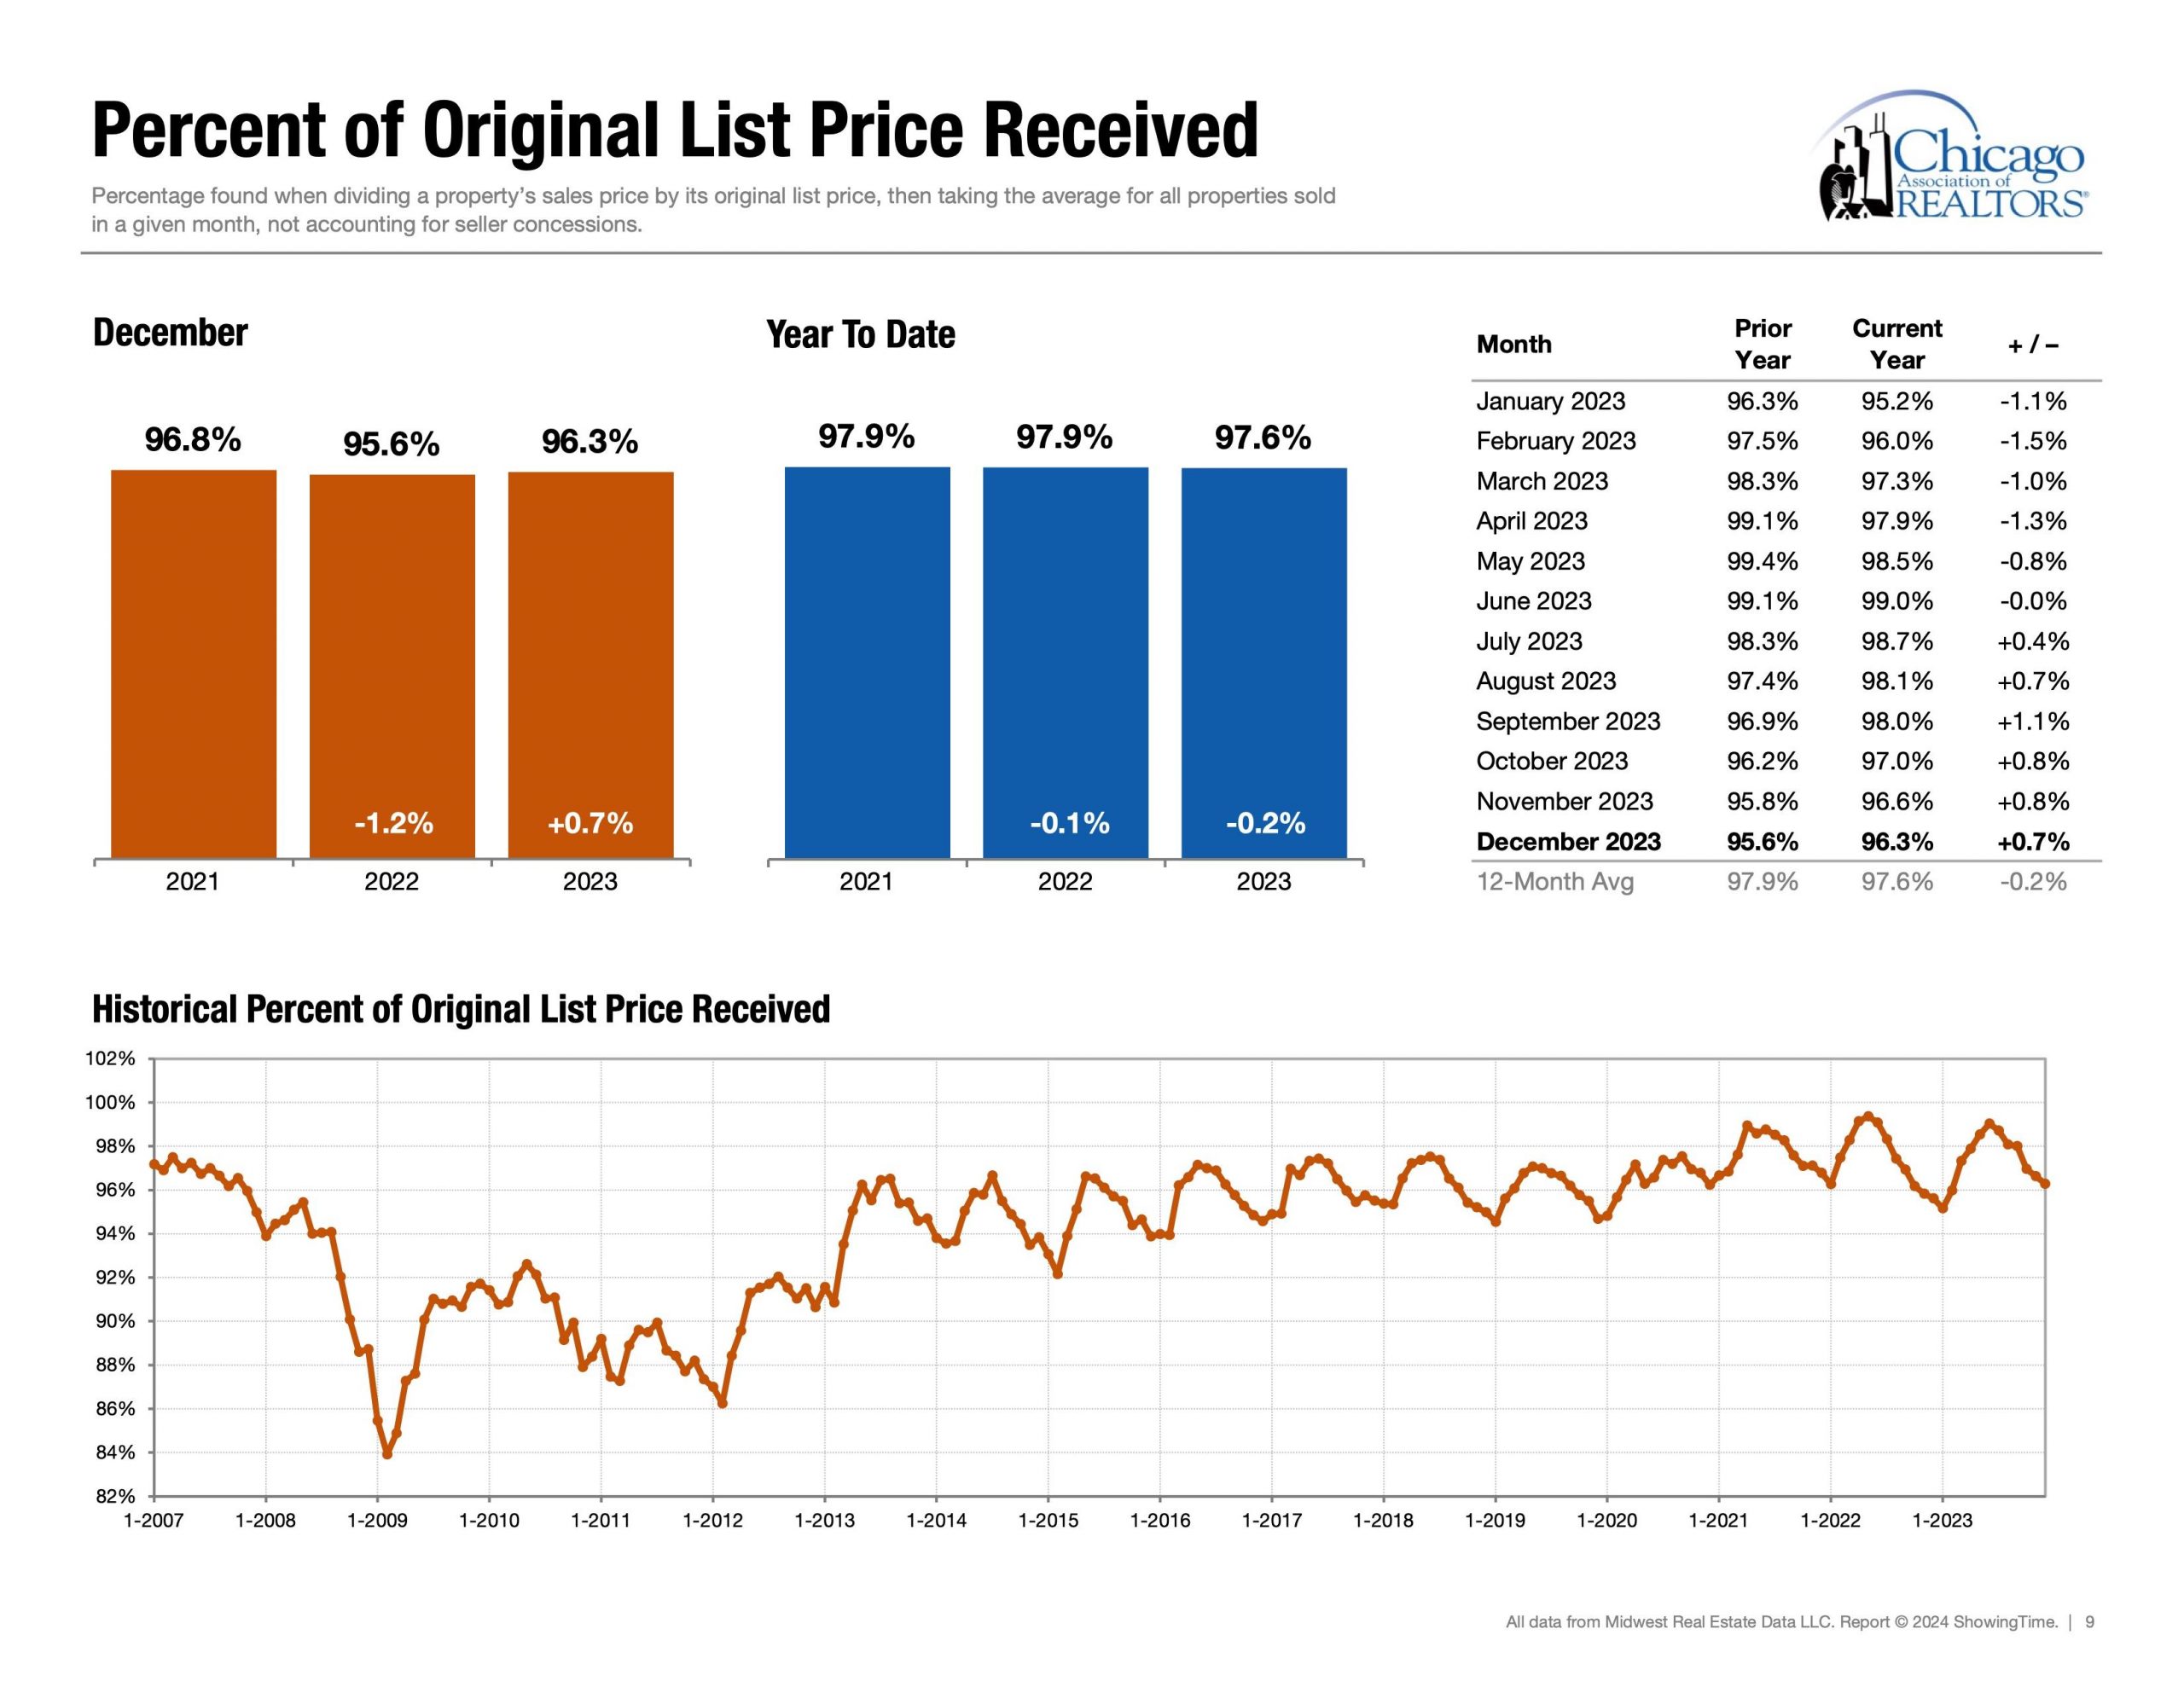
Negotiations | Percentage of Original List Price Received:
96.3% (Dec 23′) ~97.6% (yearly avg) What does this mean? A question anyone asks when purchasing any product is: “Do you think is a good deal?” or “How much do you think the seller is willing to “negotiate?” Good question. Properties sell for what they are worth; therefore, let us look at the data. This metric looks at the 1,485 closed/sold properties in the month of December 2023. Out of those sold properties, they sold between ~96.3% (Dec 2023) ~97.6% (yearly avg) of the original list price.
The End | Blessings & High Fives!
Below is the report filled with words, charts, and graphs that I look at to see where the market is. In closing, it’s essential to keep in mind that real estate markets can vary across neighborhoods and property types within a city. Additionally, economic conditions and external factors can influence market trends. Staying updated on these metrics and trends is crucial for making informed decisions.