Facebook
 X
X
 Pinterest
 Copy Link

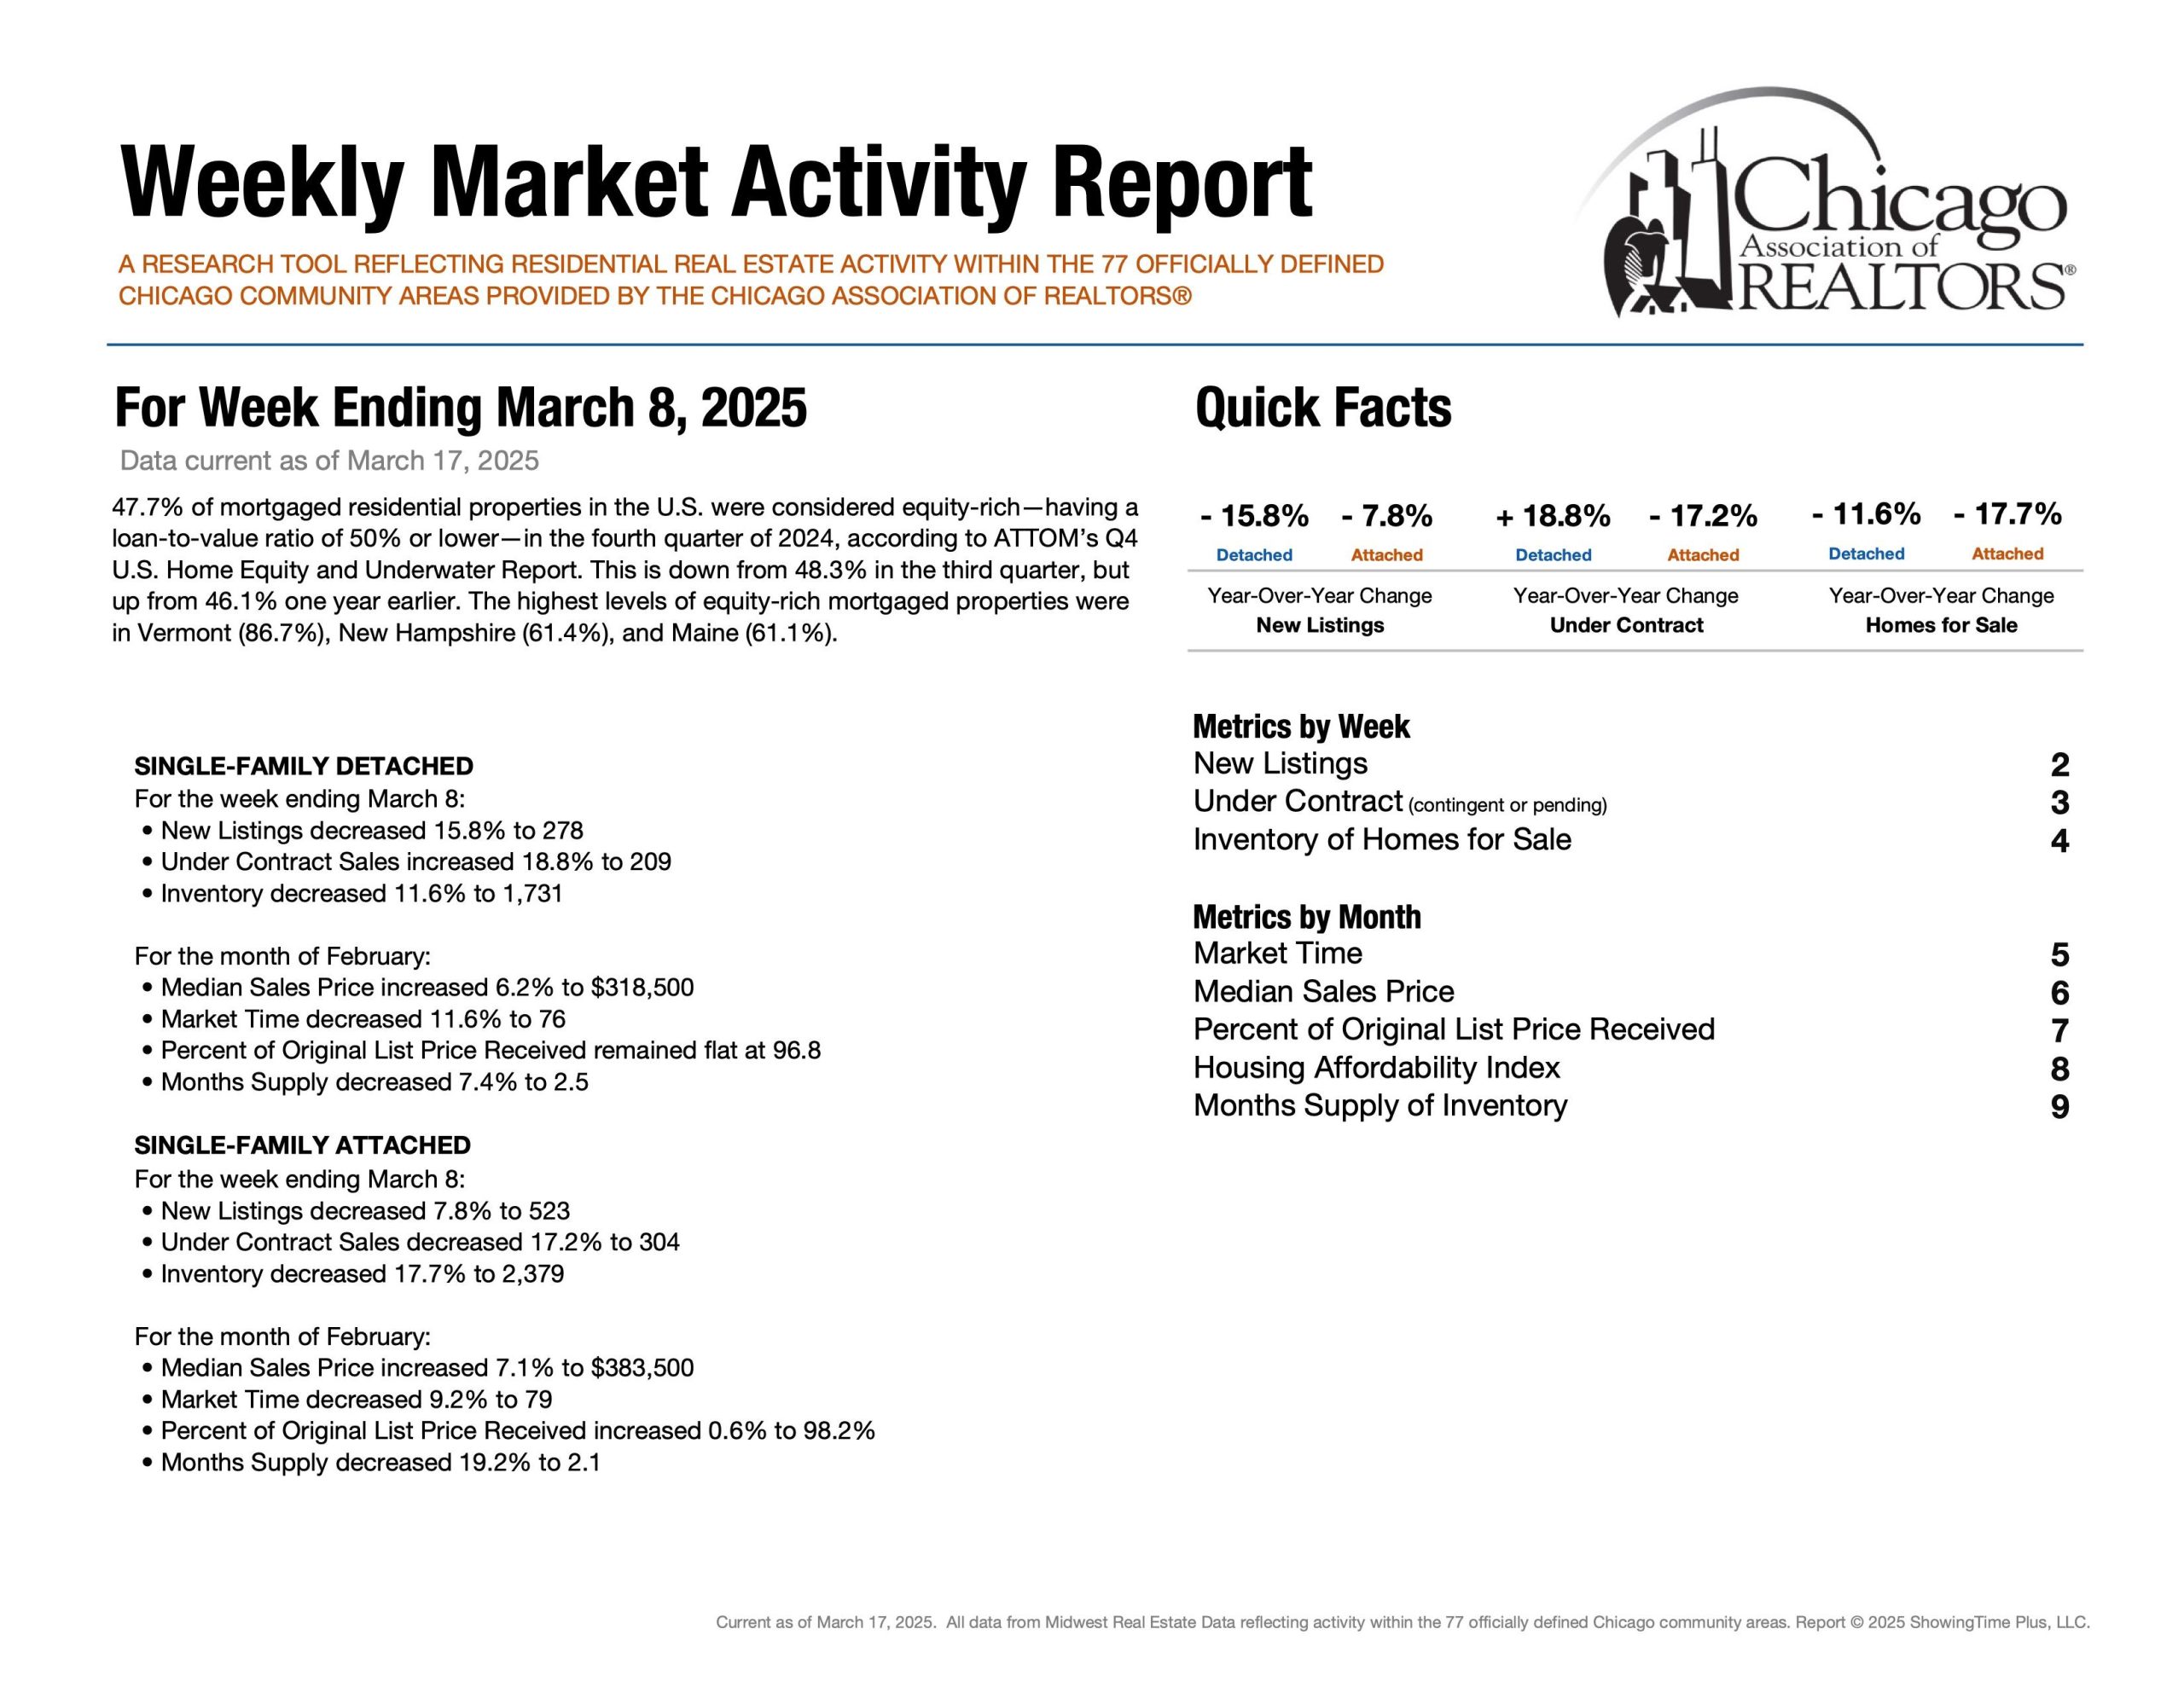
January 2025 | Week 10
Chicago Real Estate Market Metrics. While there are many metrics to talk about in the world of real estate, today we are going to look at four: speed, demand, supply and negotiations. Let’s get started! Follow along for weekly updates on all things Chicago Real Estate by clicking here.
Summary | TLDR
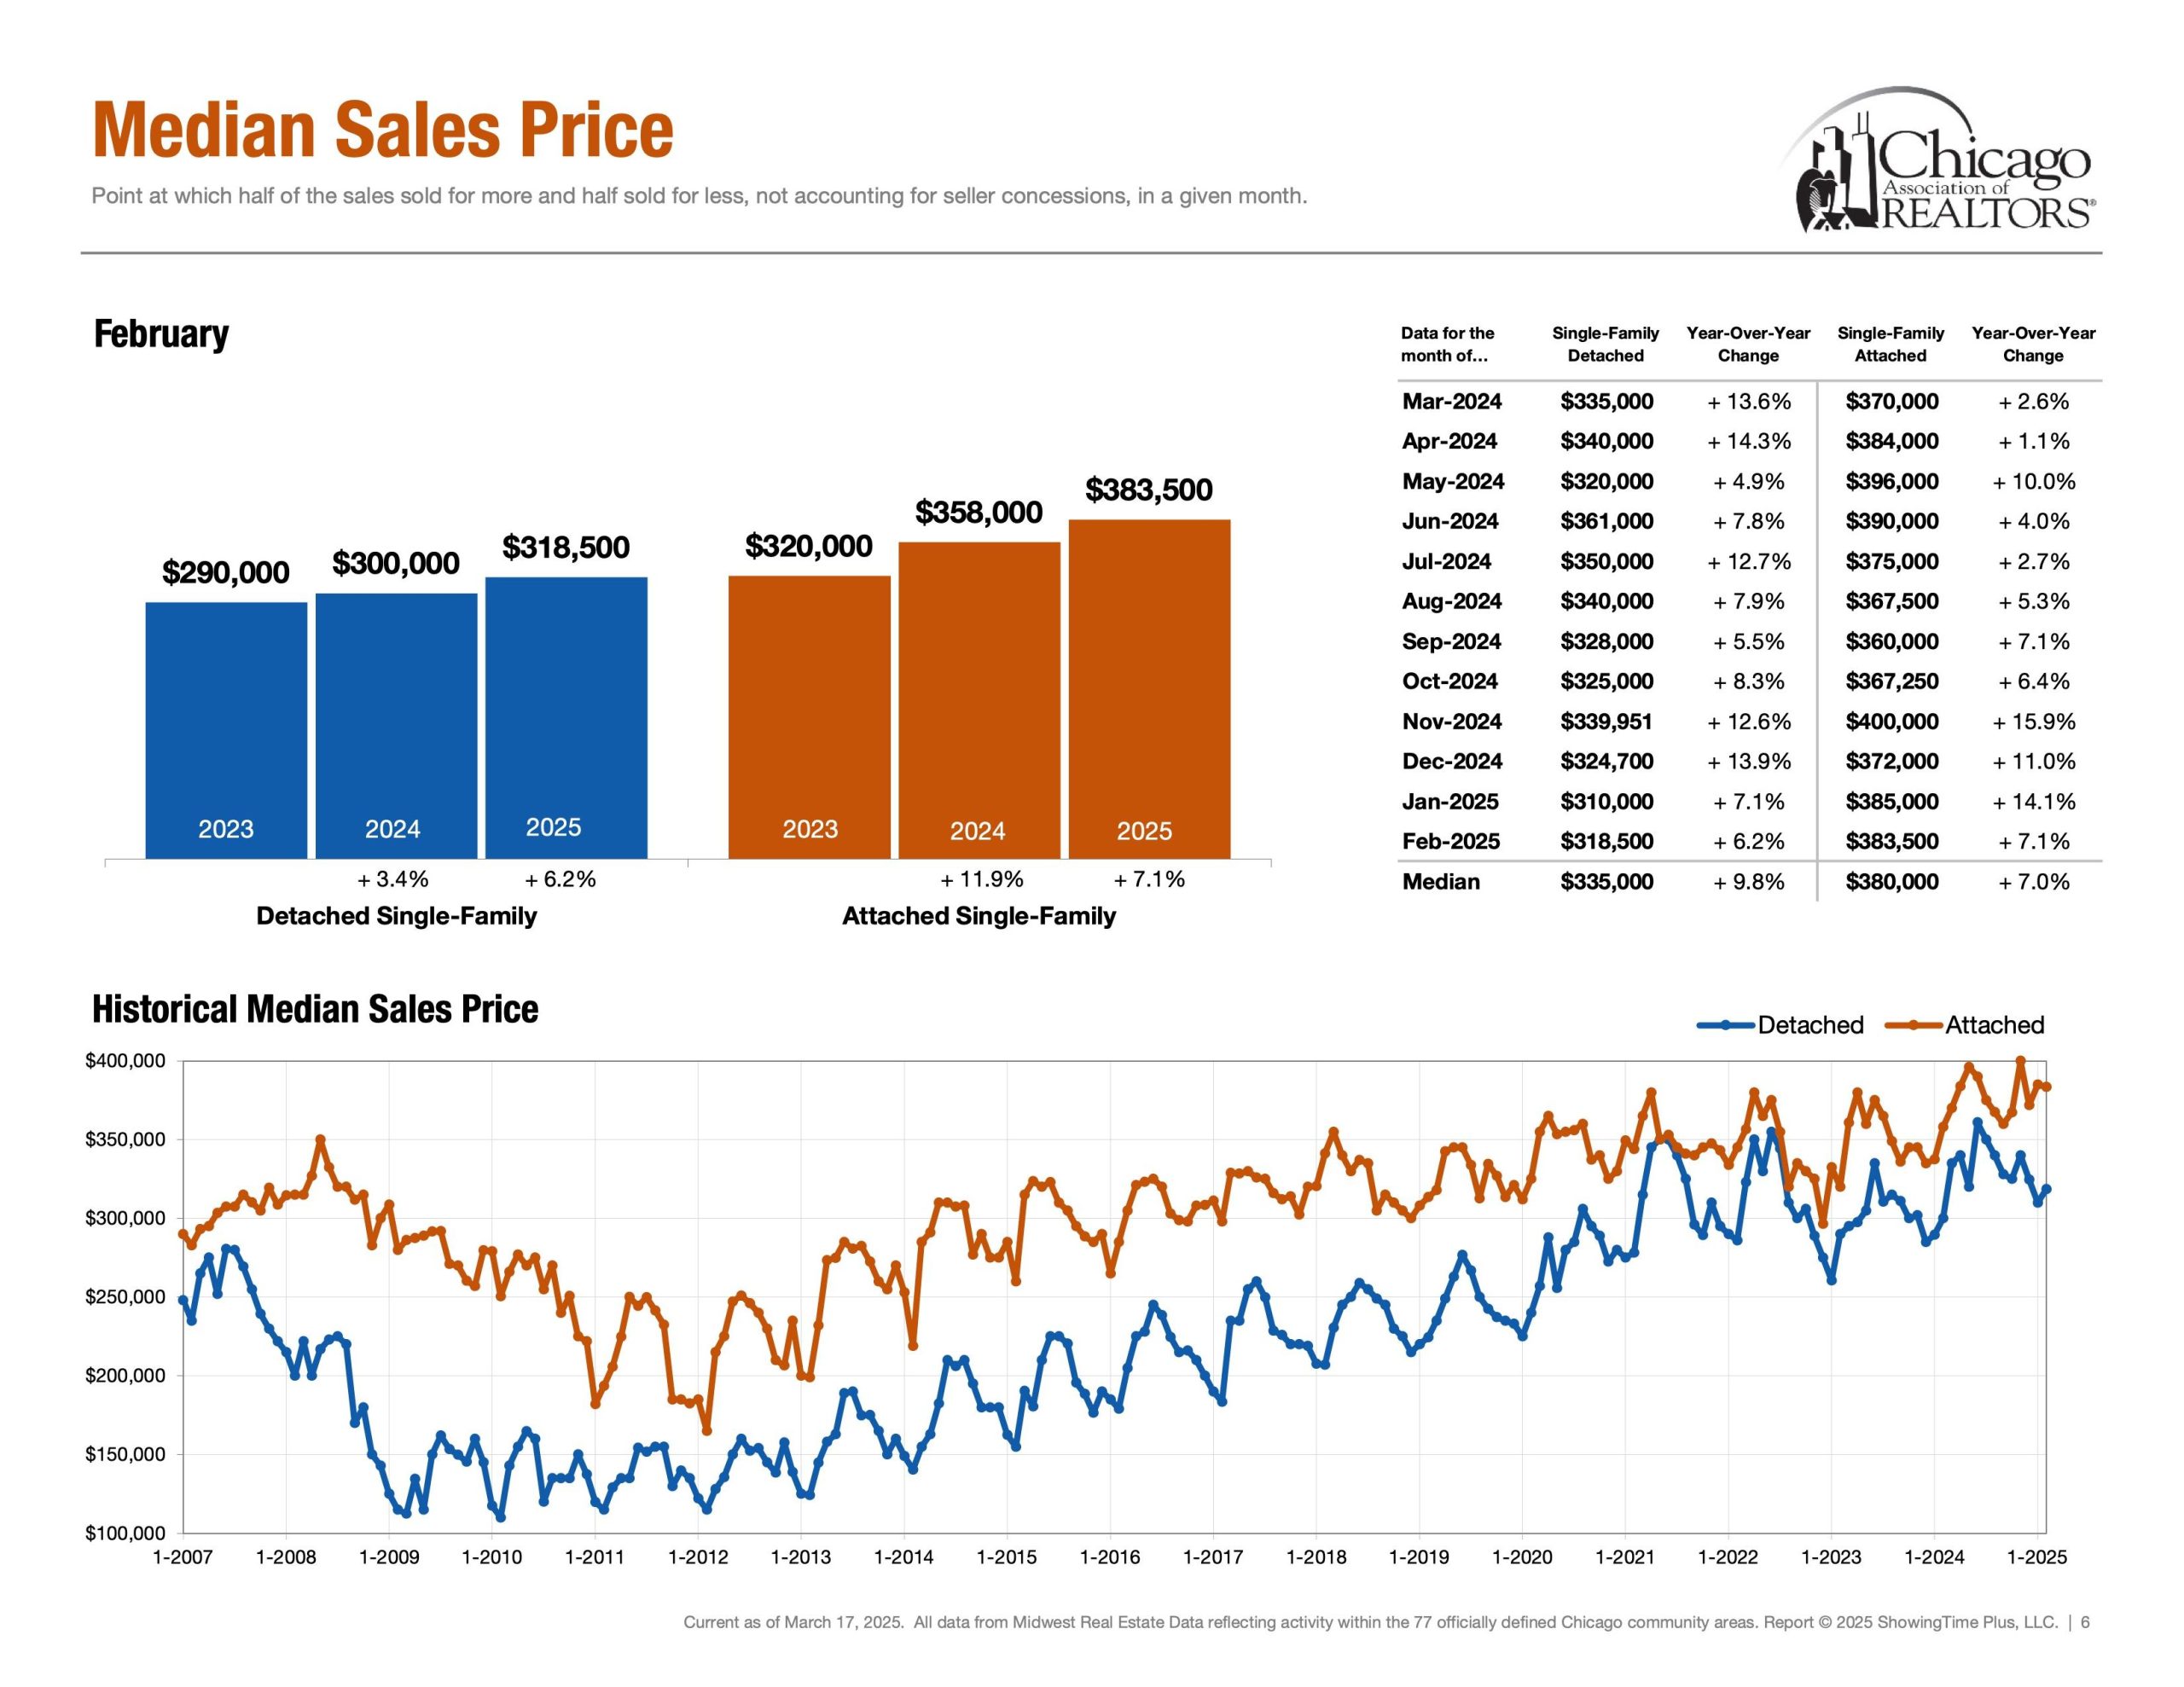
Median Sales Prices
2012:
Attached Single: $200k – $225k
Detached Single: $110k – $160k
Today:
Attached Single: $383k
Detached Single: $318k
Affordability in Chicago
While the income required to purchase property in Chicago is significant, it’s important to consider the long-term benefits. Real estate can be a hedge against inflation, and buying assets that appreciate over time can help build wealth.
Inventory Levels: Chicago vs. Florida
Chicago: Low inventory, making it a seller’s market. This can drive up prices but also indicates strong demand.
Florida: High inventory, which can lead to more options for buyers but also potential price corrections, especially in rental vacation communities.
Economic Factors
Chicago: Despite being a relatively affordable option, Chicago’s status as a global transportation hub and its role in the Midwest’s economy make it a strategic place to invest. The city’s focus on technology, education, and innovation contributes to its long-term potential.
Florida: Homeowners are feeling the impact of economic corrections, rising living costs, and dwindling disposable income, particularly in rental vacation communities.
Balancing the decision to buy assets involves considering both the potential for appreciation and the ability to sell if needed. Chicago’s economic stability and growth potential make it an attractive option. I do think Florida’s Real Estate Market will heal. It’s just time.
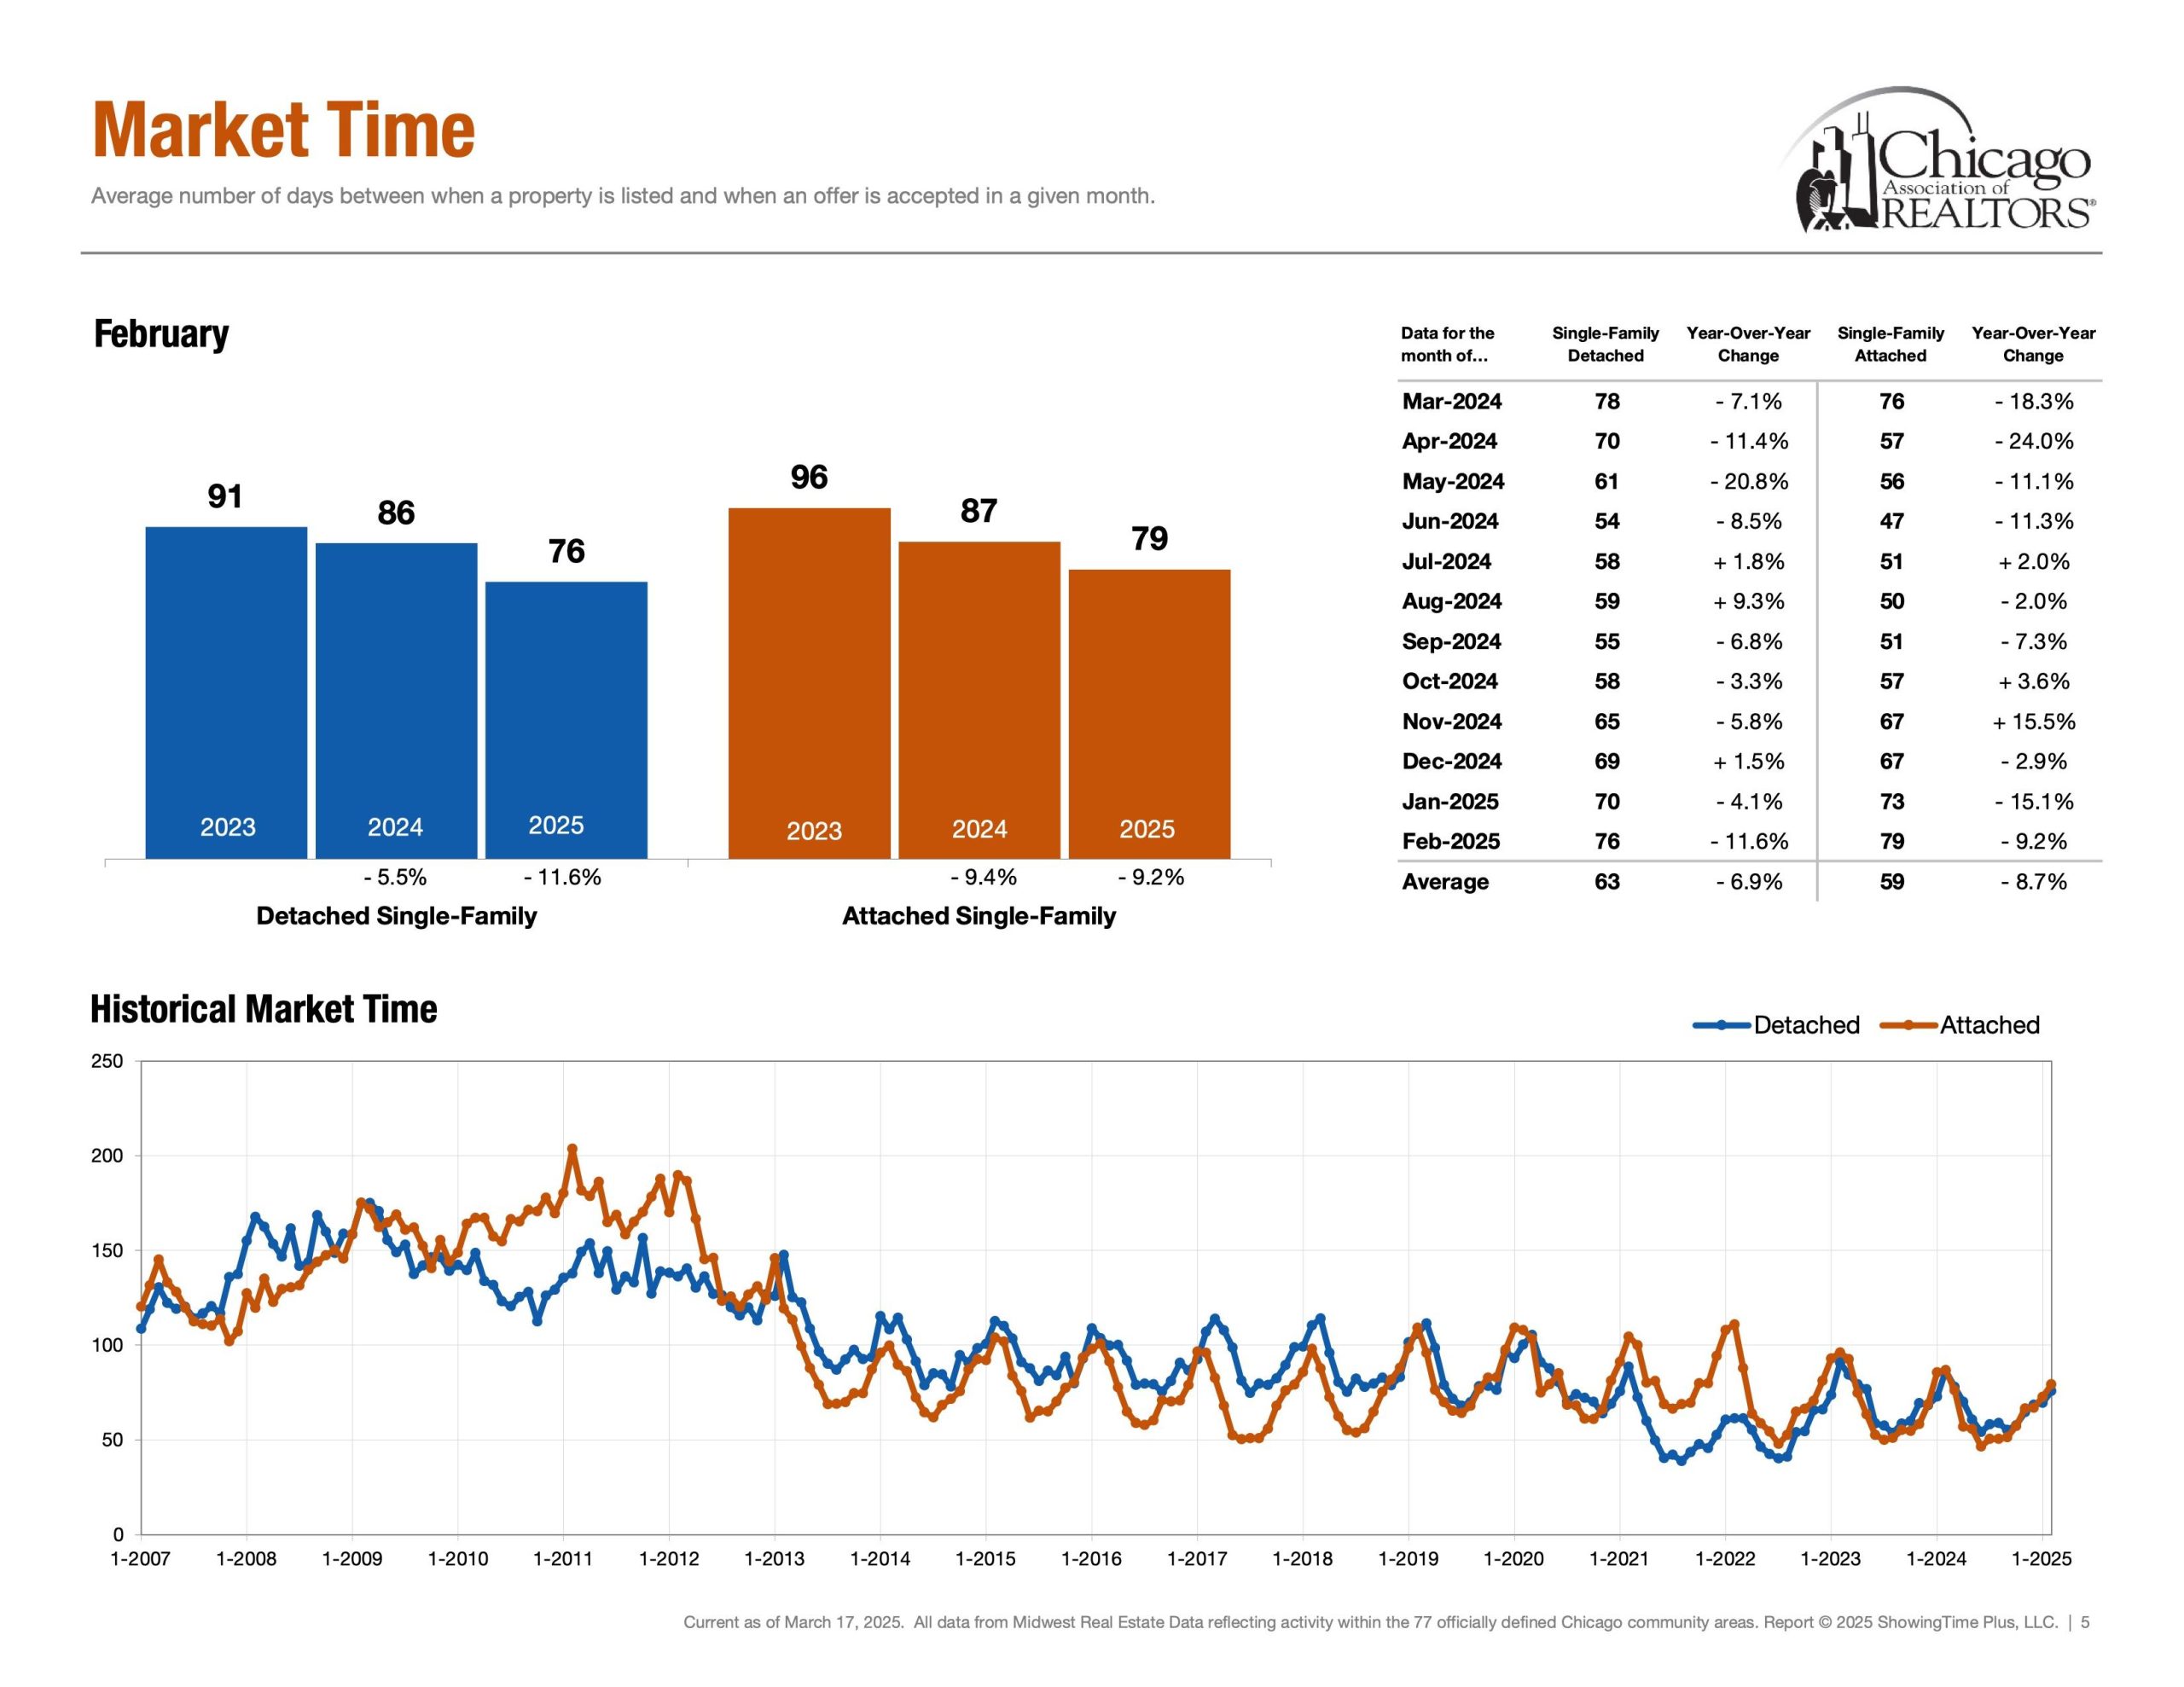
Speed | Healthy Market Time Range
Detached Single ~ 76 Days (Feb 25′)
Attached Single ~ 79 Days (Feb 25′)
First, market time is metric that showcases speed and whether a listing was priced too low, priced properly or priced too high. If a listing surpasses average days on market, it is a check engine light that your listing maybe overpriced.
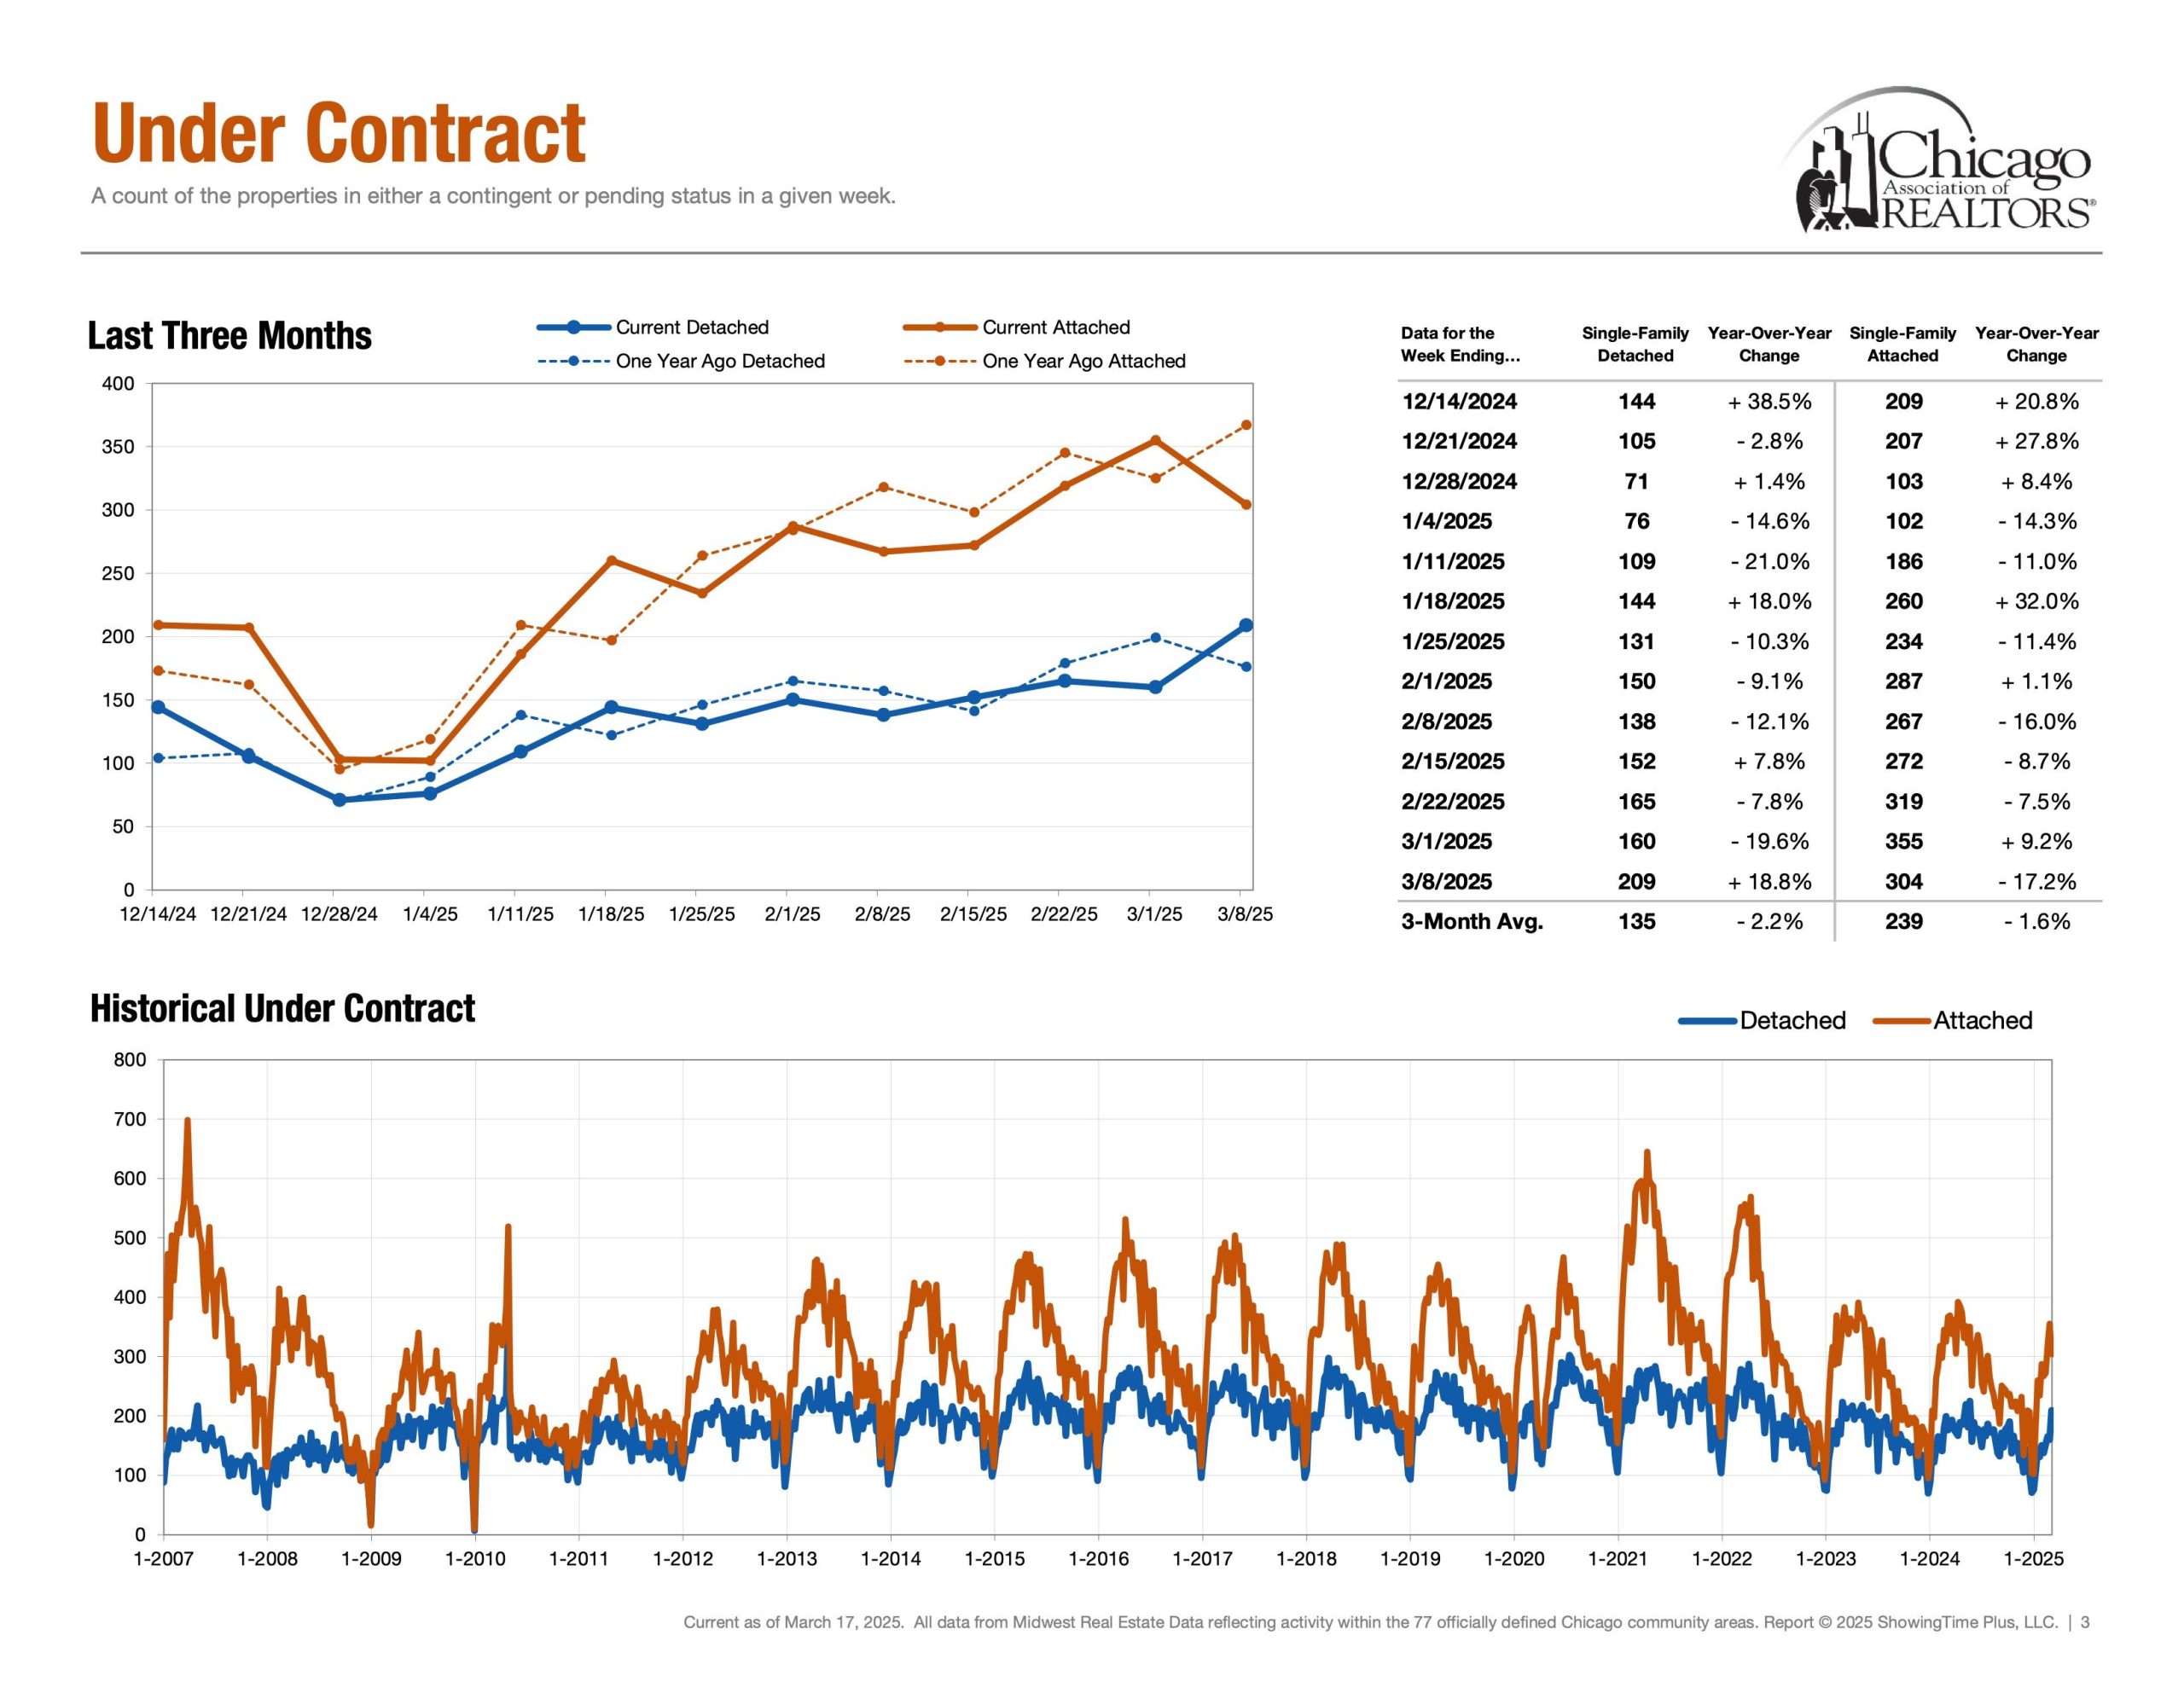
Demand | Under Contract
Detached Single = 209 Properties (March 2nd – March 8th)
Attached Single = 304 Properties (March 2nd – March 8th)
Secondly, under contract helps answer the question, “In our current market, how many buyers are buying?” Showcasing the heartbeat of the real estate market. Interestingly, demand metrics become more insightful when compared and contrasted with supply/inventory metrics.
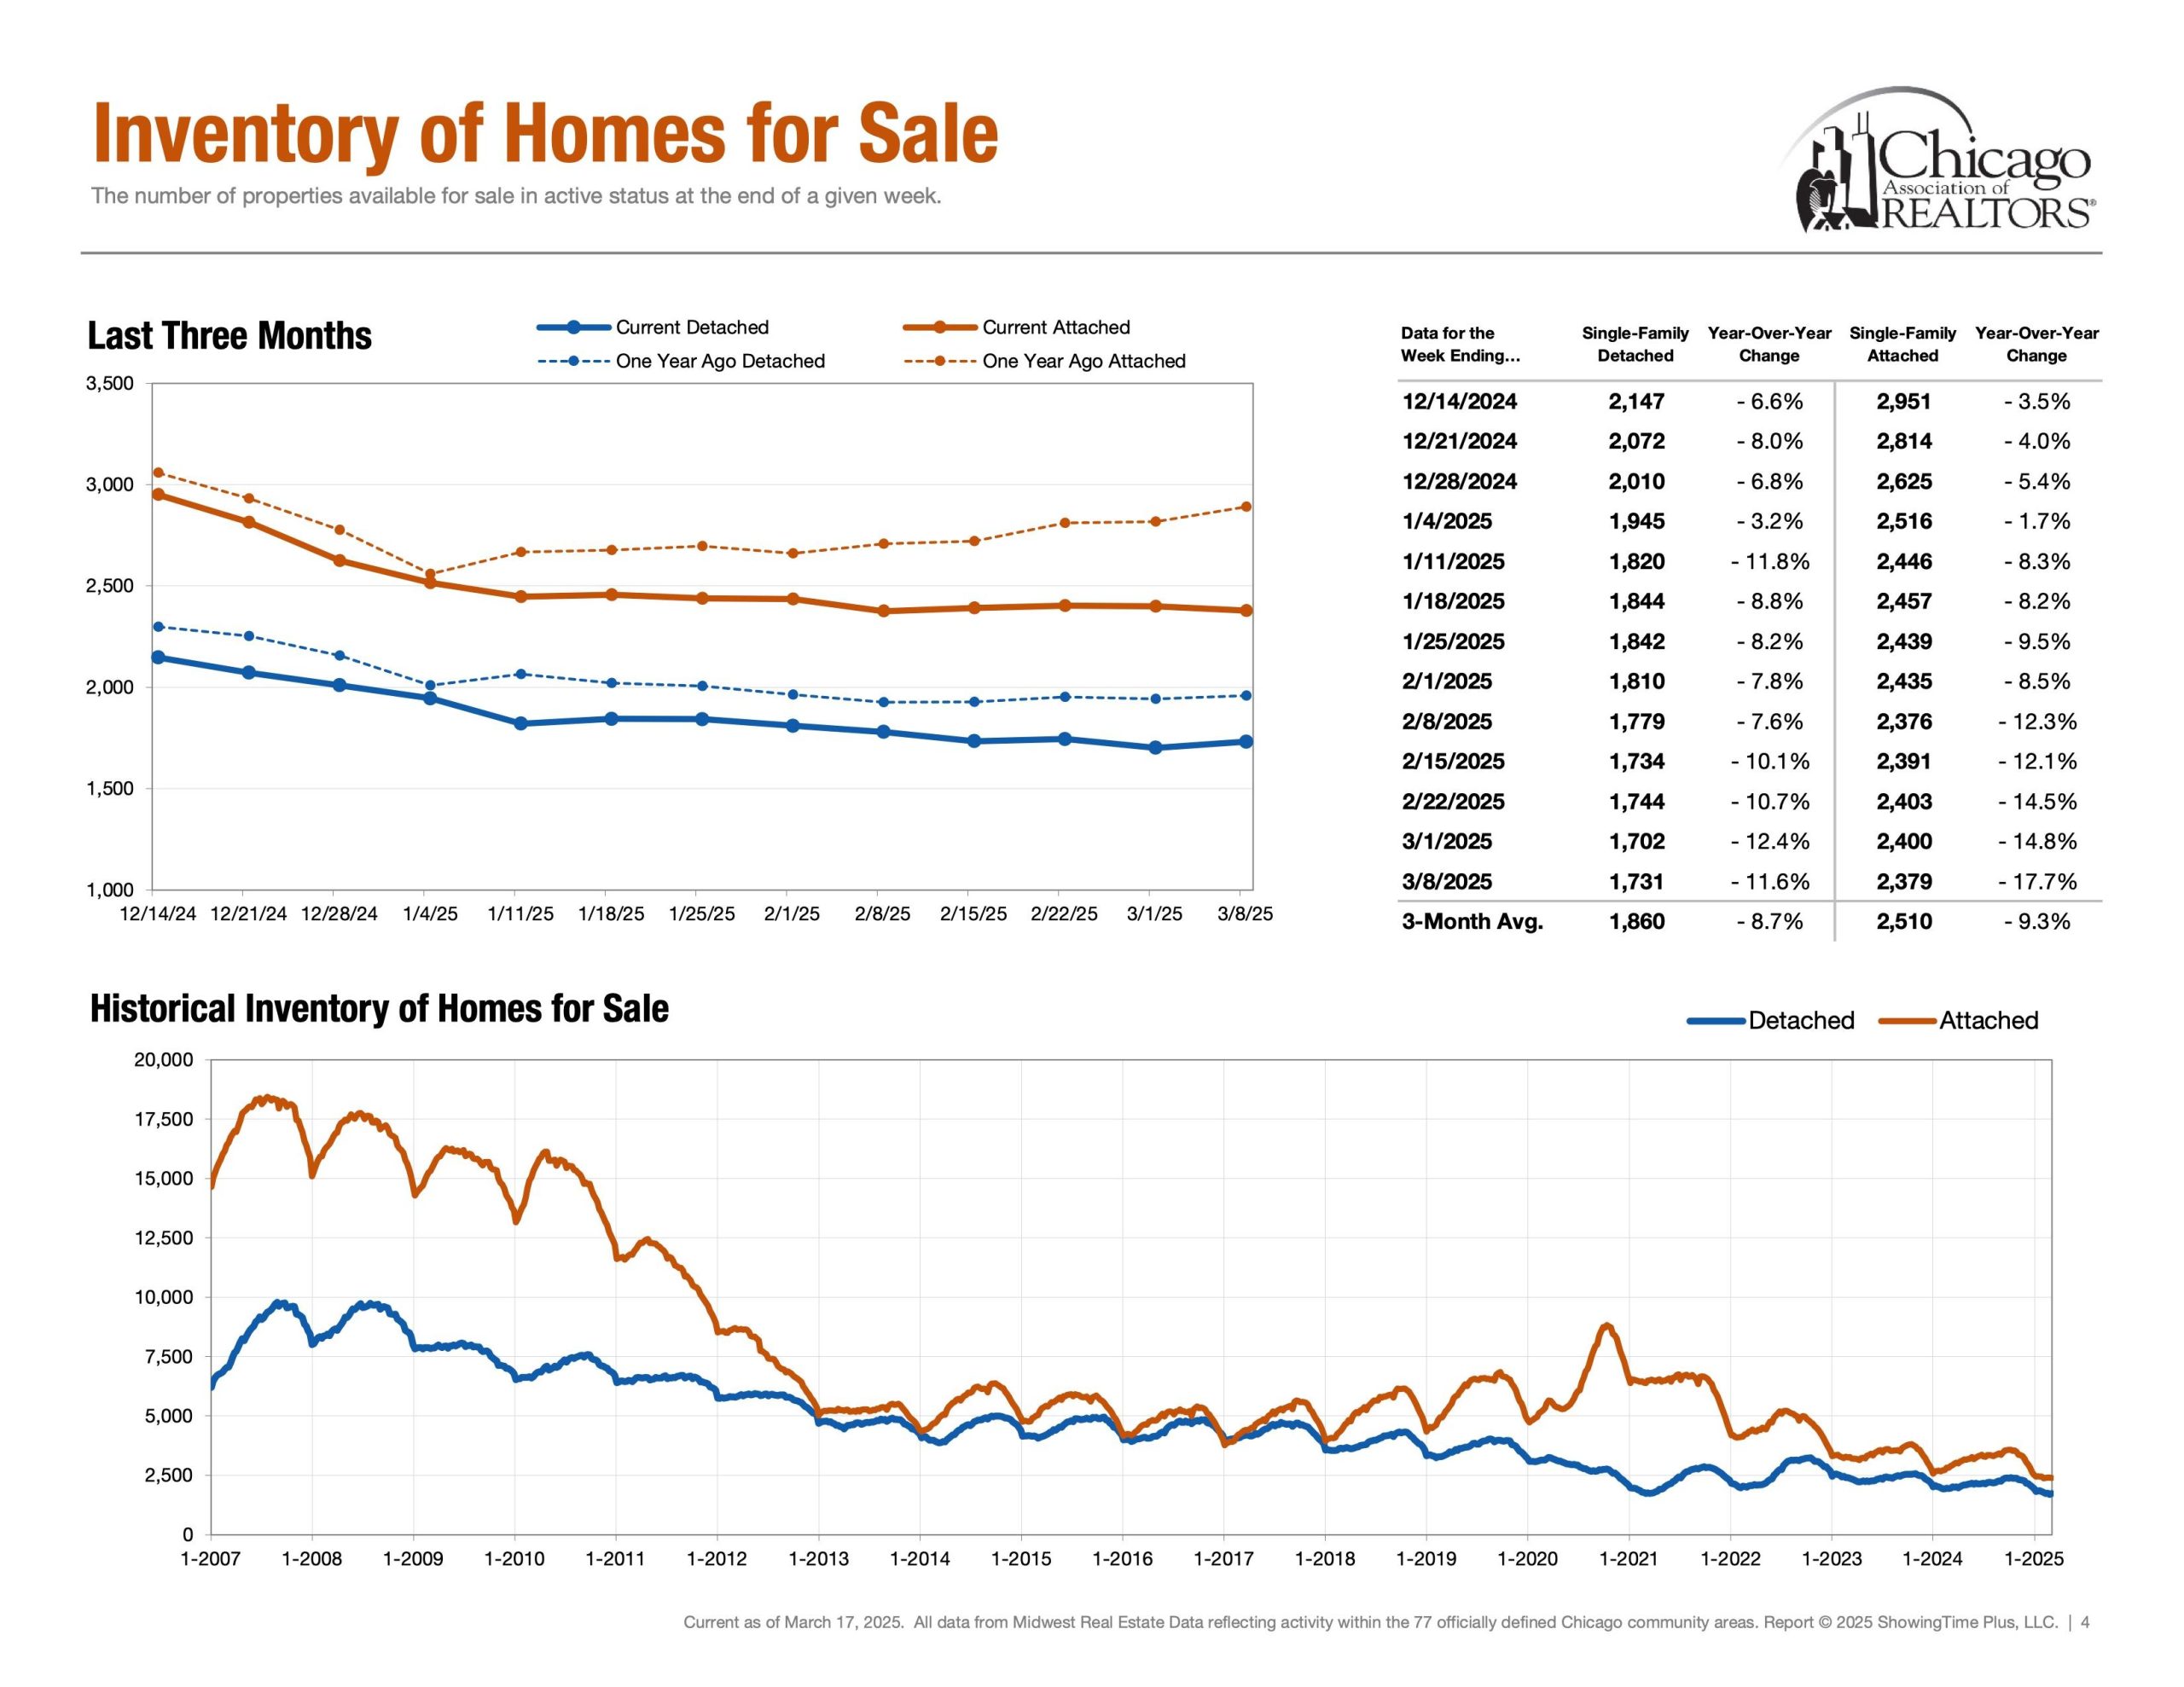
Supply | Inventory of Homes for Sale
Detached Single = 1,731 Properties (March 2nd – March 8th)
Attached Single = 2,379 Properties (March 2nd – March 8th)
Next, probably the metric of the year. Inventory of homes for sale showcases supply and answers the question, “How much inventory is available for buyers and how much competition sellers are up against?” Additionally, Months of Inventory, Homes for Sale, New Listings and Absorption Rate are also other key metrics in the conversation of supply.
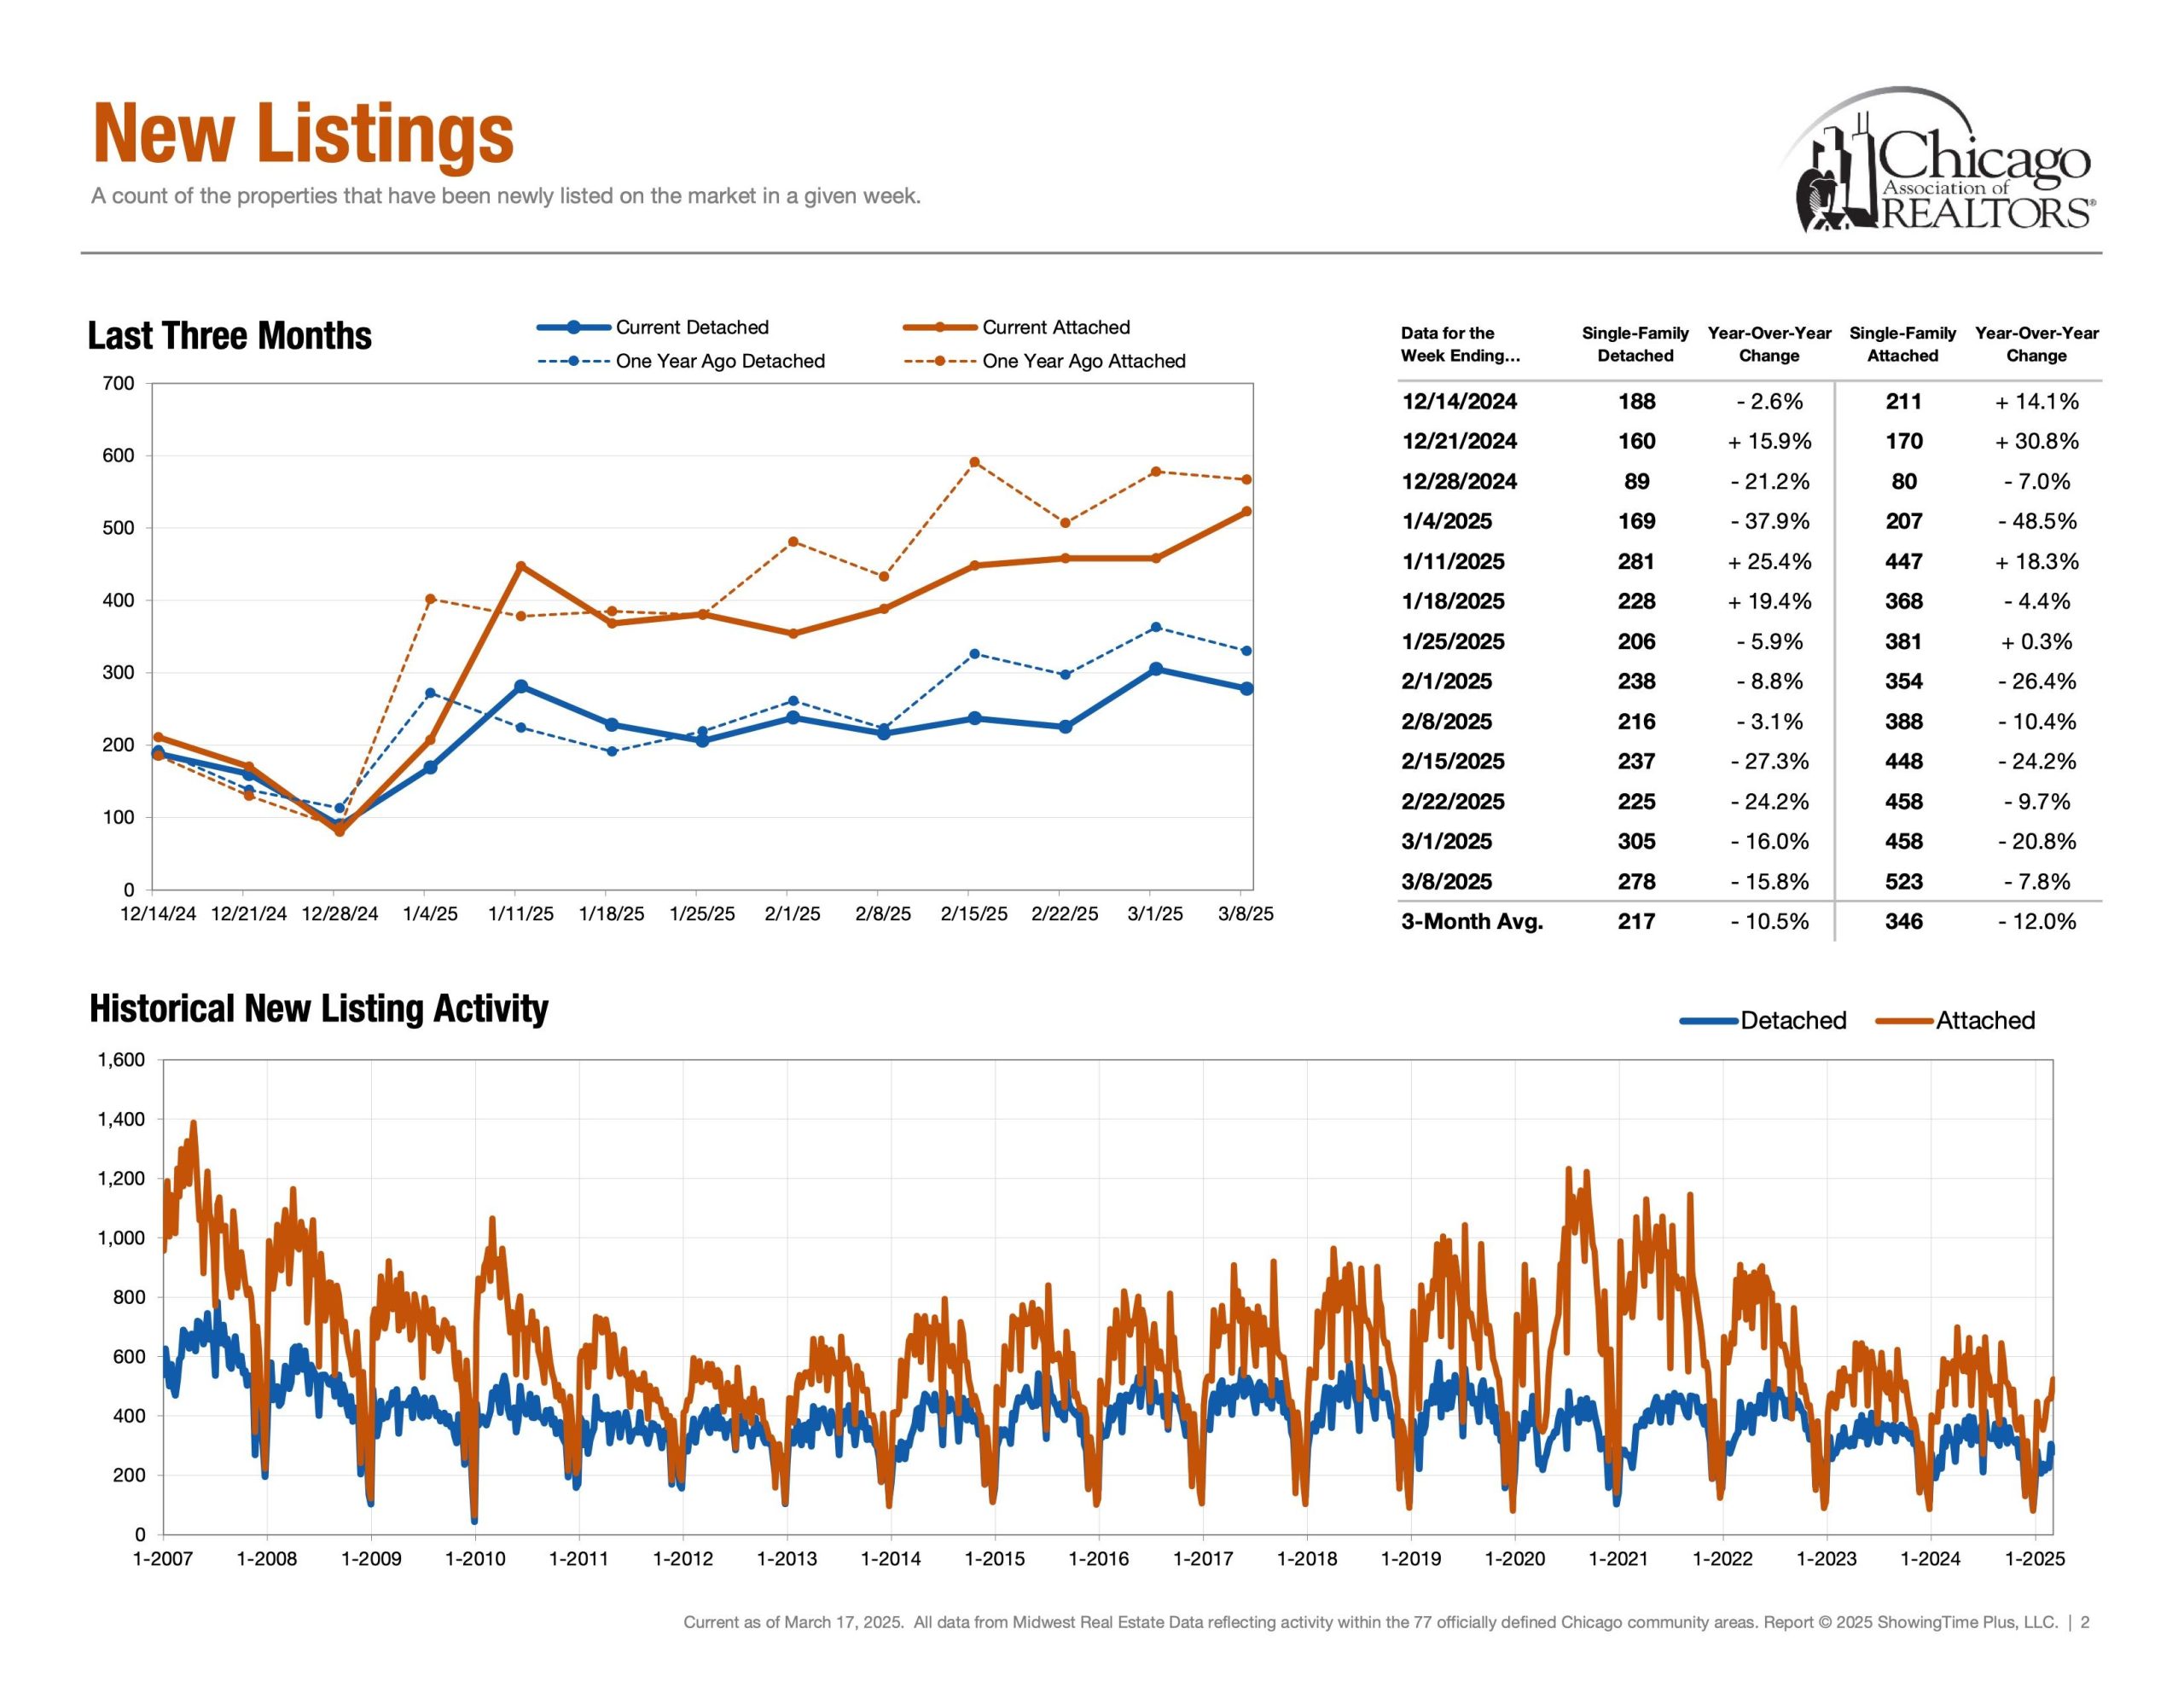
Supply | New Listings
Detached Single = 278 Properties (March 2nd – March 8th)
Attached Single = 523 Properties (March 2nd – March 8th)
New Listings is a foreshadowing metric and helps visualize when inventory enters the market.
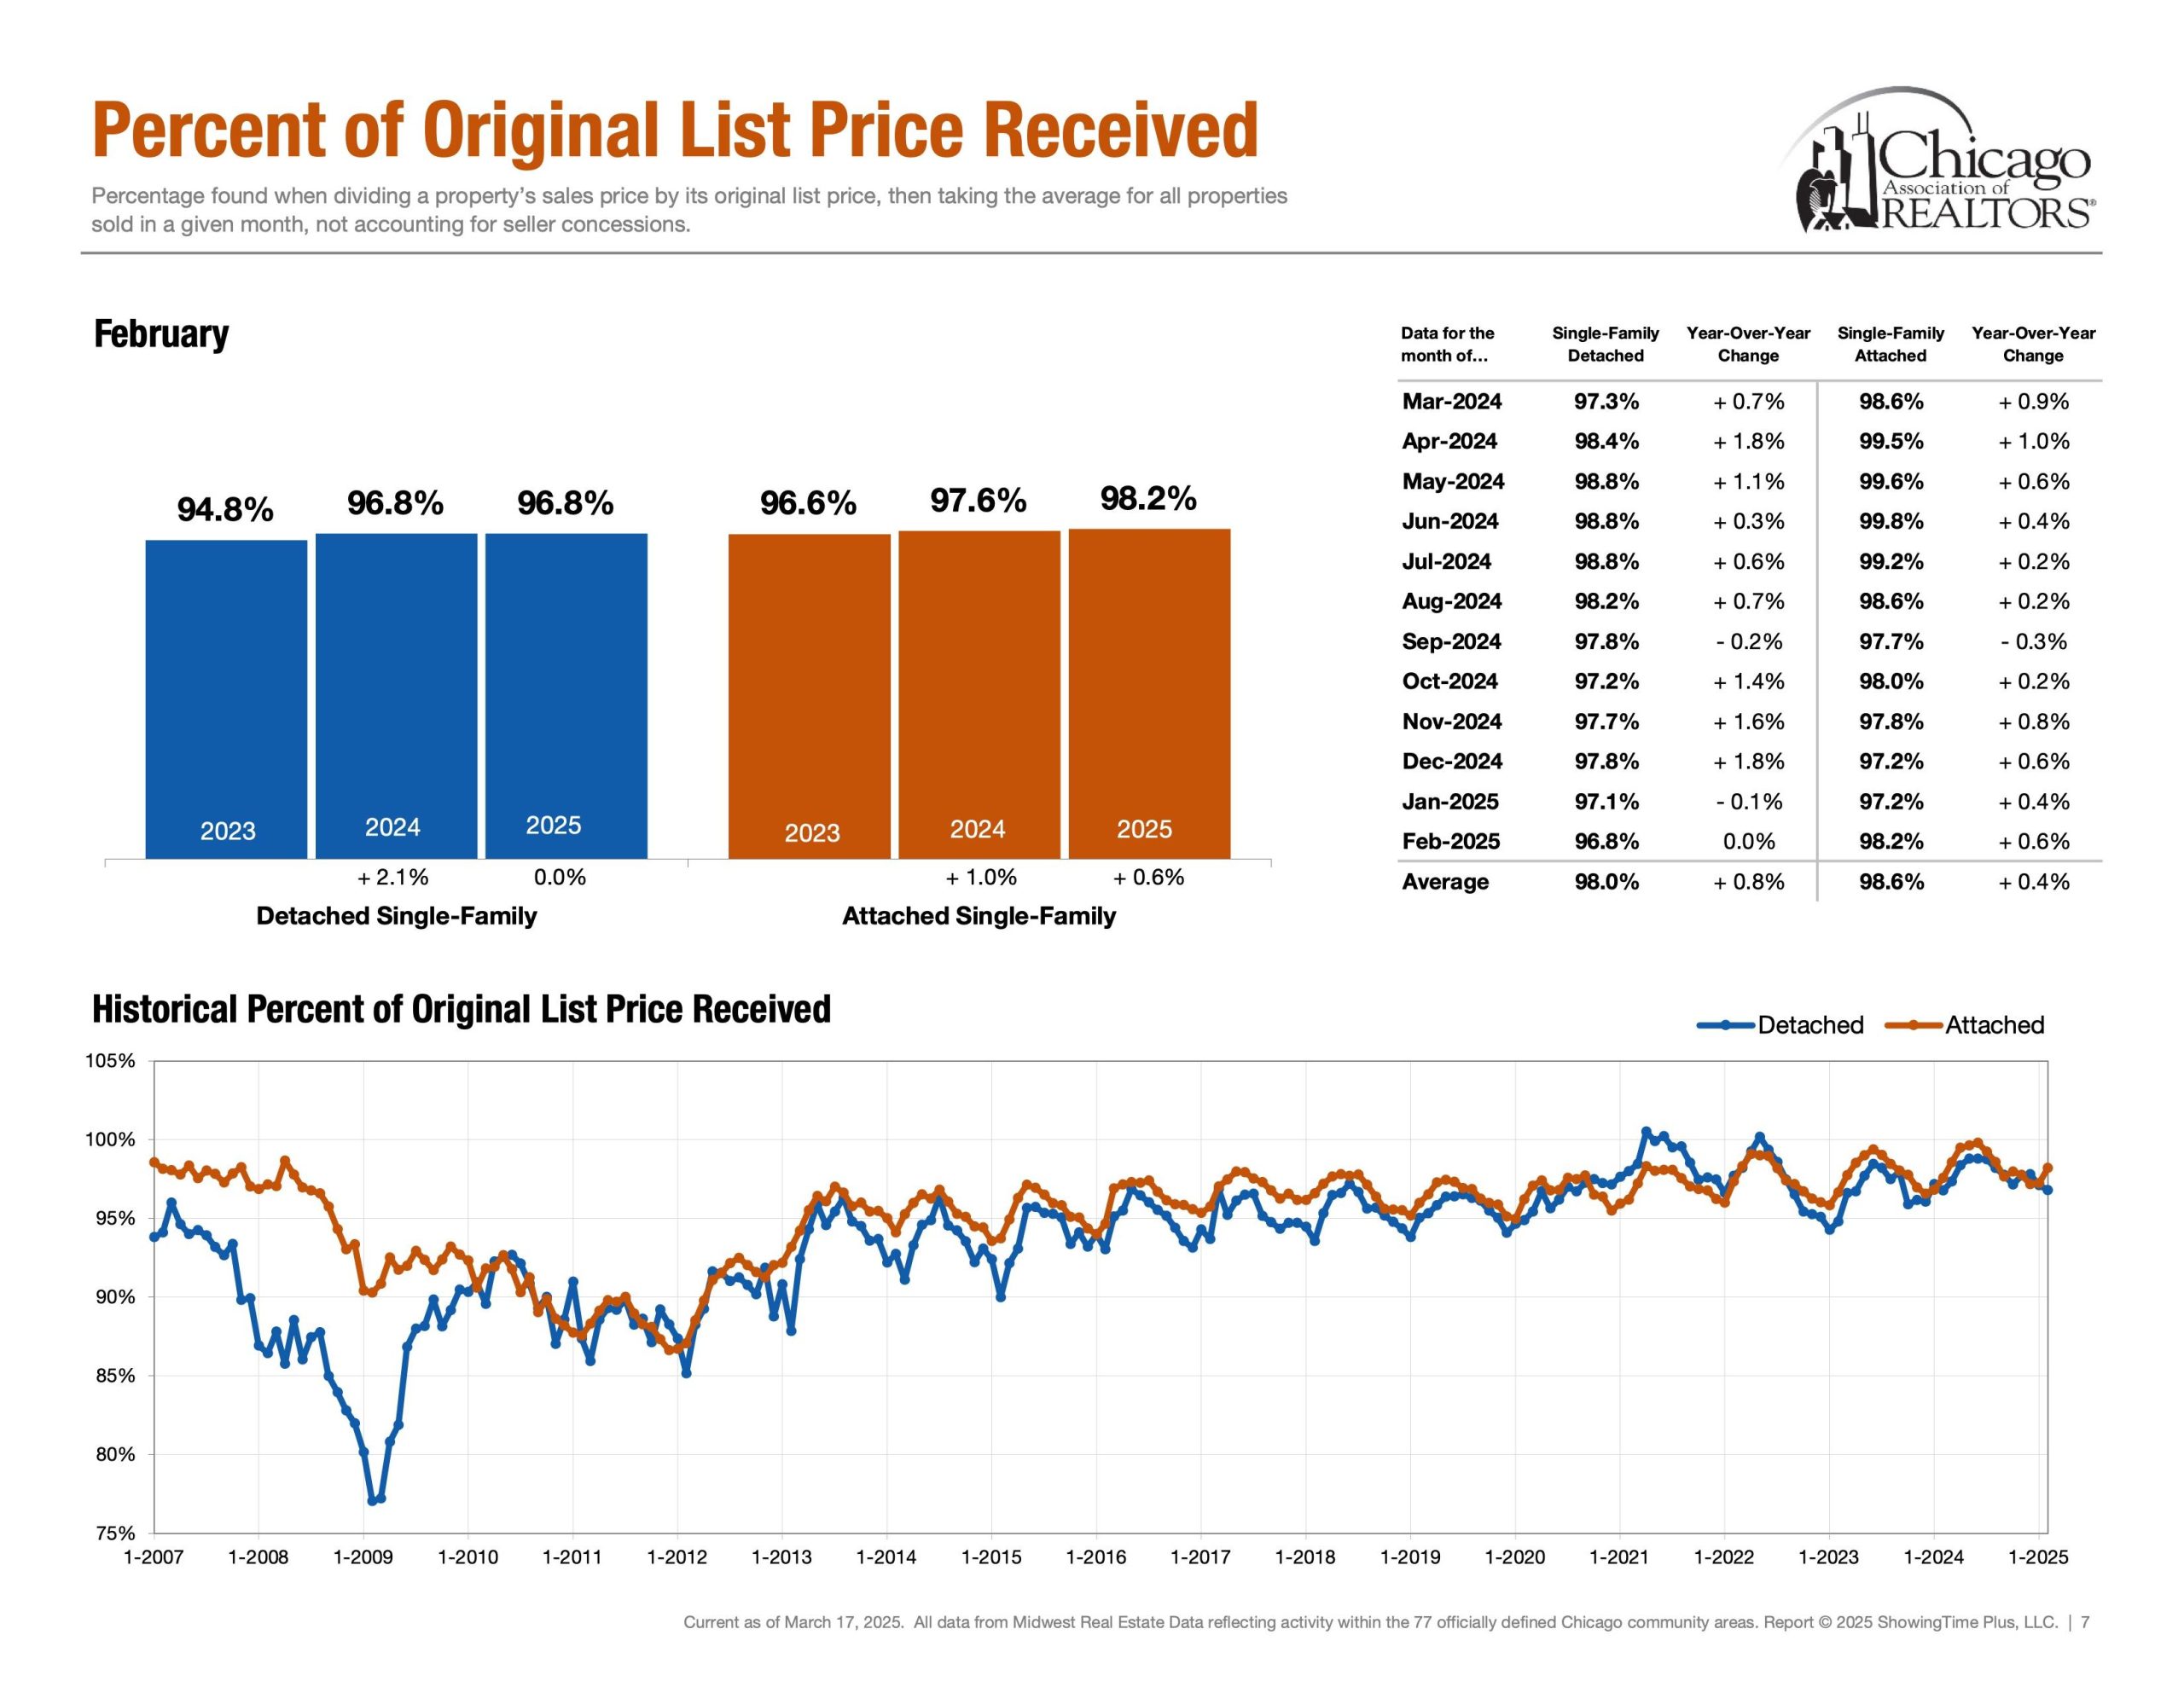
Negotiations | Percentage of Original List Price Received
Detached Single ~ 98% (Rolling 12 Months Avg) & ~ 96.8% (Feb 25′)
Attached Single ~ 98.6% (Rolling 12 Months Avg) & ~ 98.2% (Feb 25′)
Lastly, Percentage of Original List Price Received to Closed Price is a metric that showcases what the average accepted purchase price is relative to the list price. How much below asking price can an offer go while still getting accepted? How much would one have to offer above ask in order to be an above average purchase price?
The End | Have A Great Day!
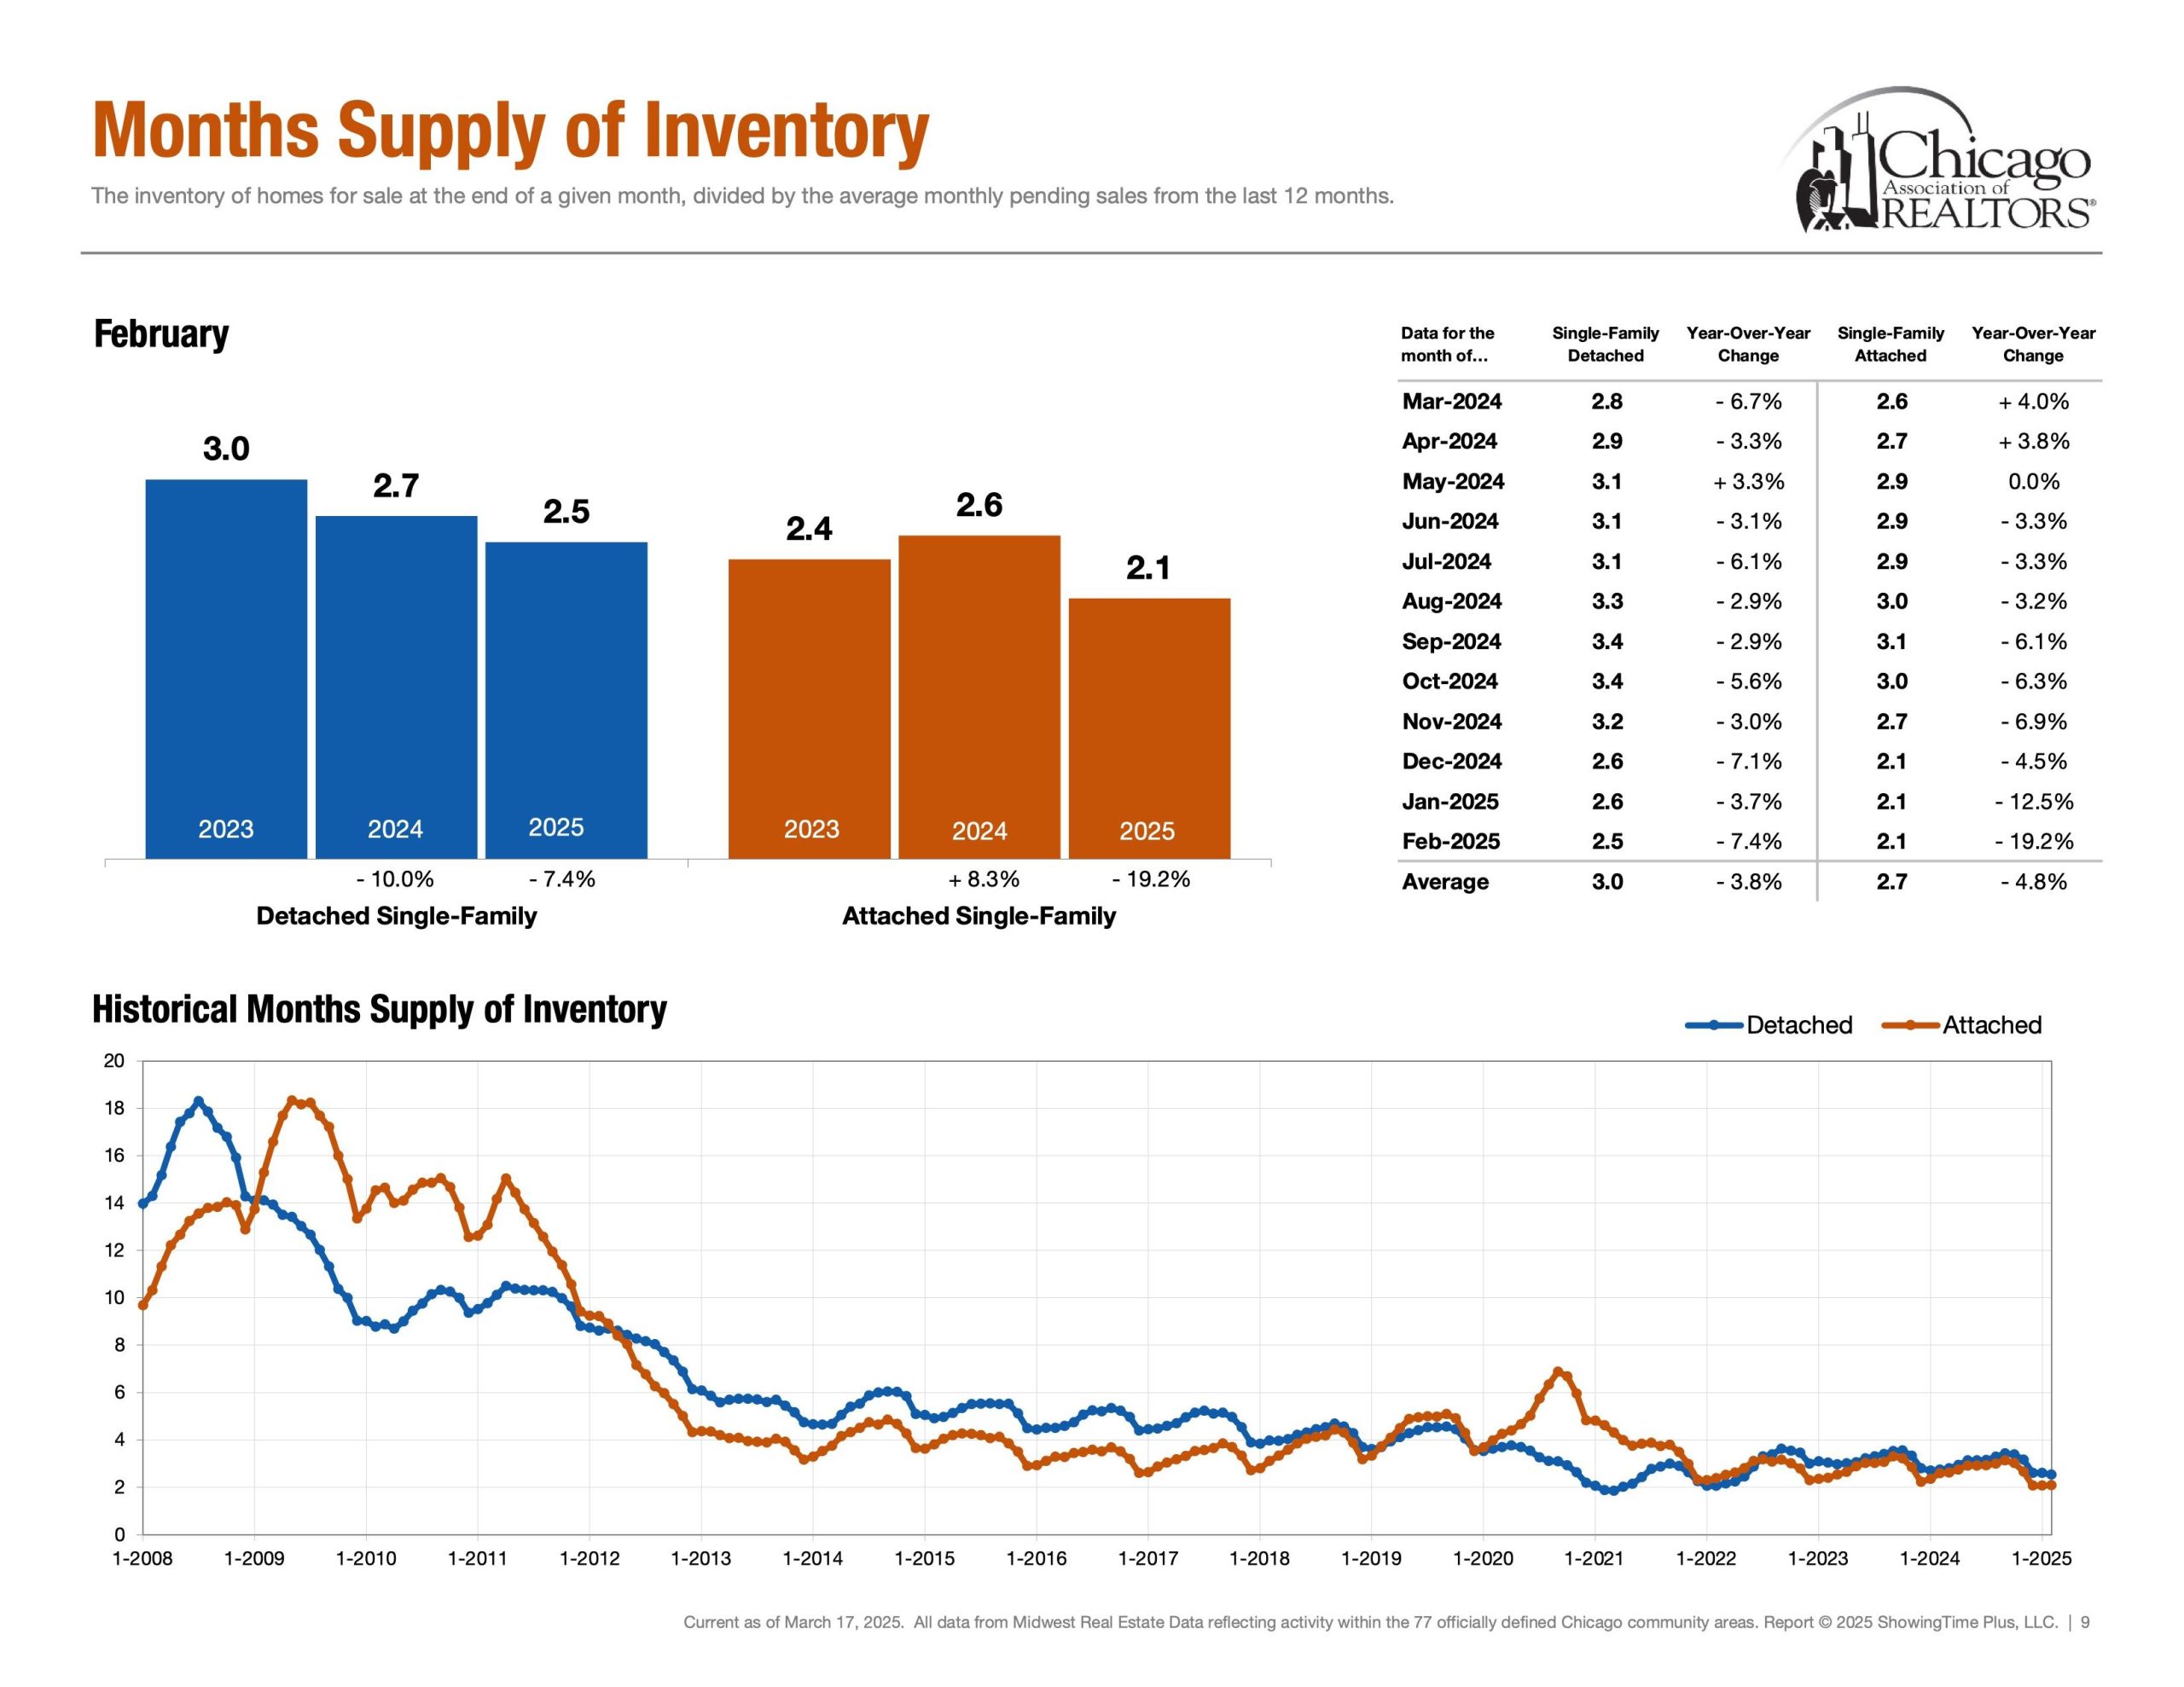
Please note all of these metrics are along a spectrum as opposed to a specific number. Below is “The Weekly Market Activity Report” which is a research tool reflecting residential real estate activity within the 77 officially defined Chicago community areas provided by the Chicago Association of Realtors®. It is essential to keep in mind that real estate markets can vary across neighborhoods and property types within a city. In conclusion, economic conditions and external factors can influence market trends. Staying updated on these metrics and trends is crucial for making informed decisions.