How Is The Chicago Real Estate Market? November 18, 2024

How Is the Chicago Real Estate Market? Week 46

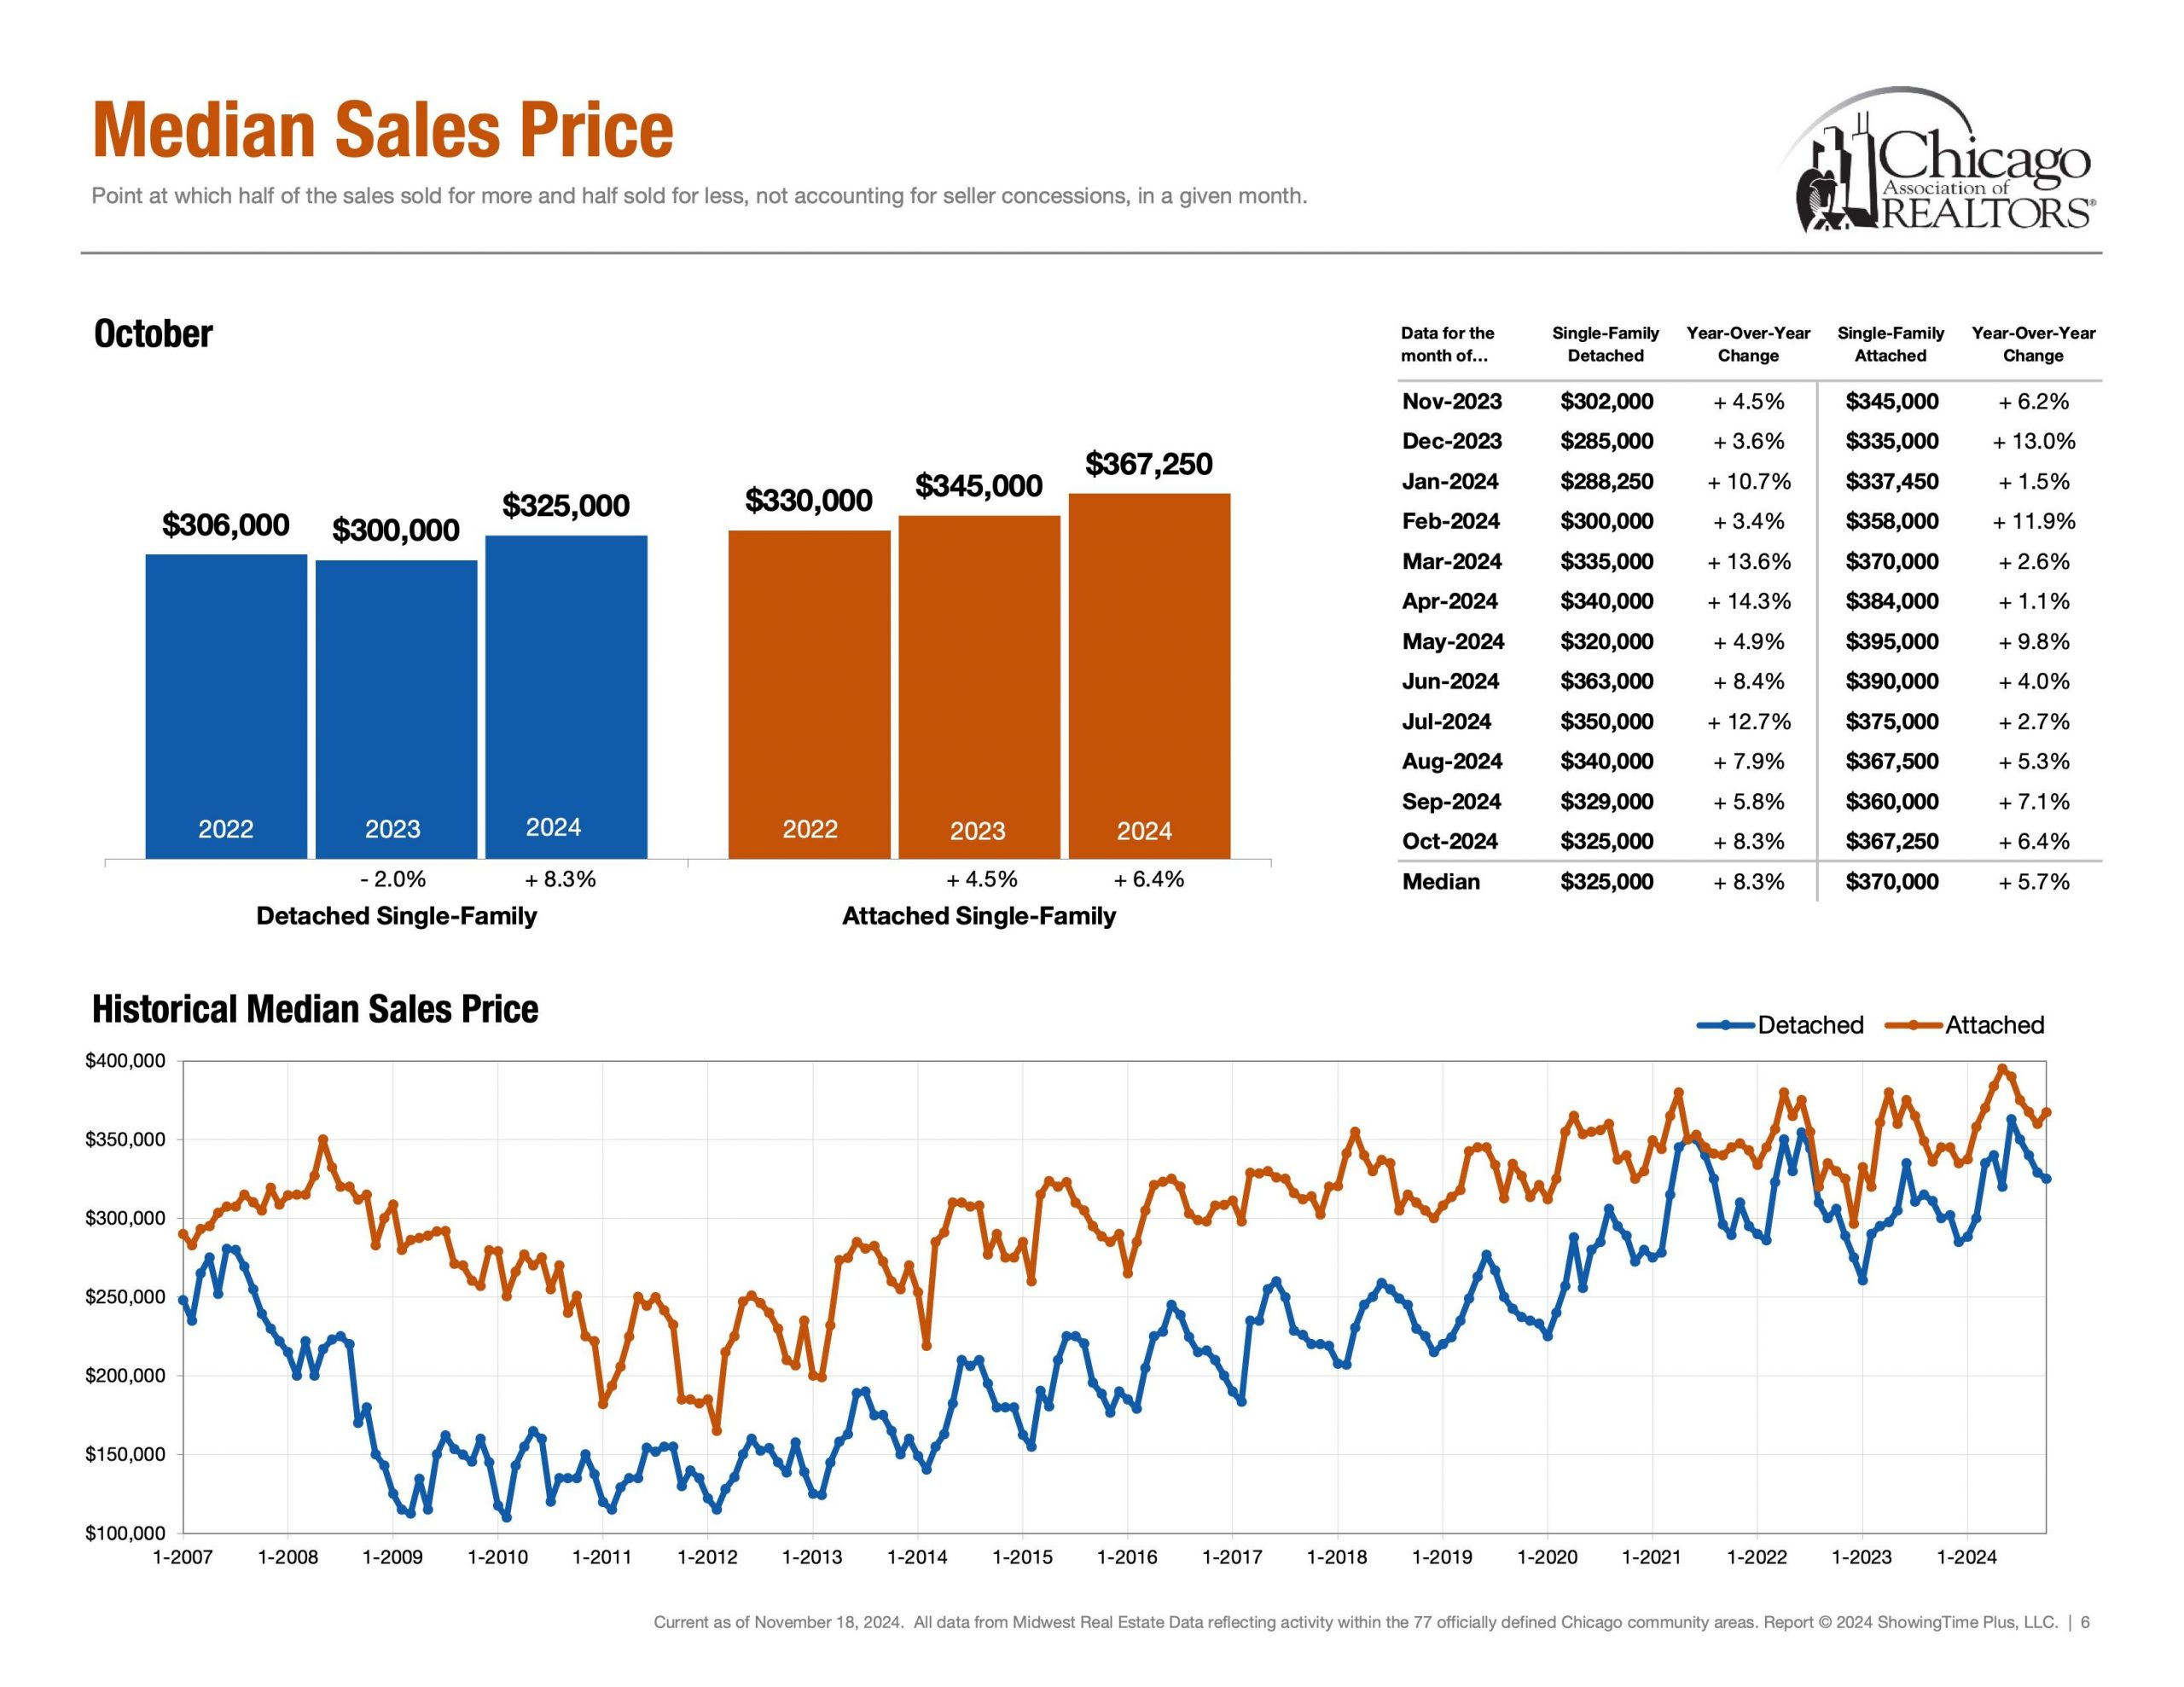
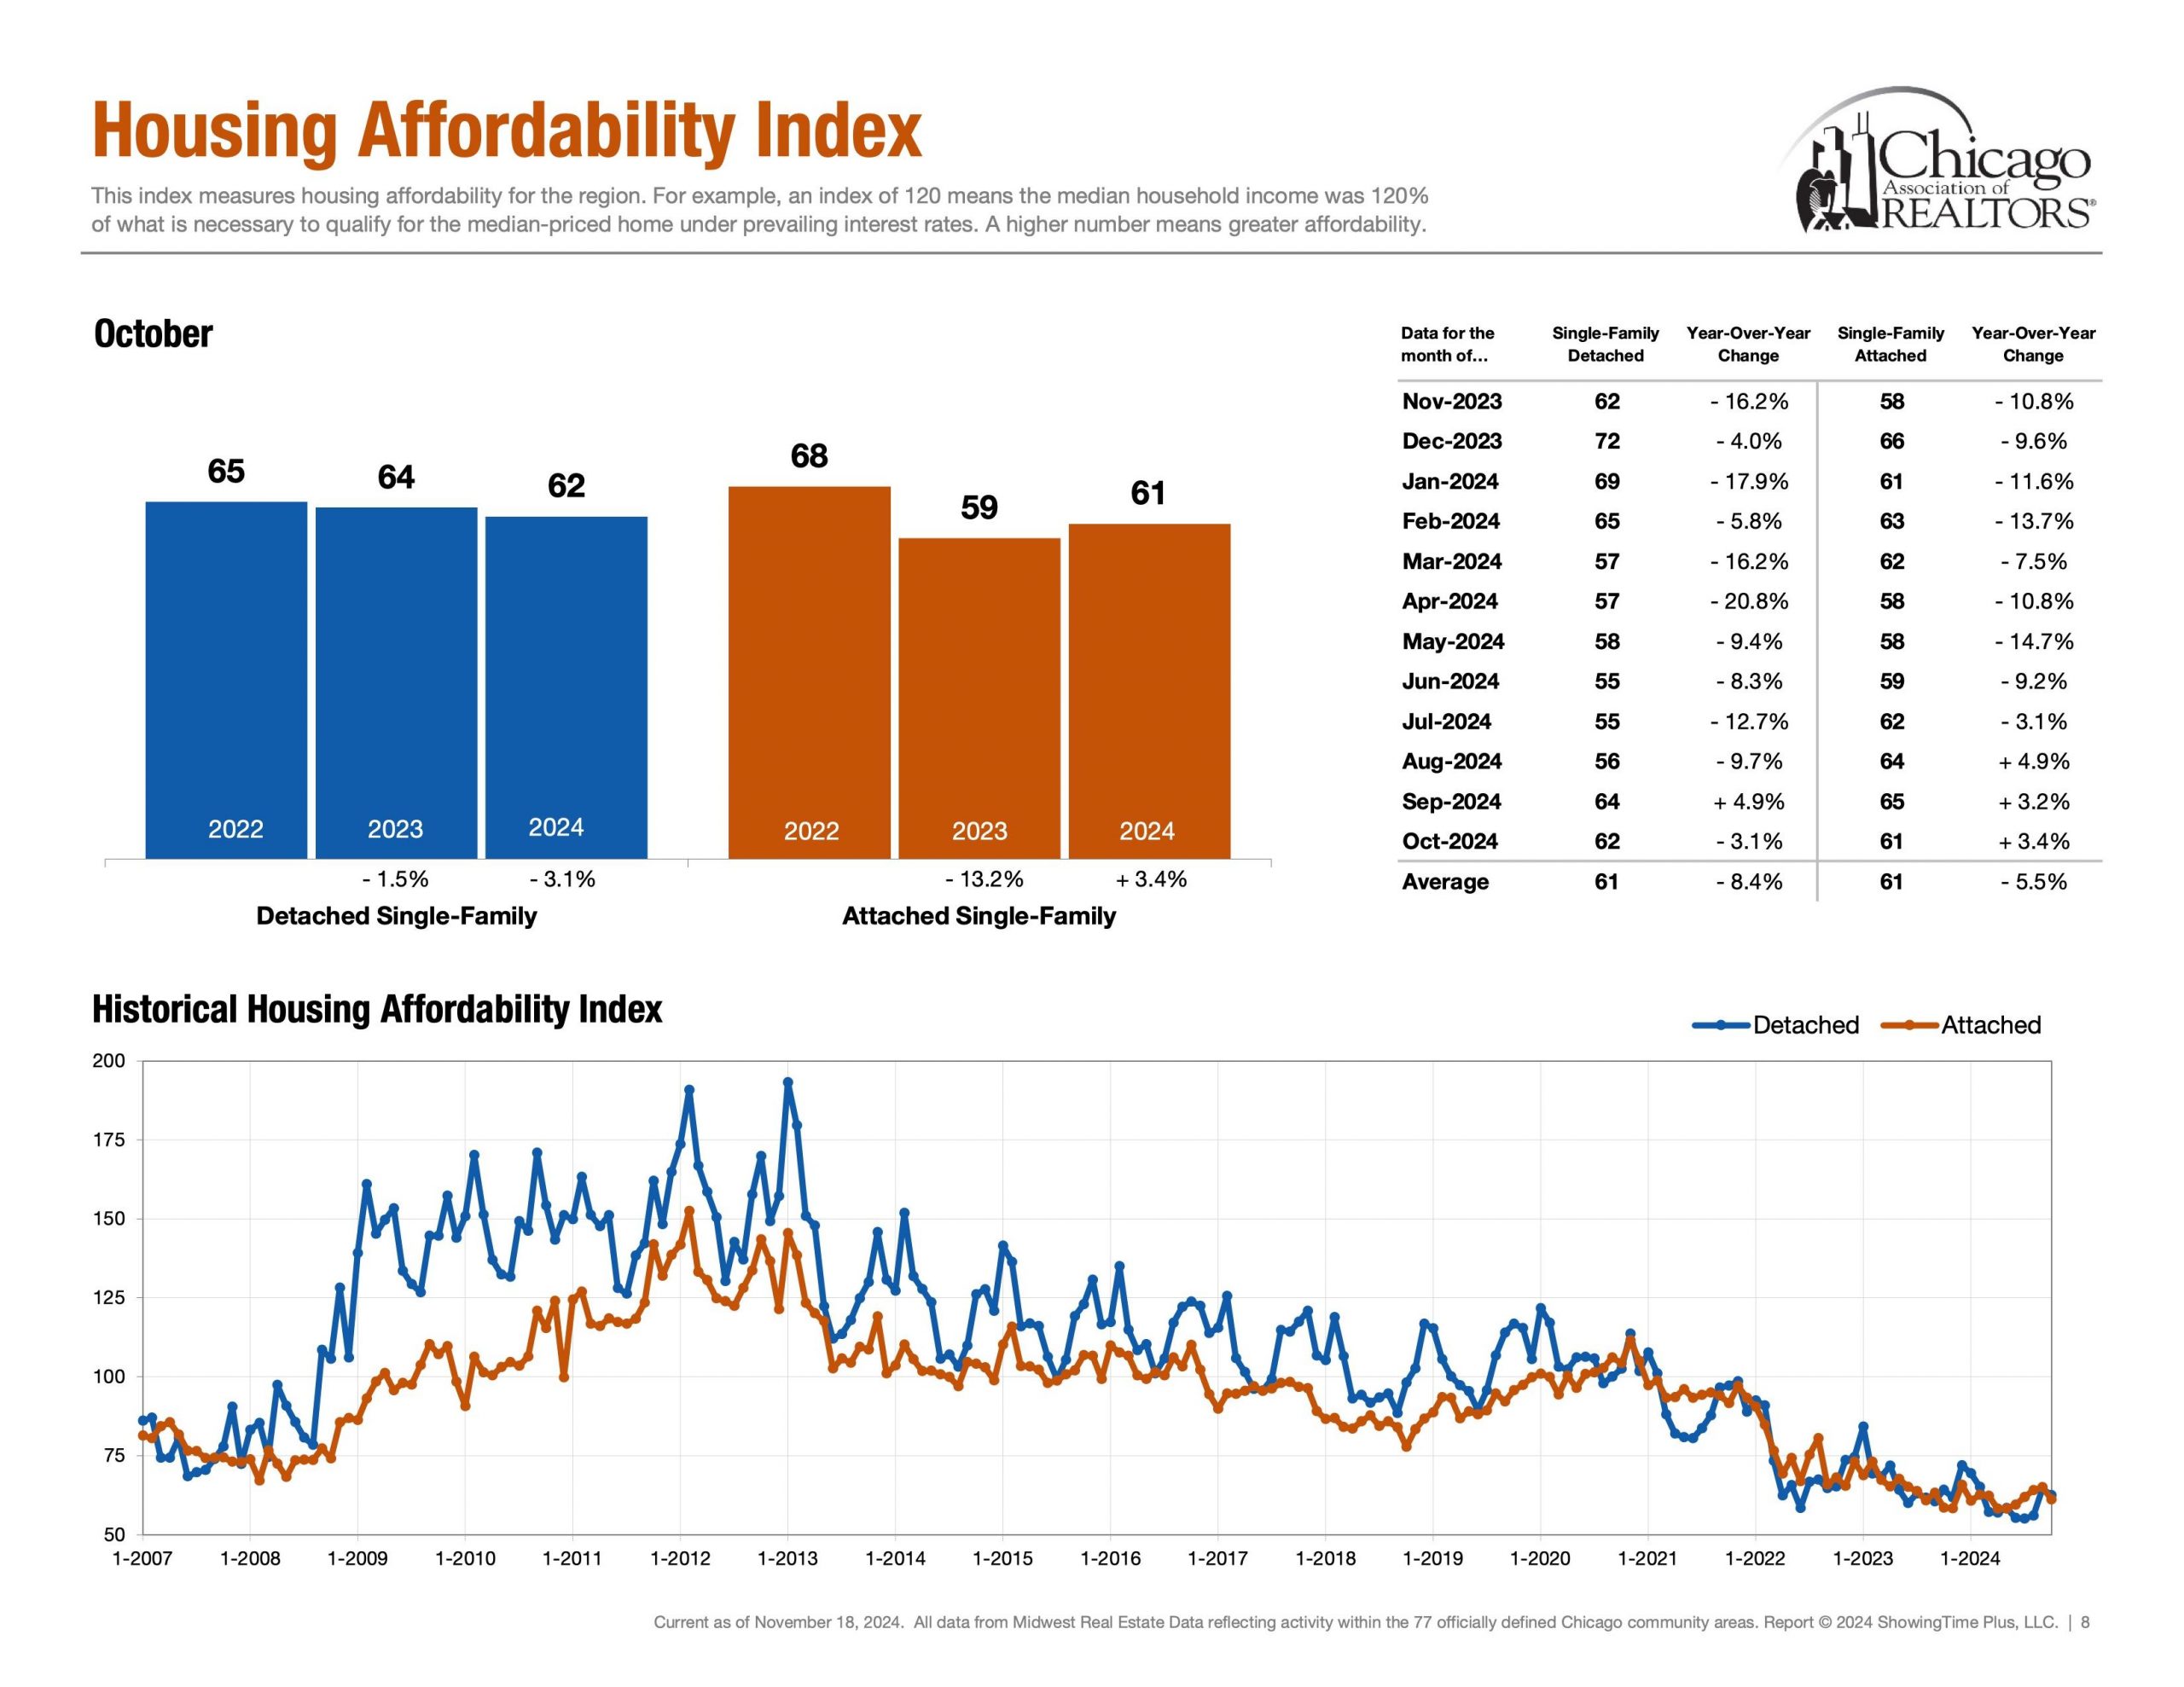
November 2024 Week 46

Matthew Litzenberger a third generation Realtor with Coldwell Banker Realty helps buyers and sellers understand Chicago Real Estate Market metrics. Follow along for weekly updates on all things Chicago Real Estate by clicking here.


Introduction

Hello and welcome back to the 46th installment in our weekly series aimed to help understand current Chicago Real Estate Market Metrics. While there are many metrics to talk about in the world of real estate, today we are going to look at only four: speed, demand, supply and negotiations. Let’s get started!


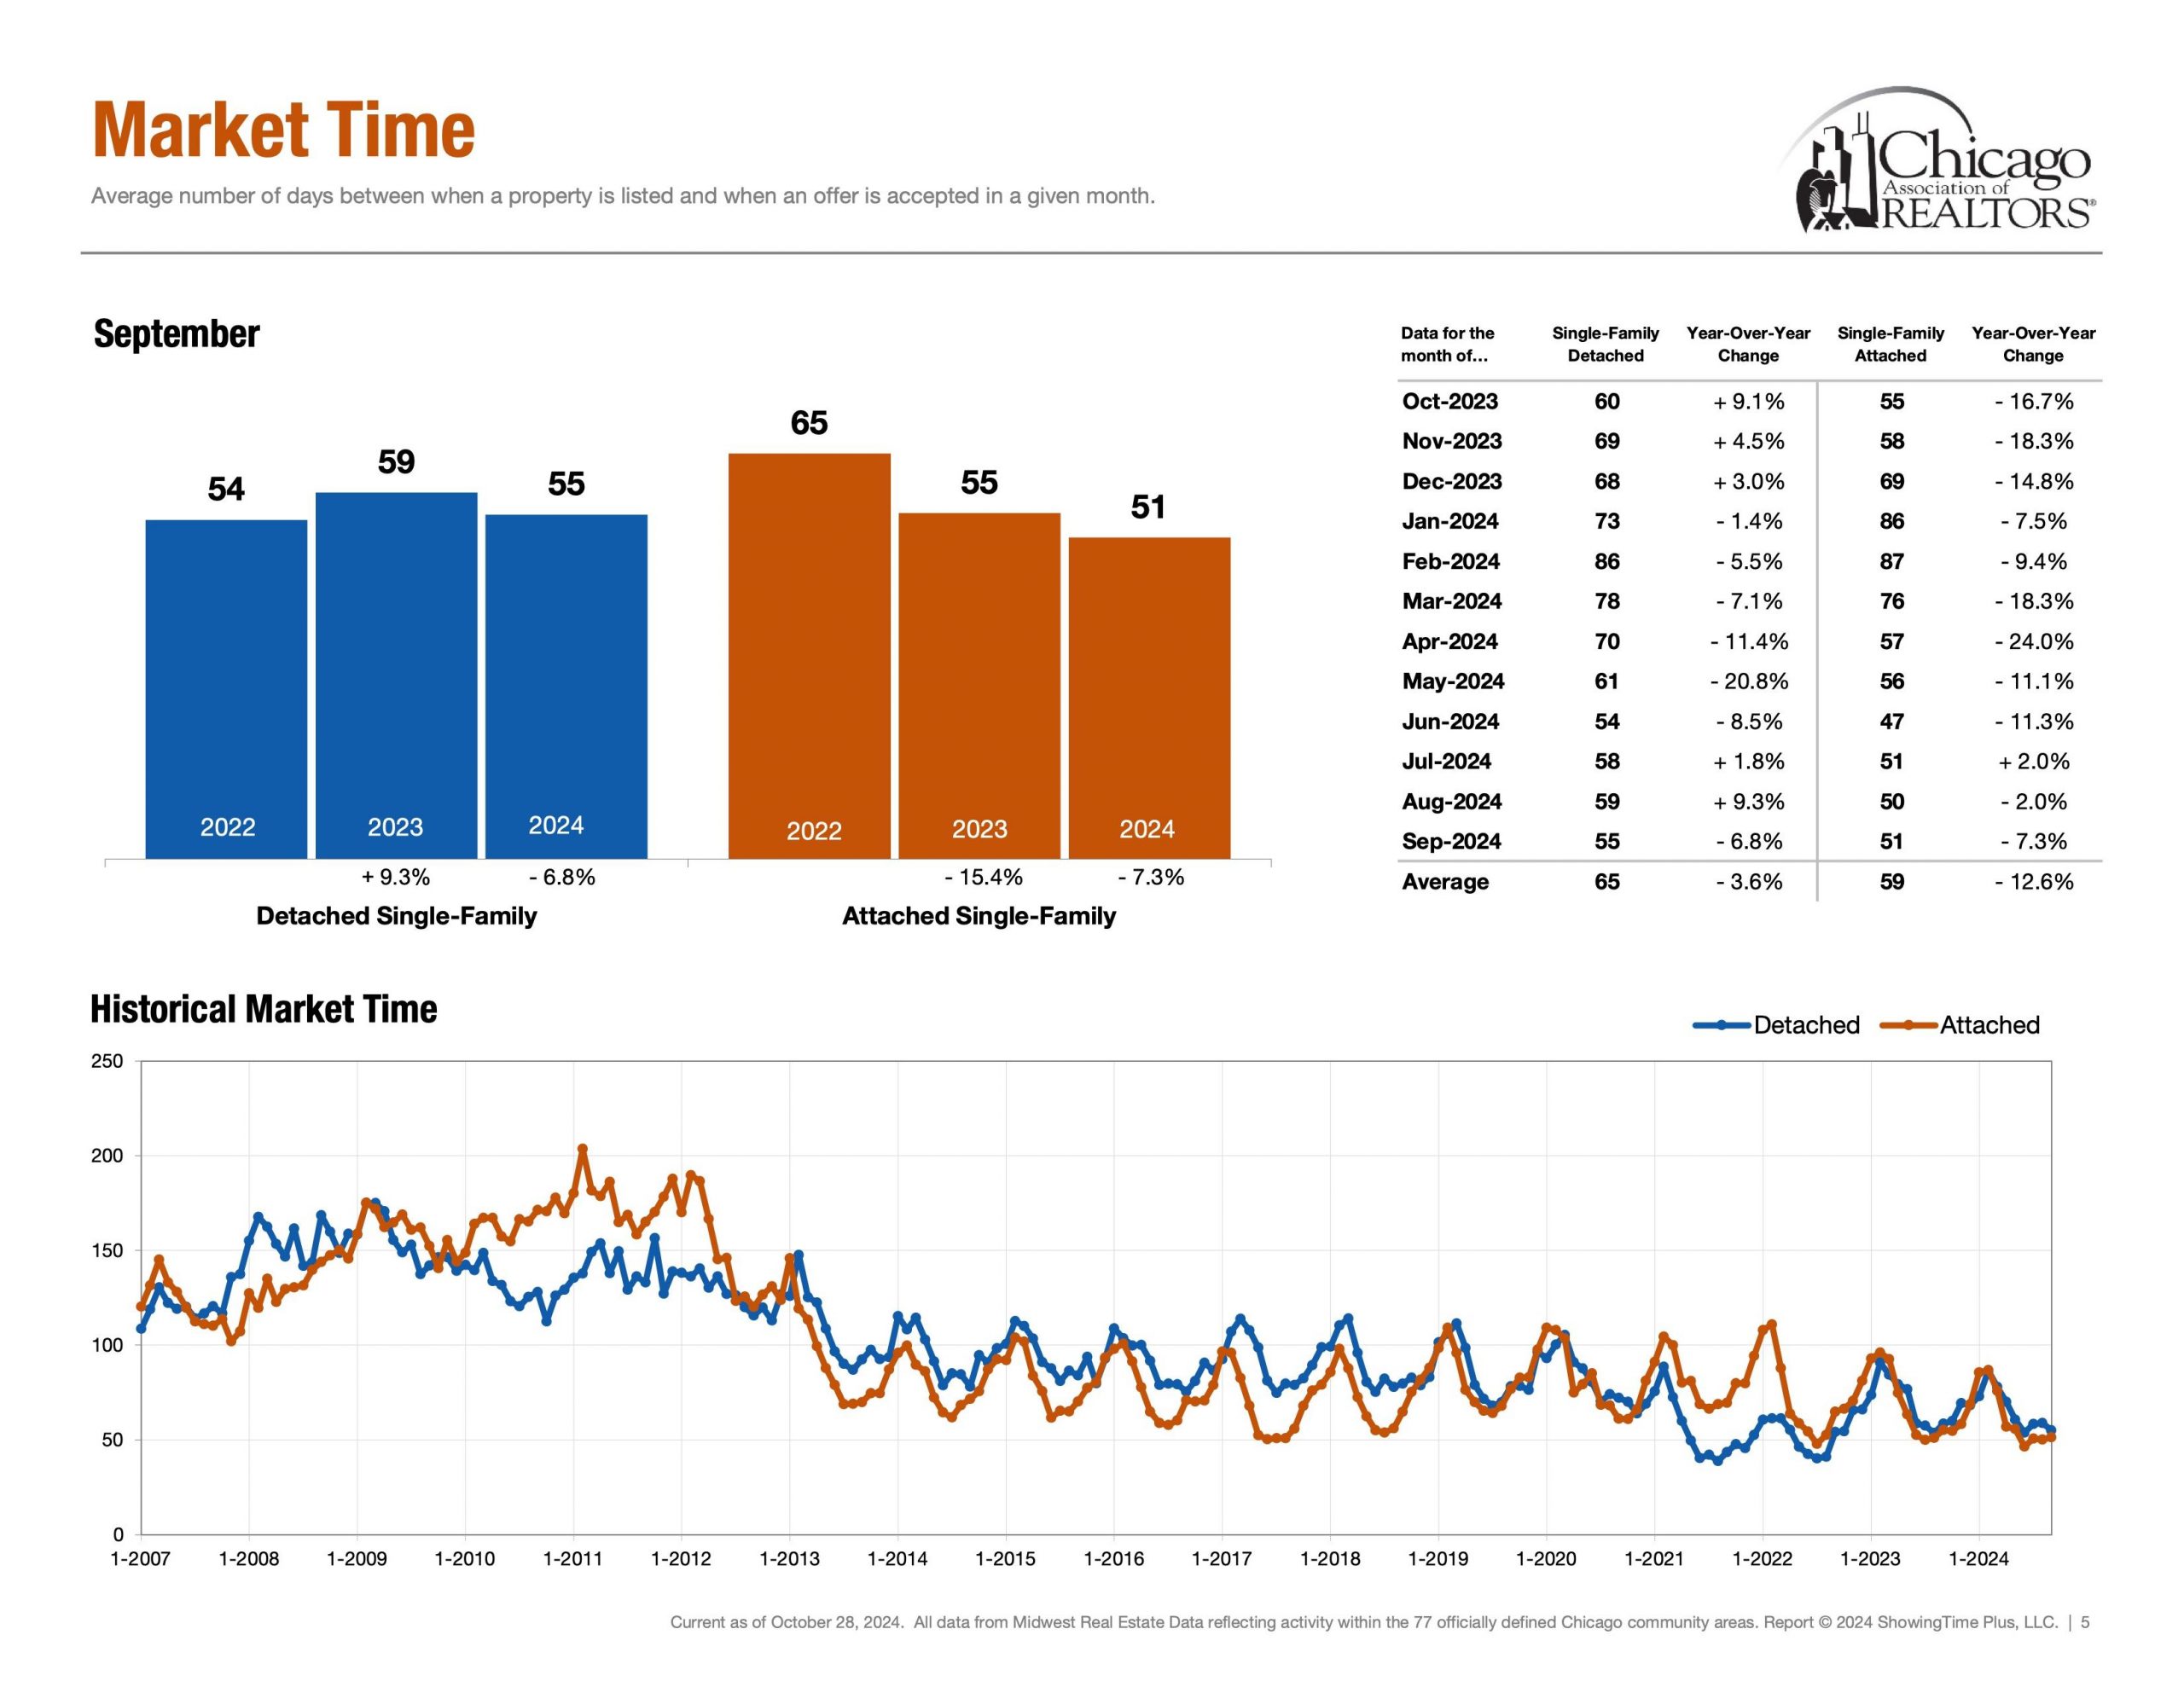
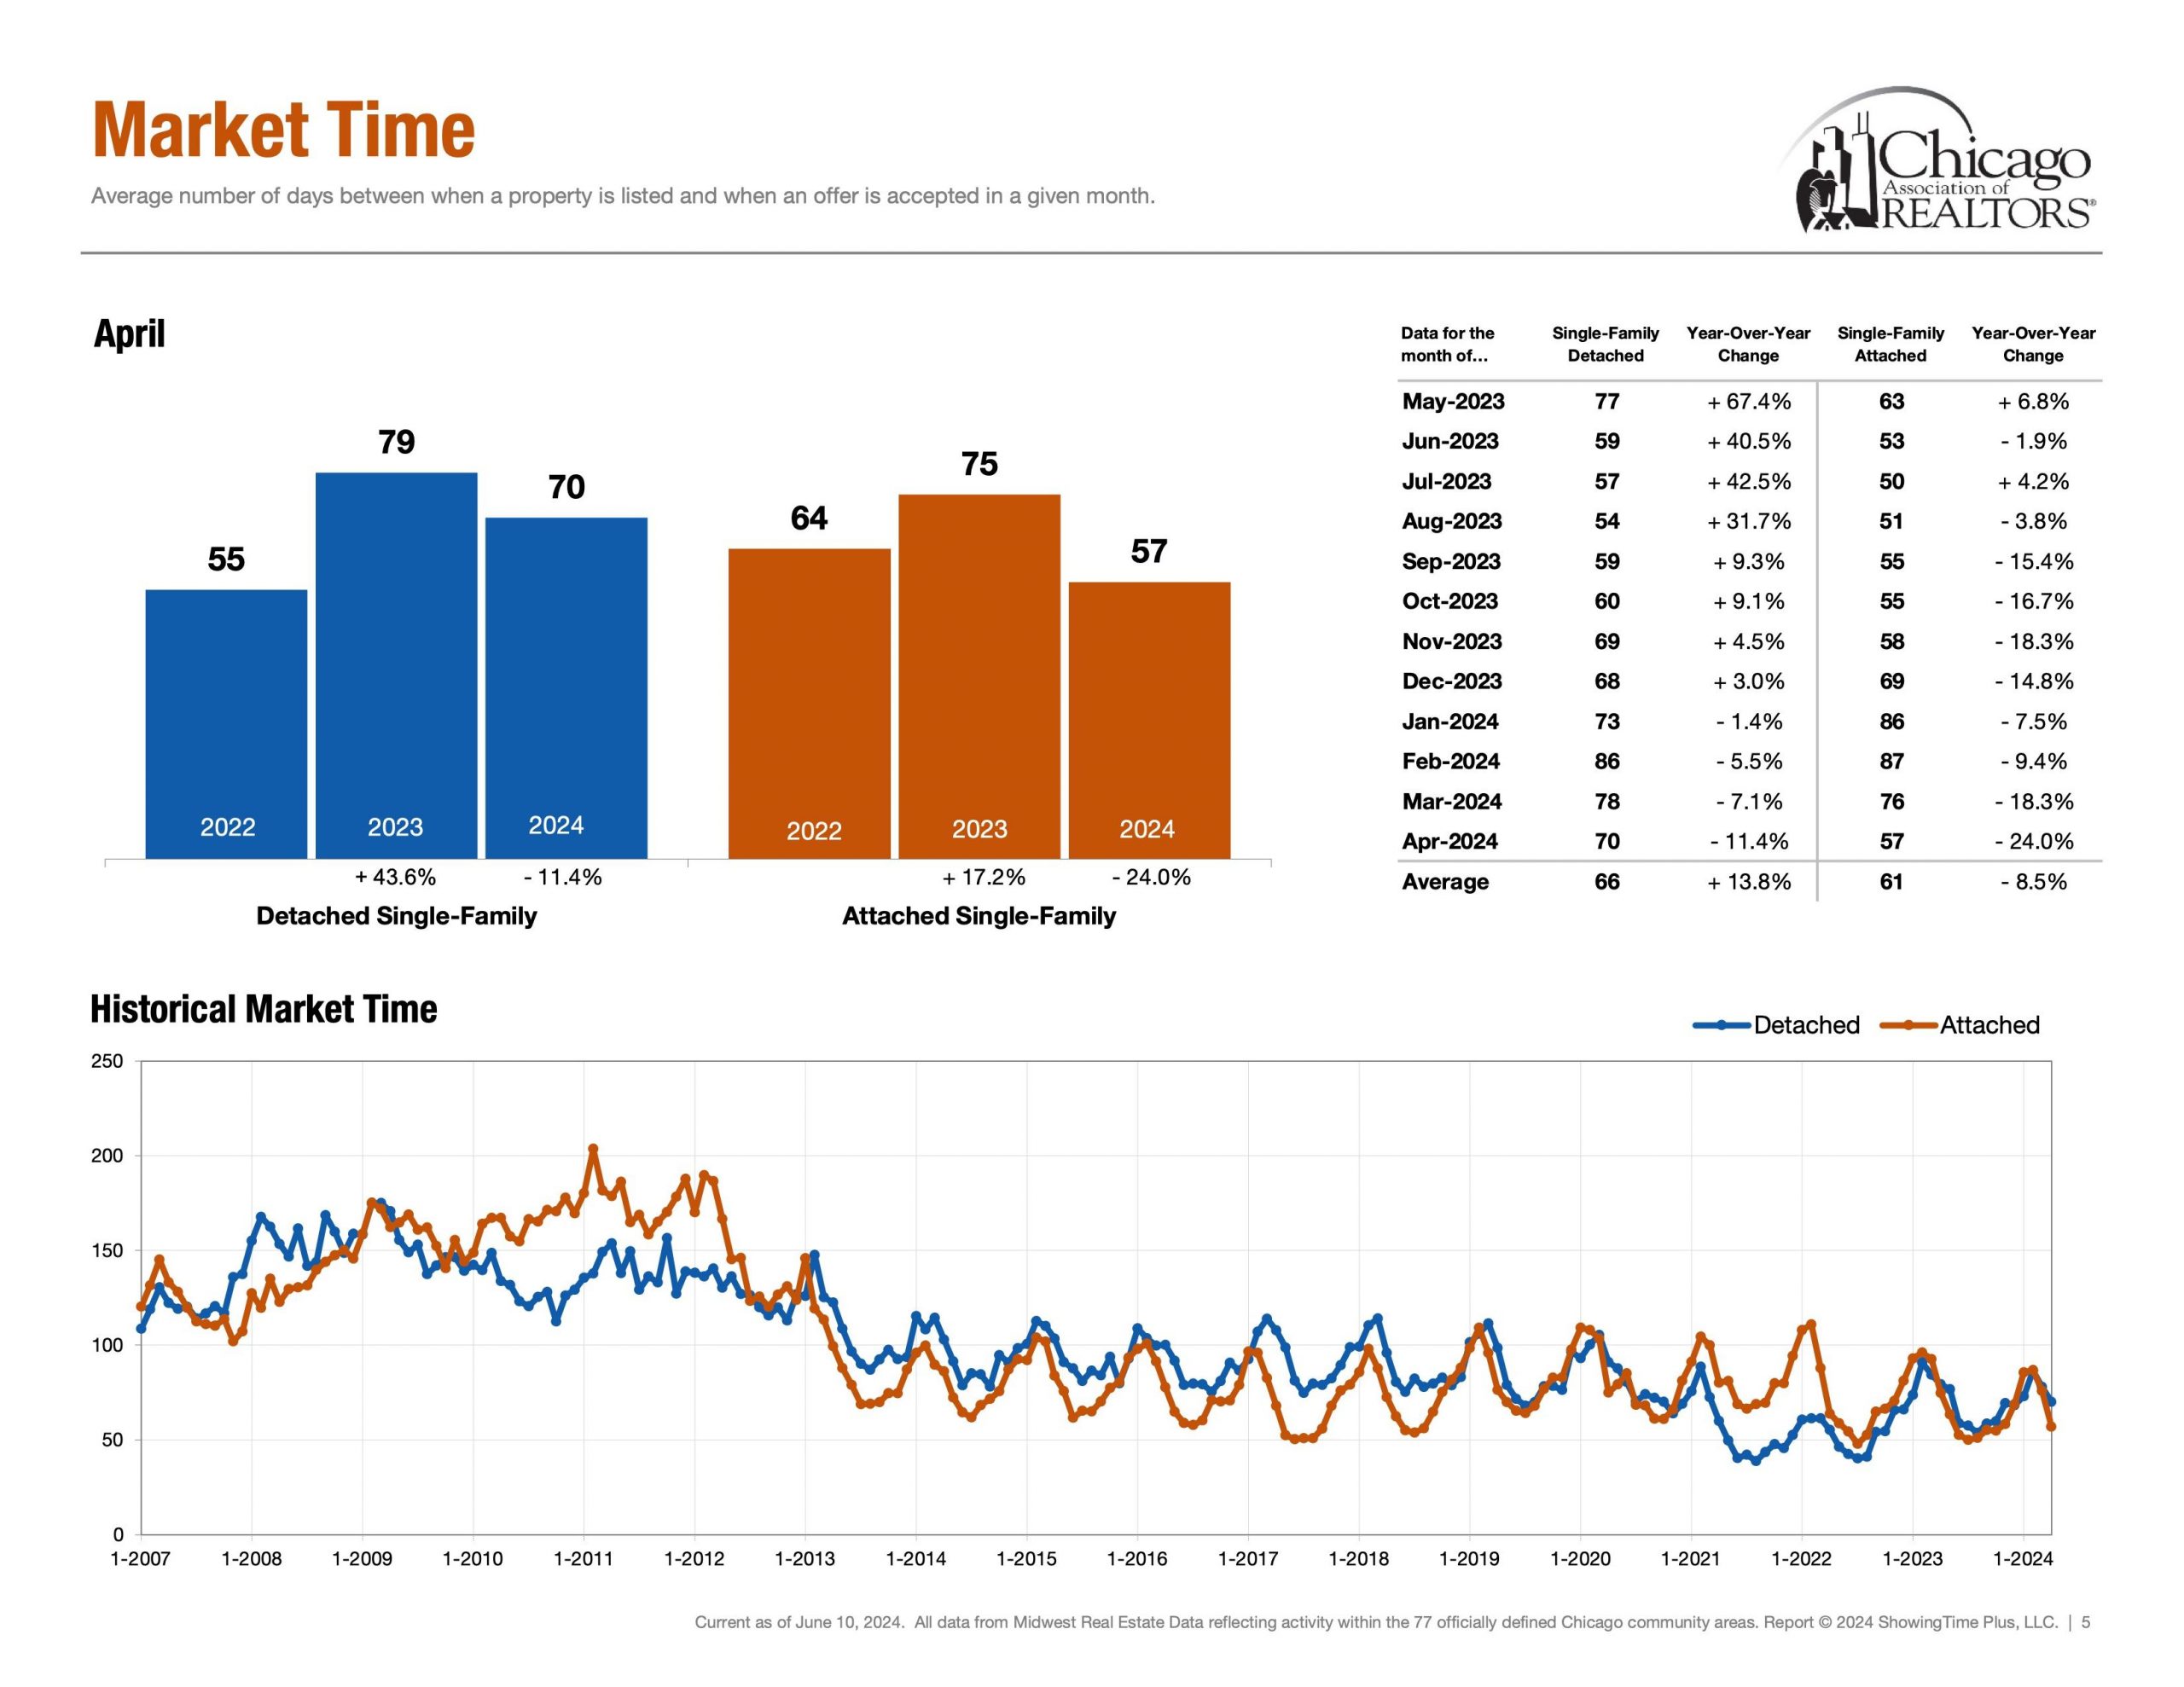
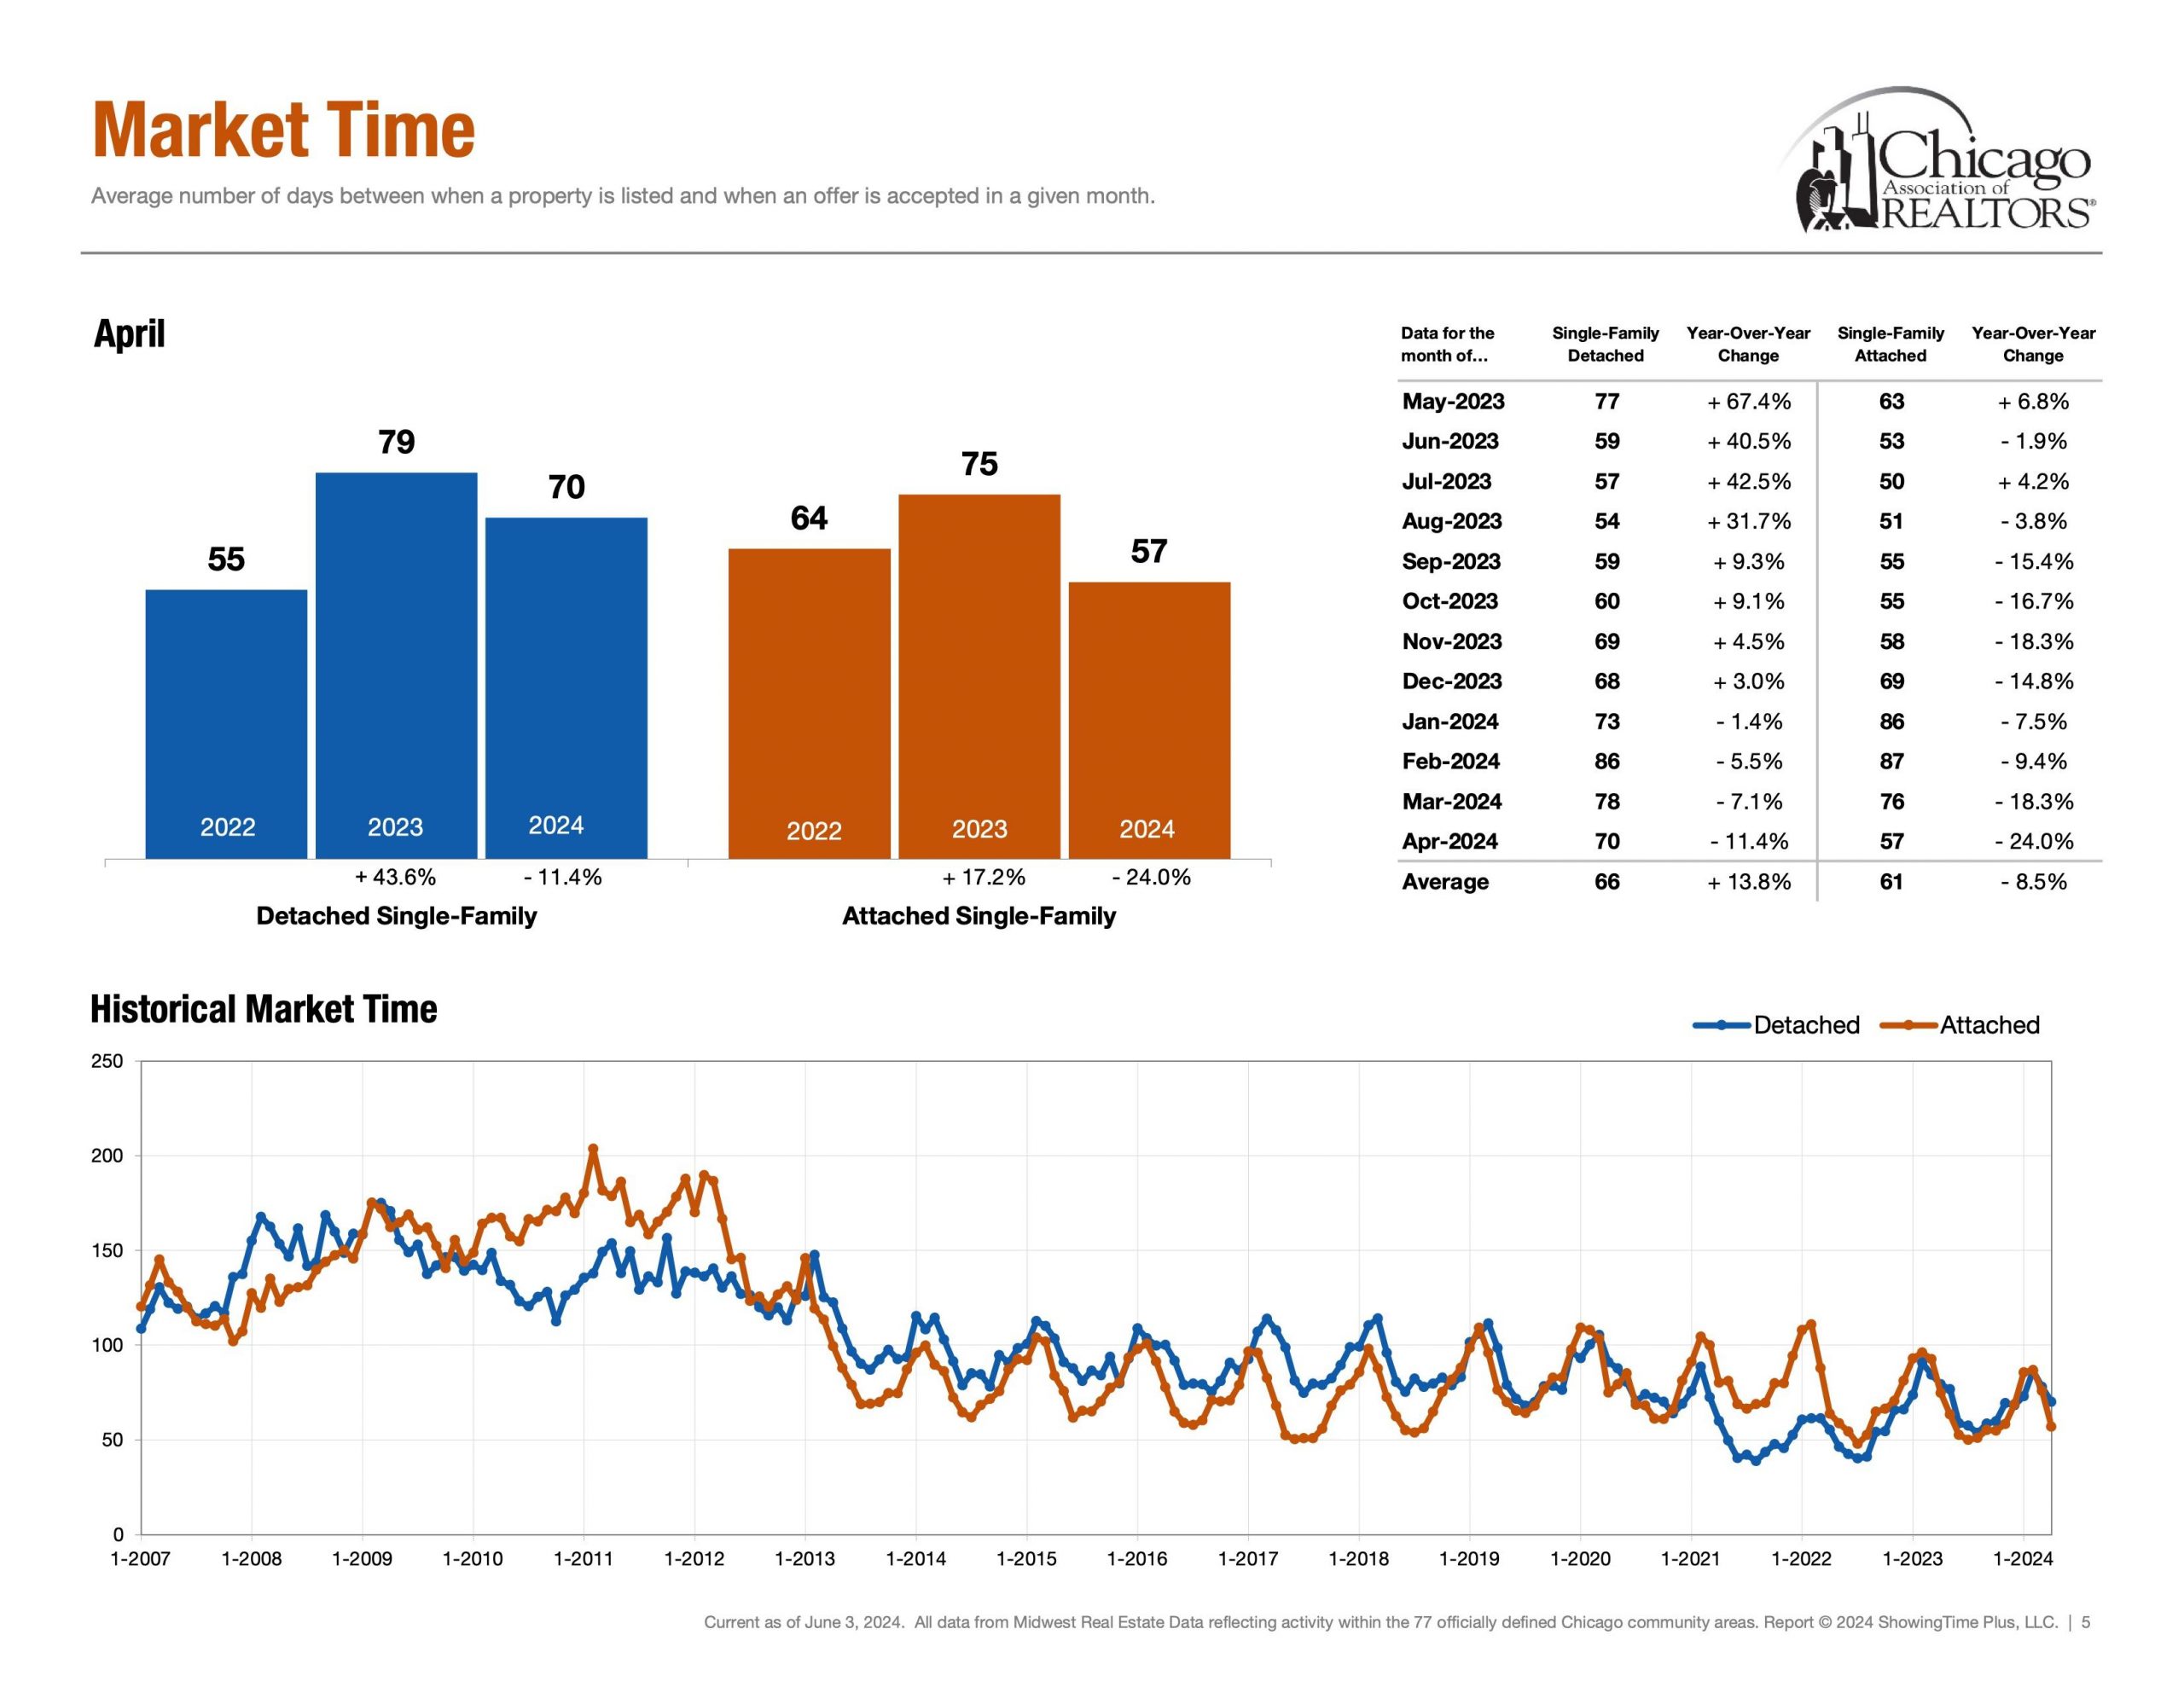
Speed | Healthy Market Time Range


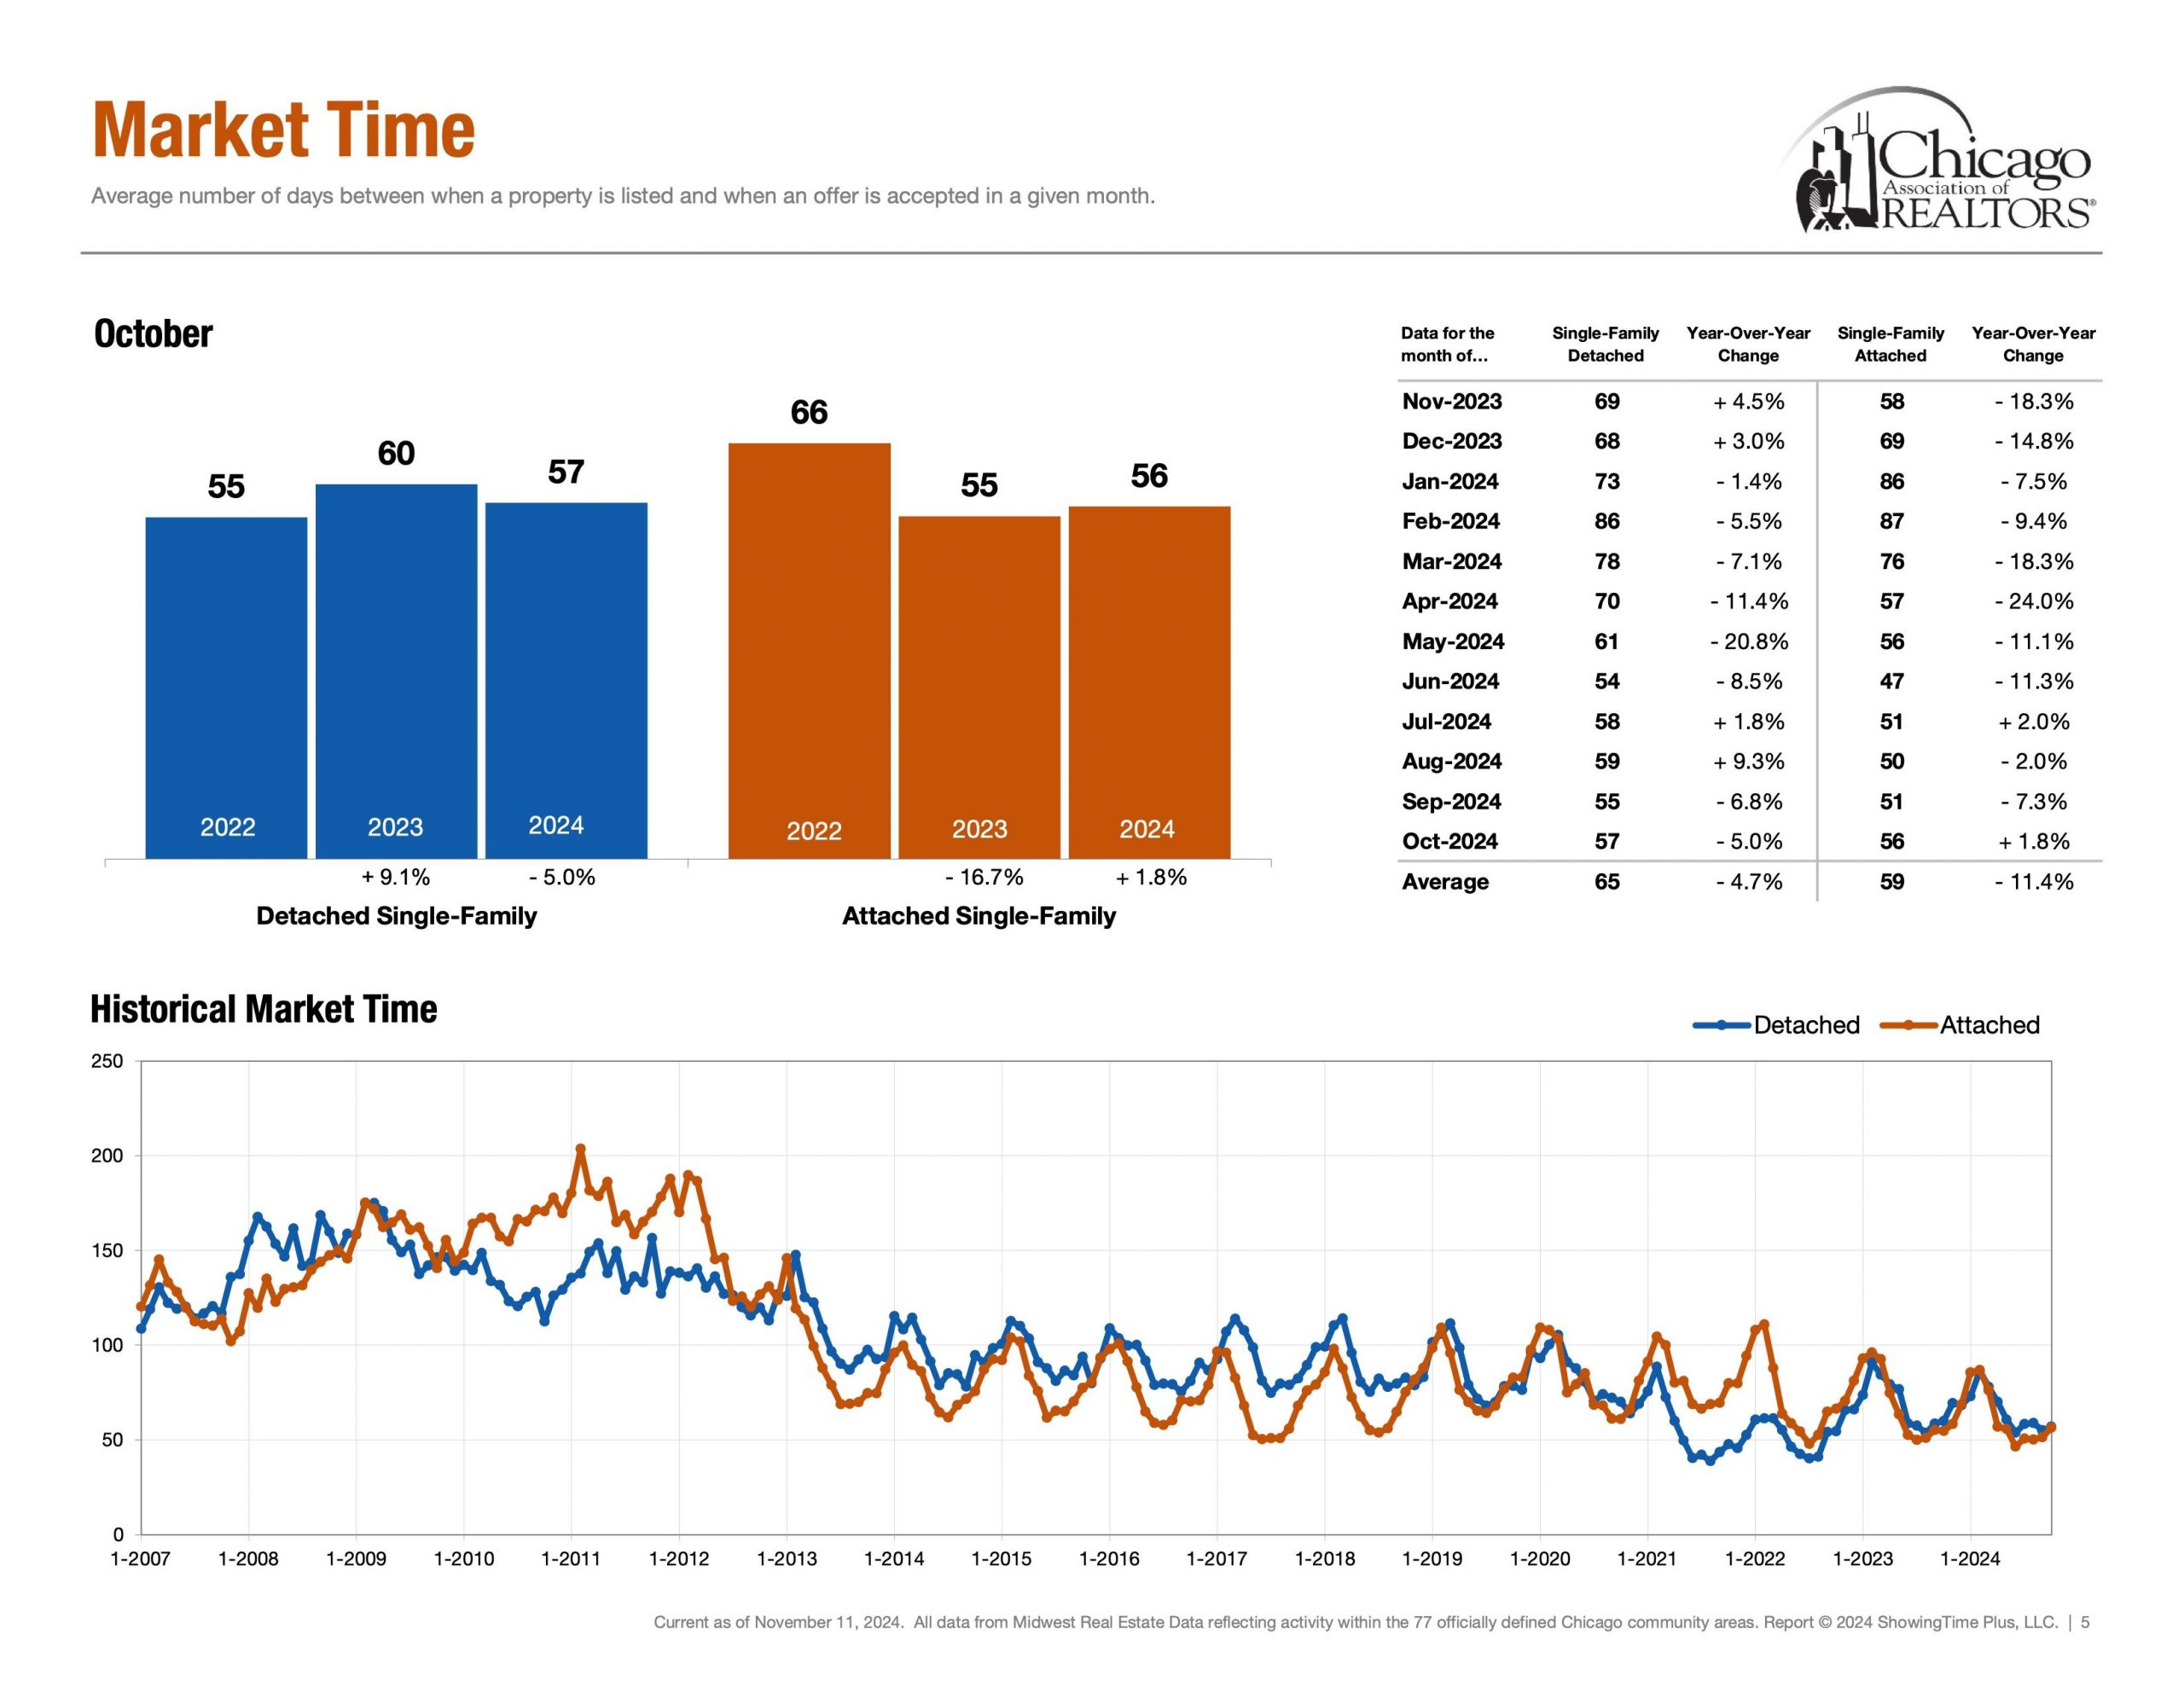
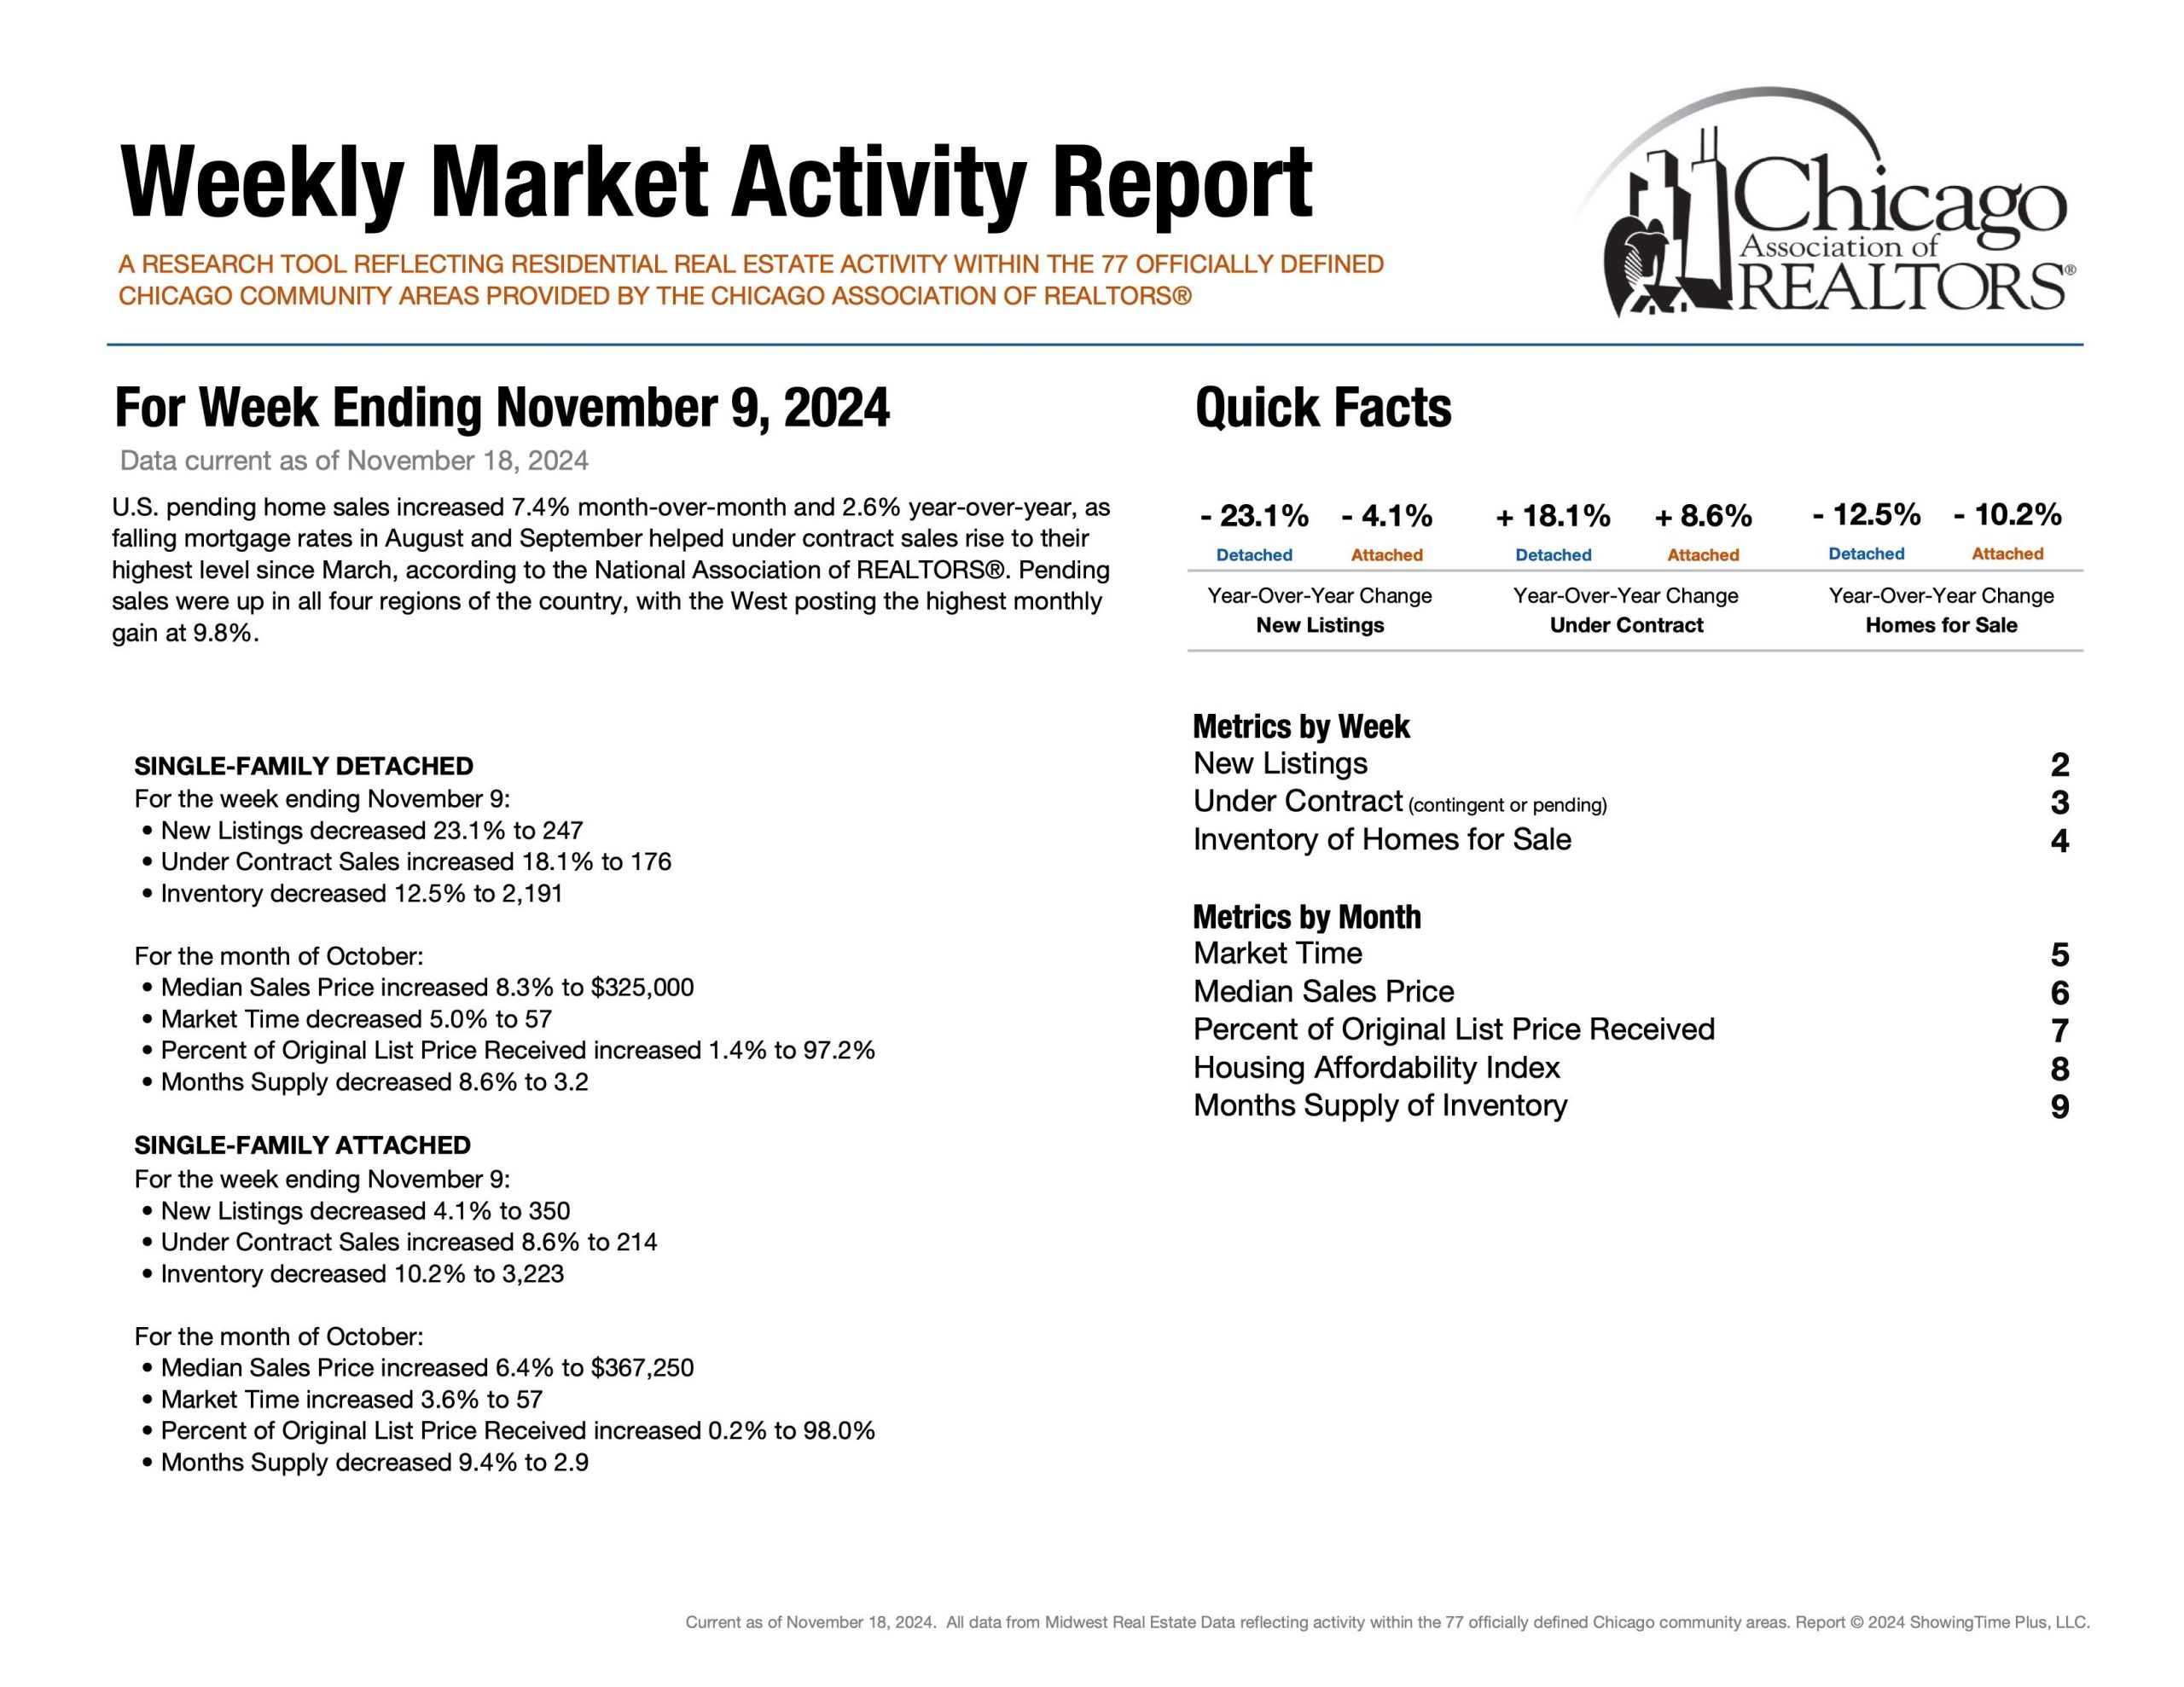
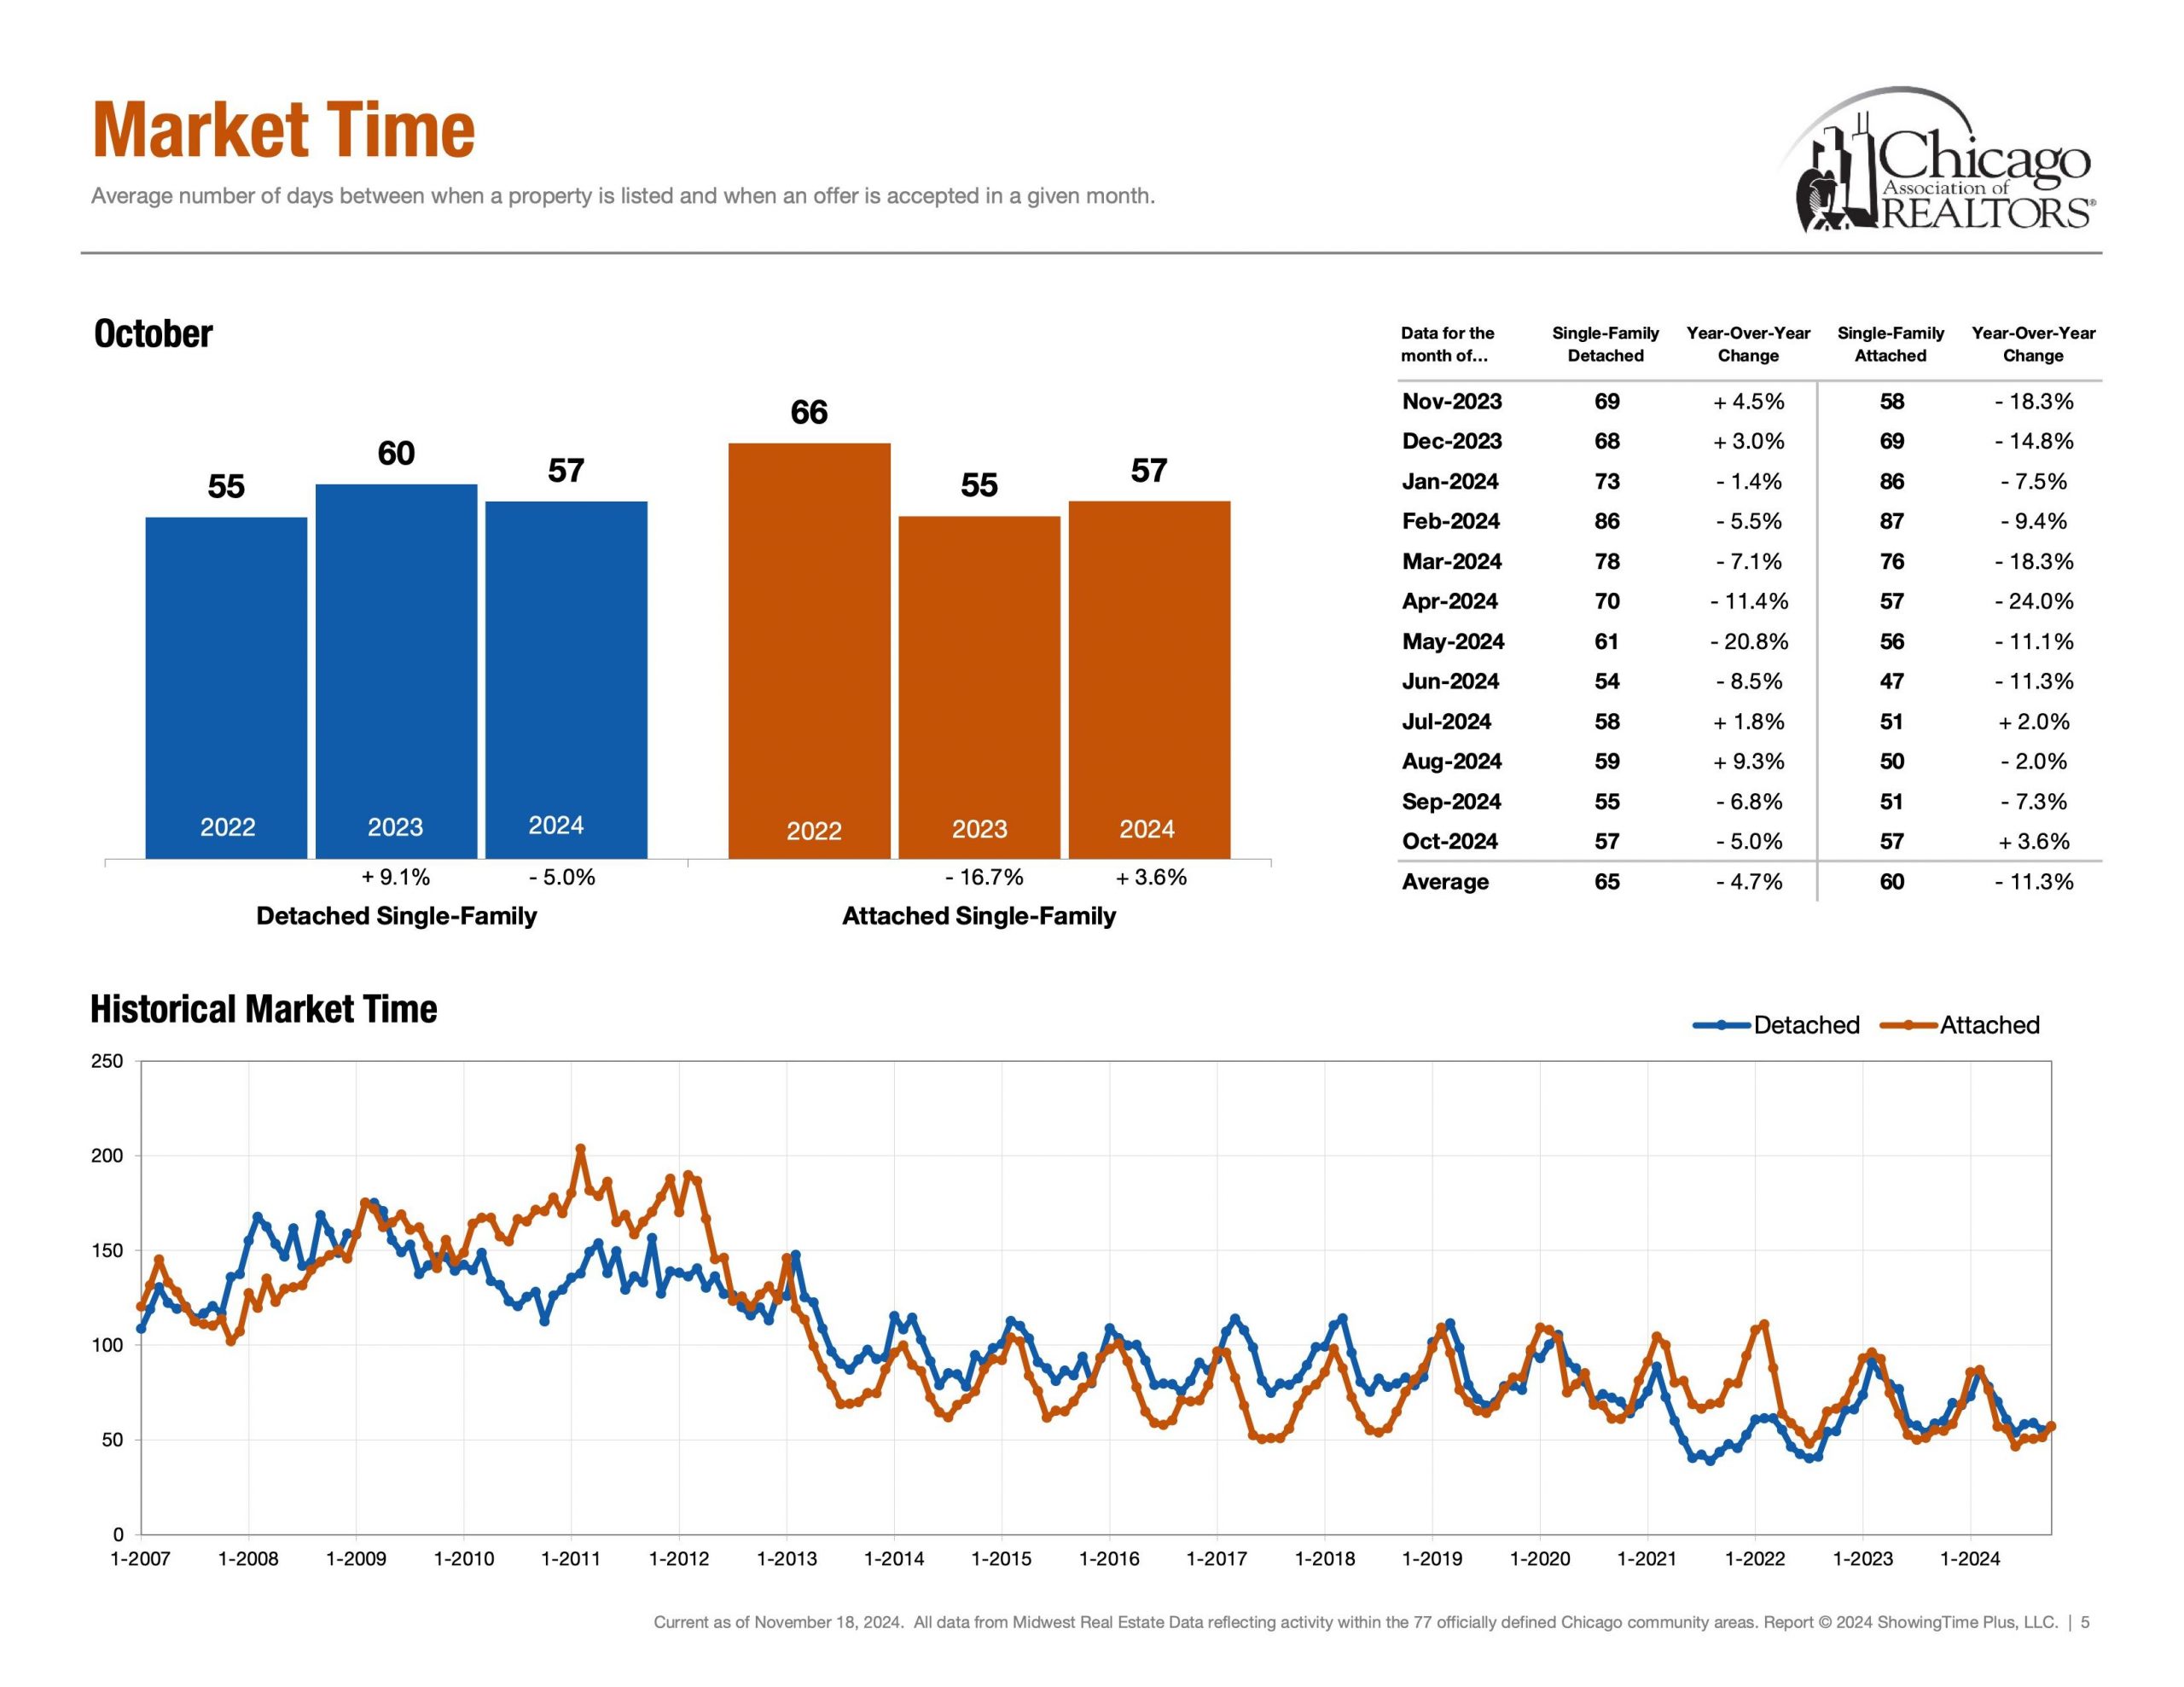
Detached Single ~ 57 Days (Oct 24′)

Attached Single ~ 57 Days (Oct 24′)


First, market time is metric that showcases speed and whether a listing was priced too low, priced properly or priced too high. If a listing surpasses average days on market, it is a check engine light that your listing maybe overpriced.


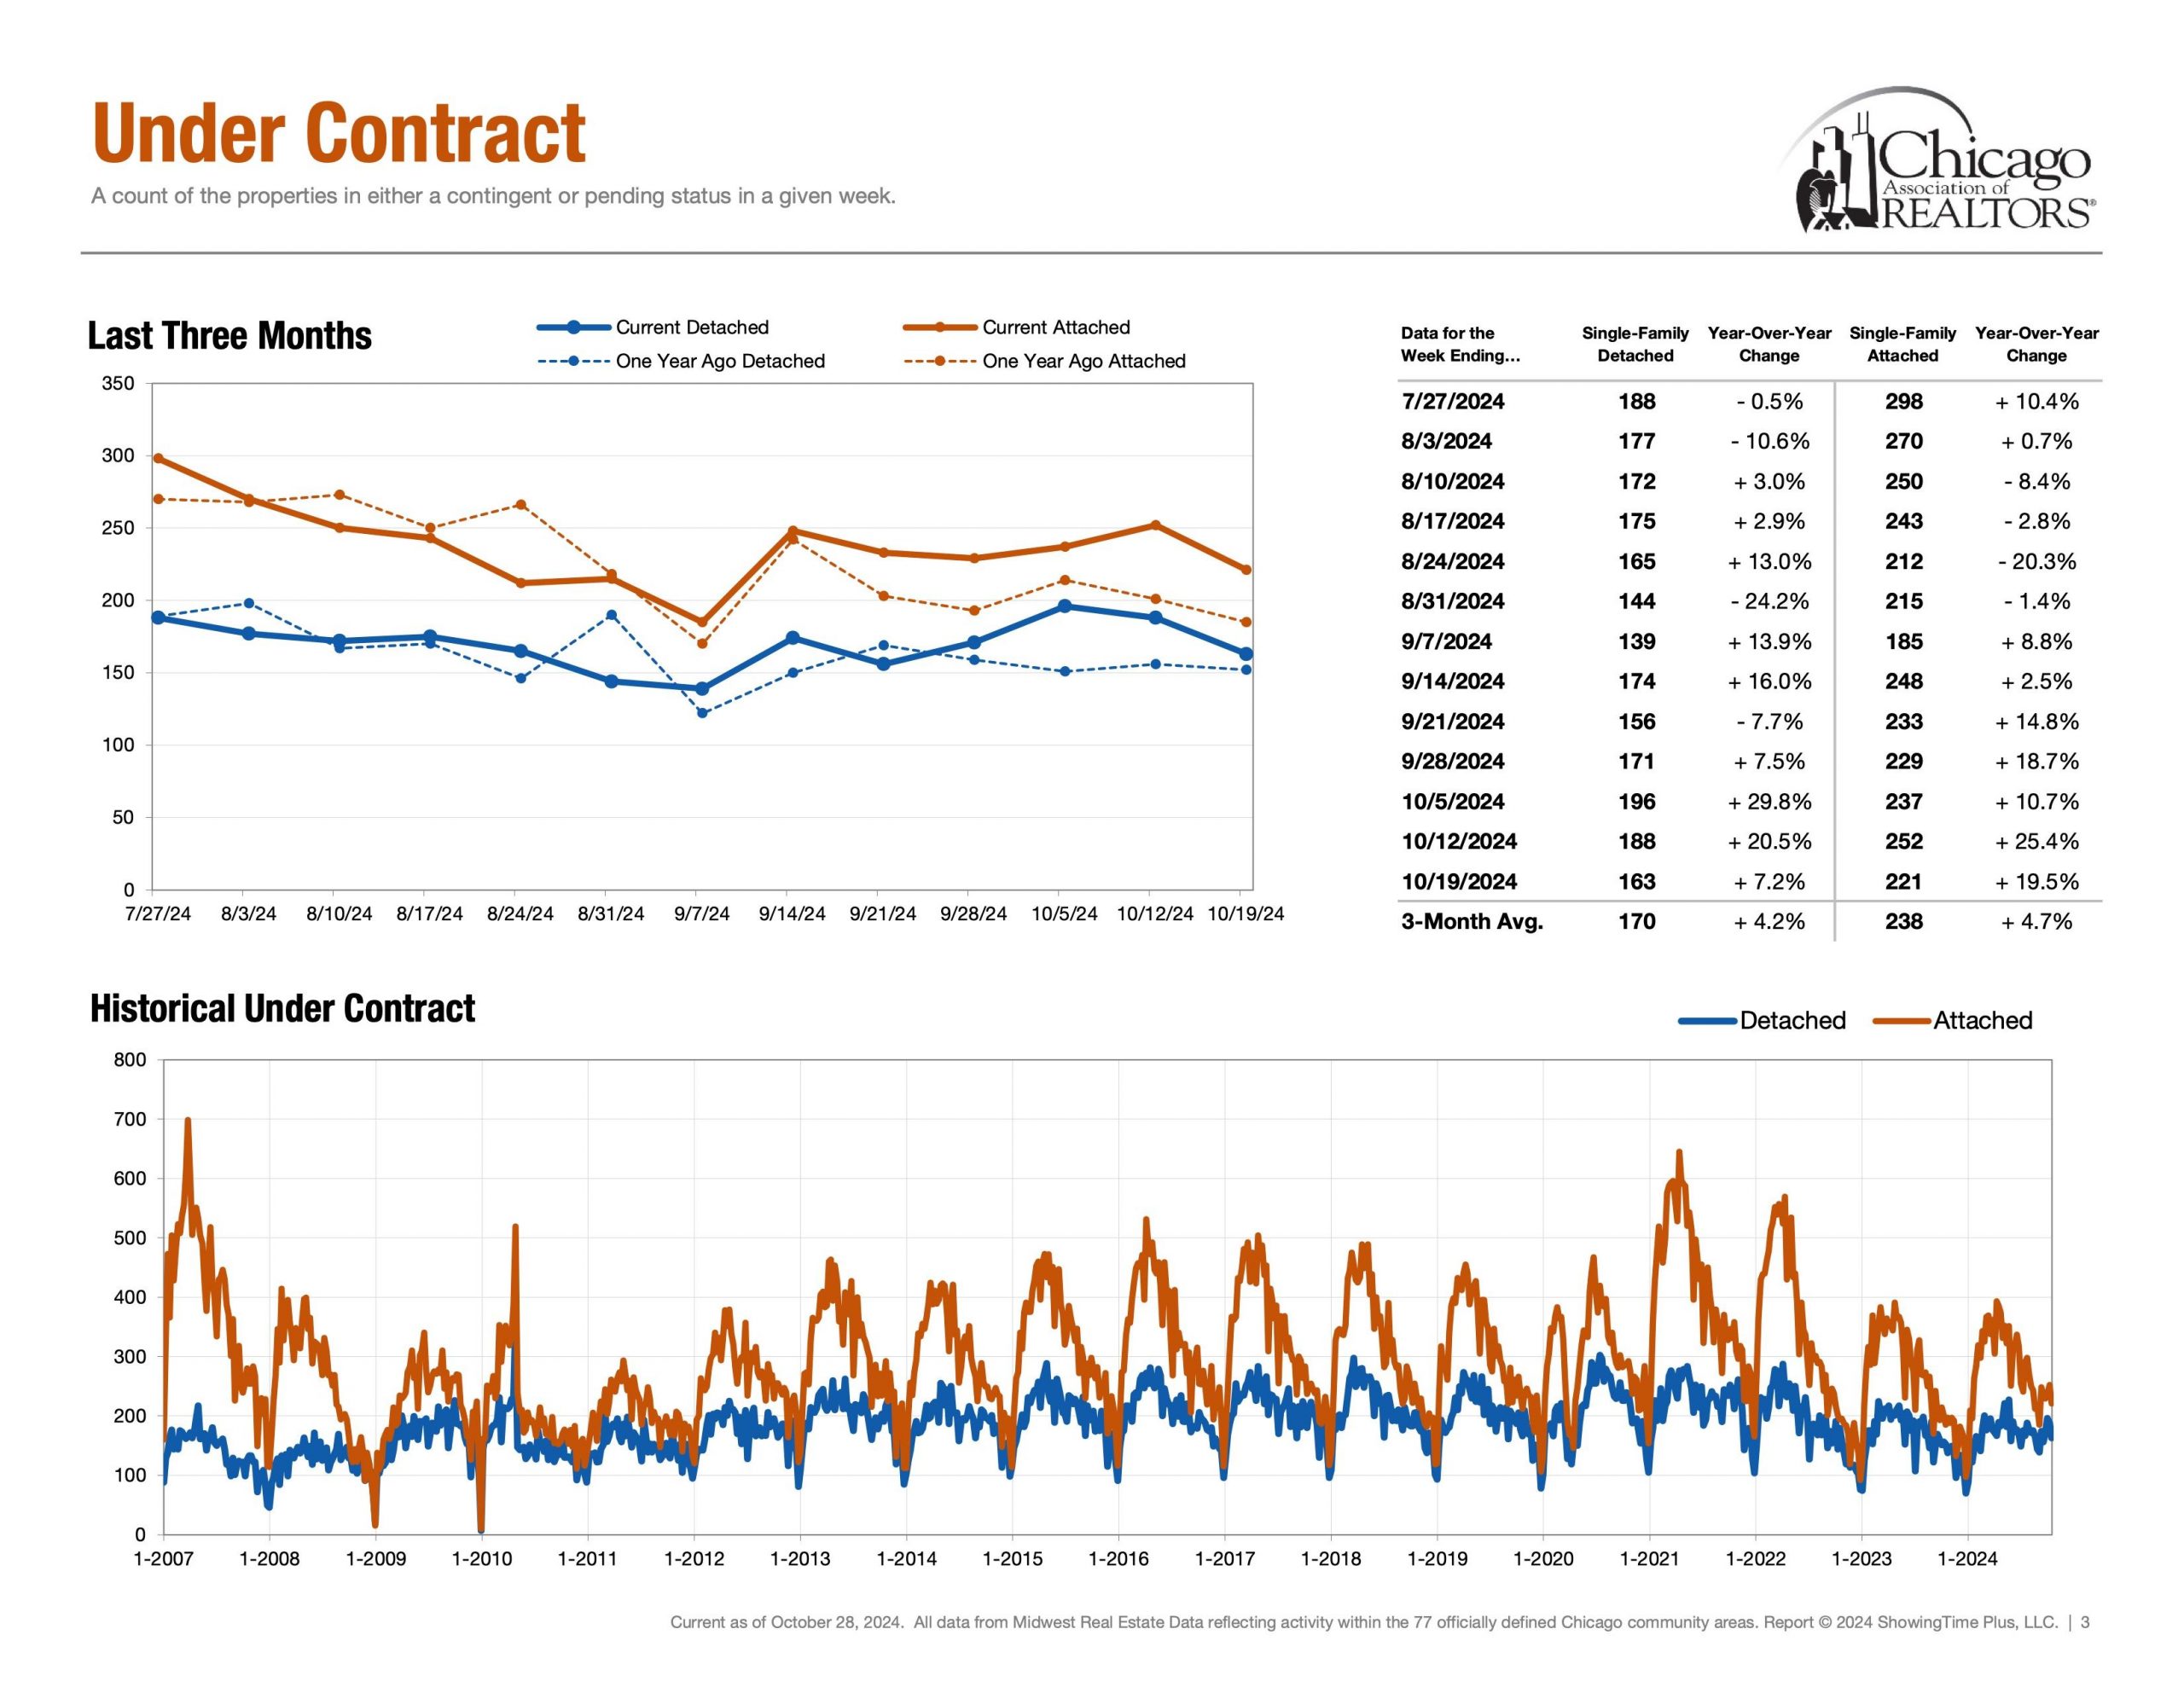
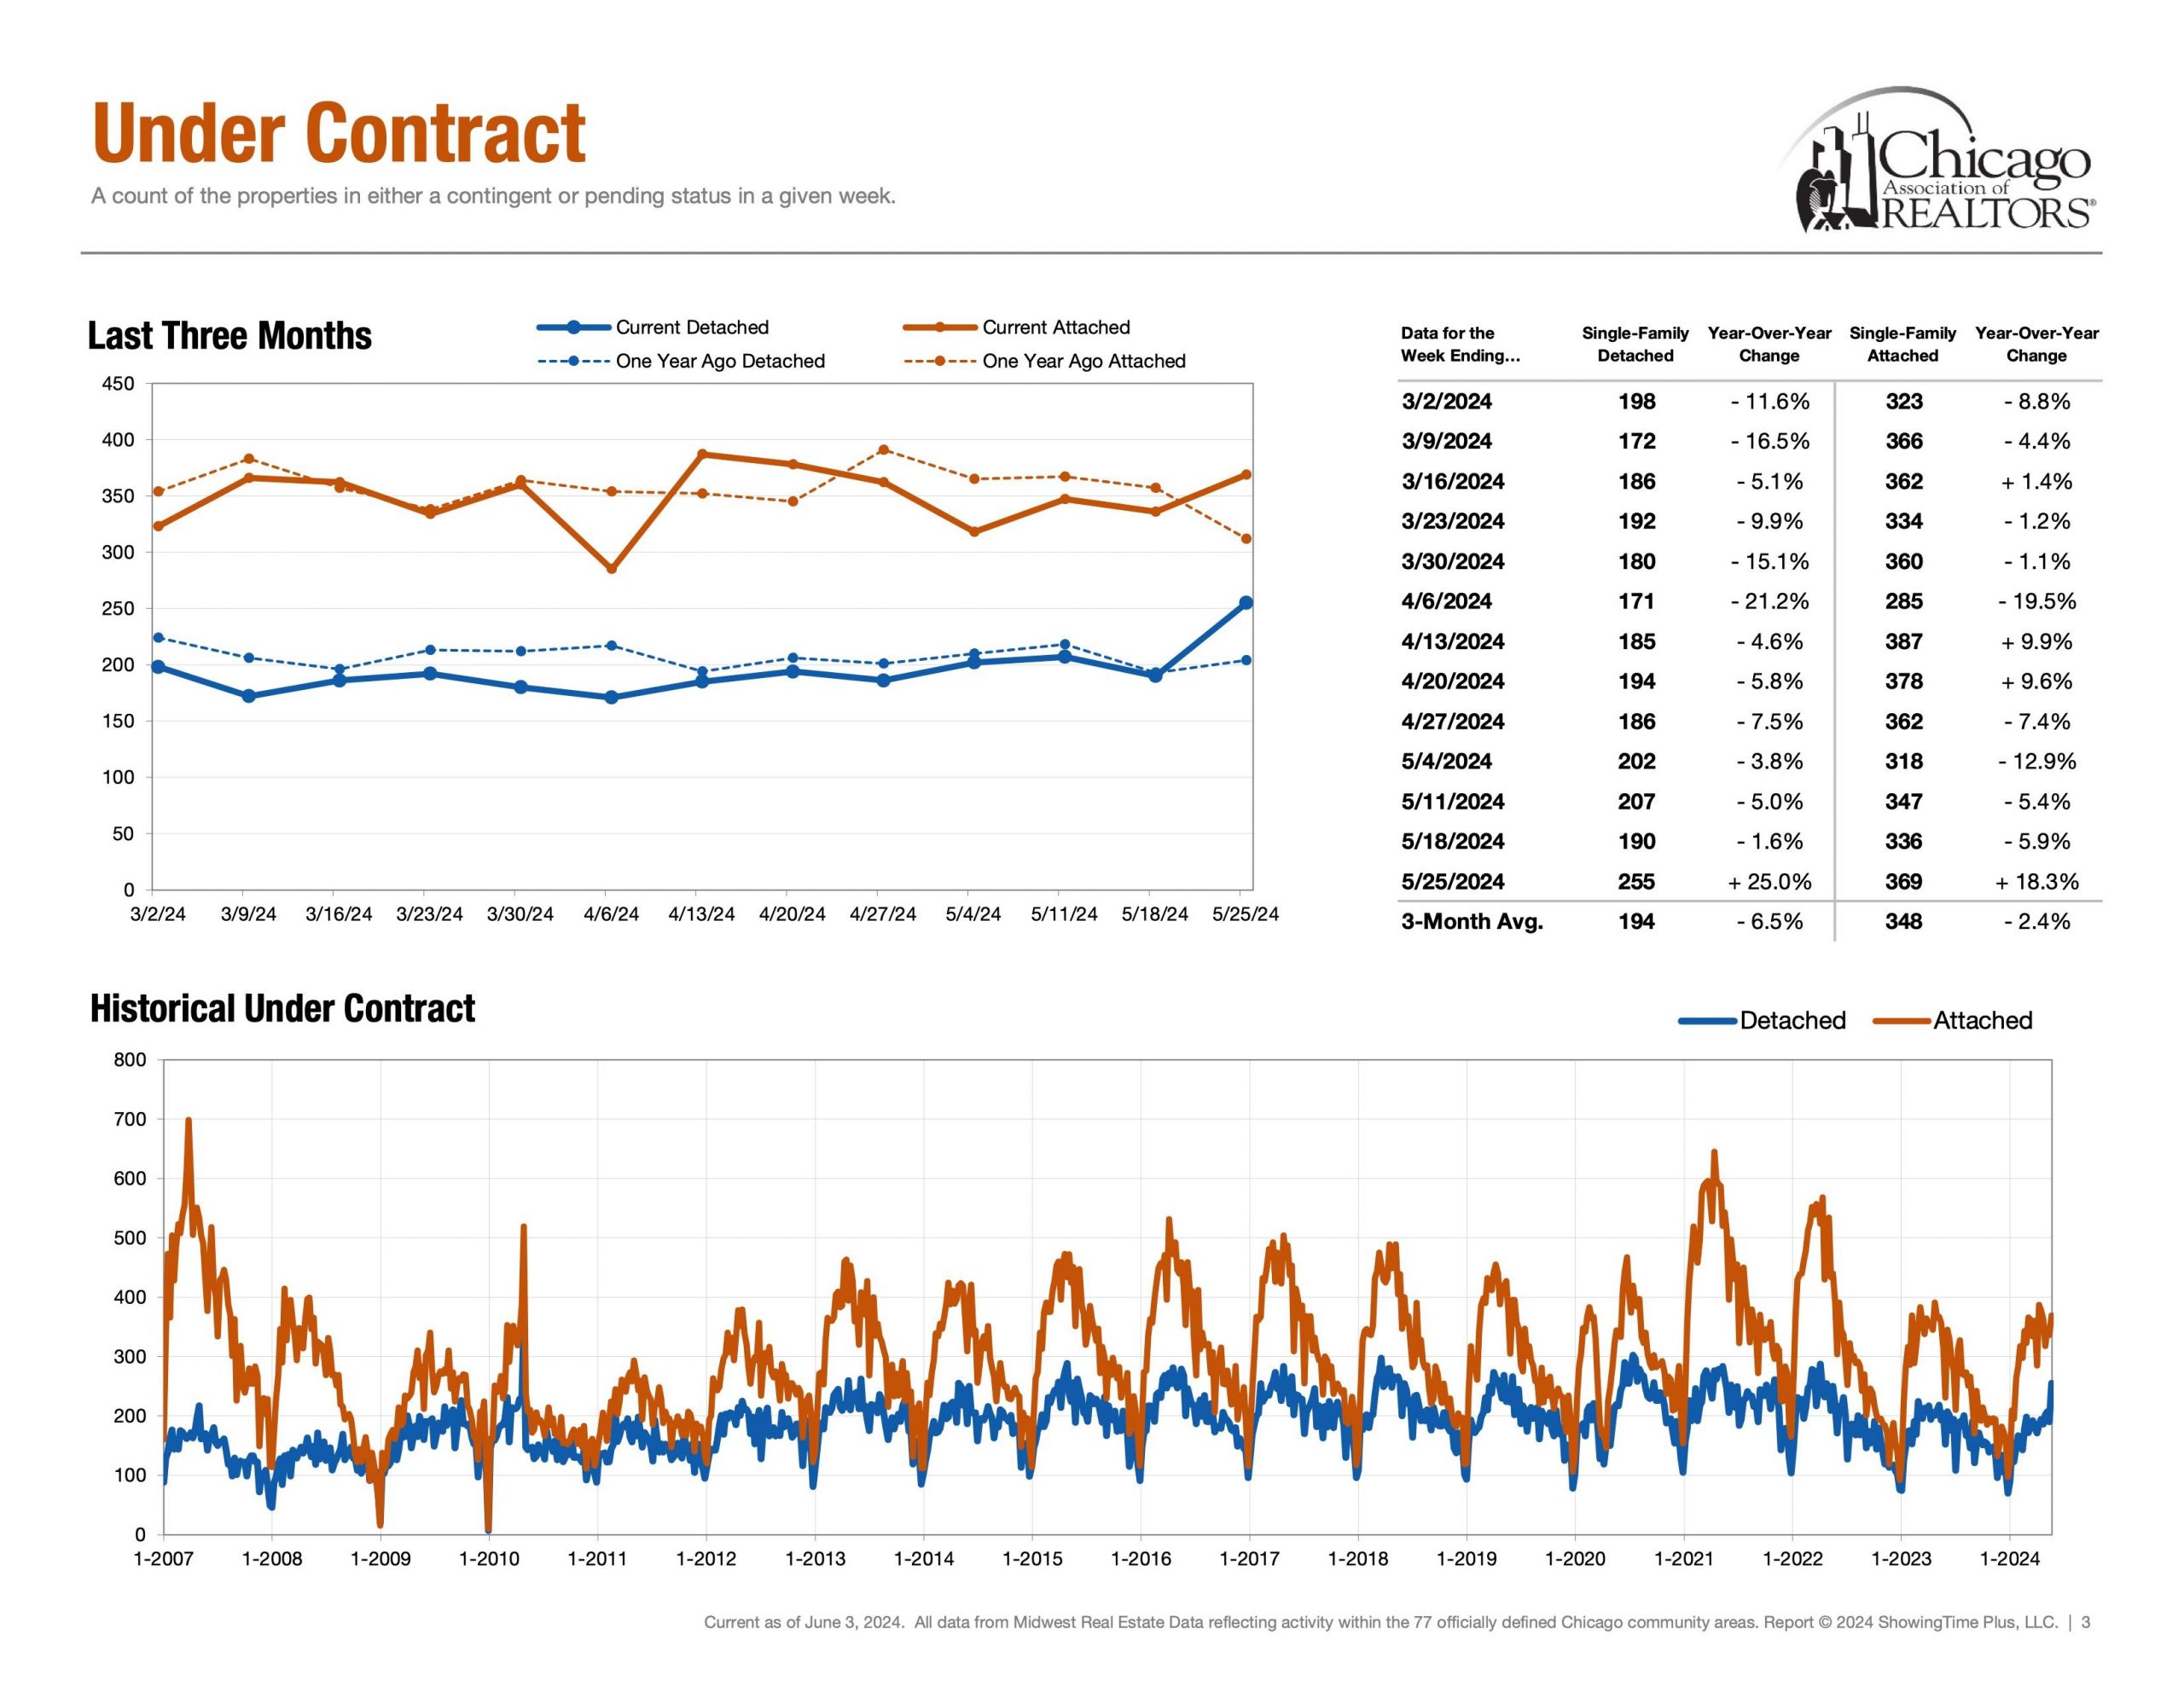
Demand | Under Contract


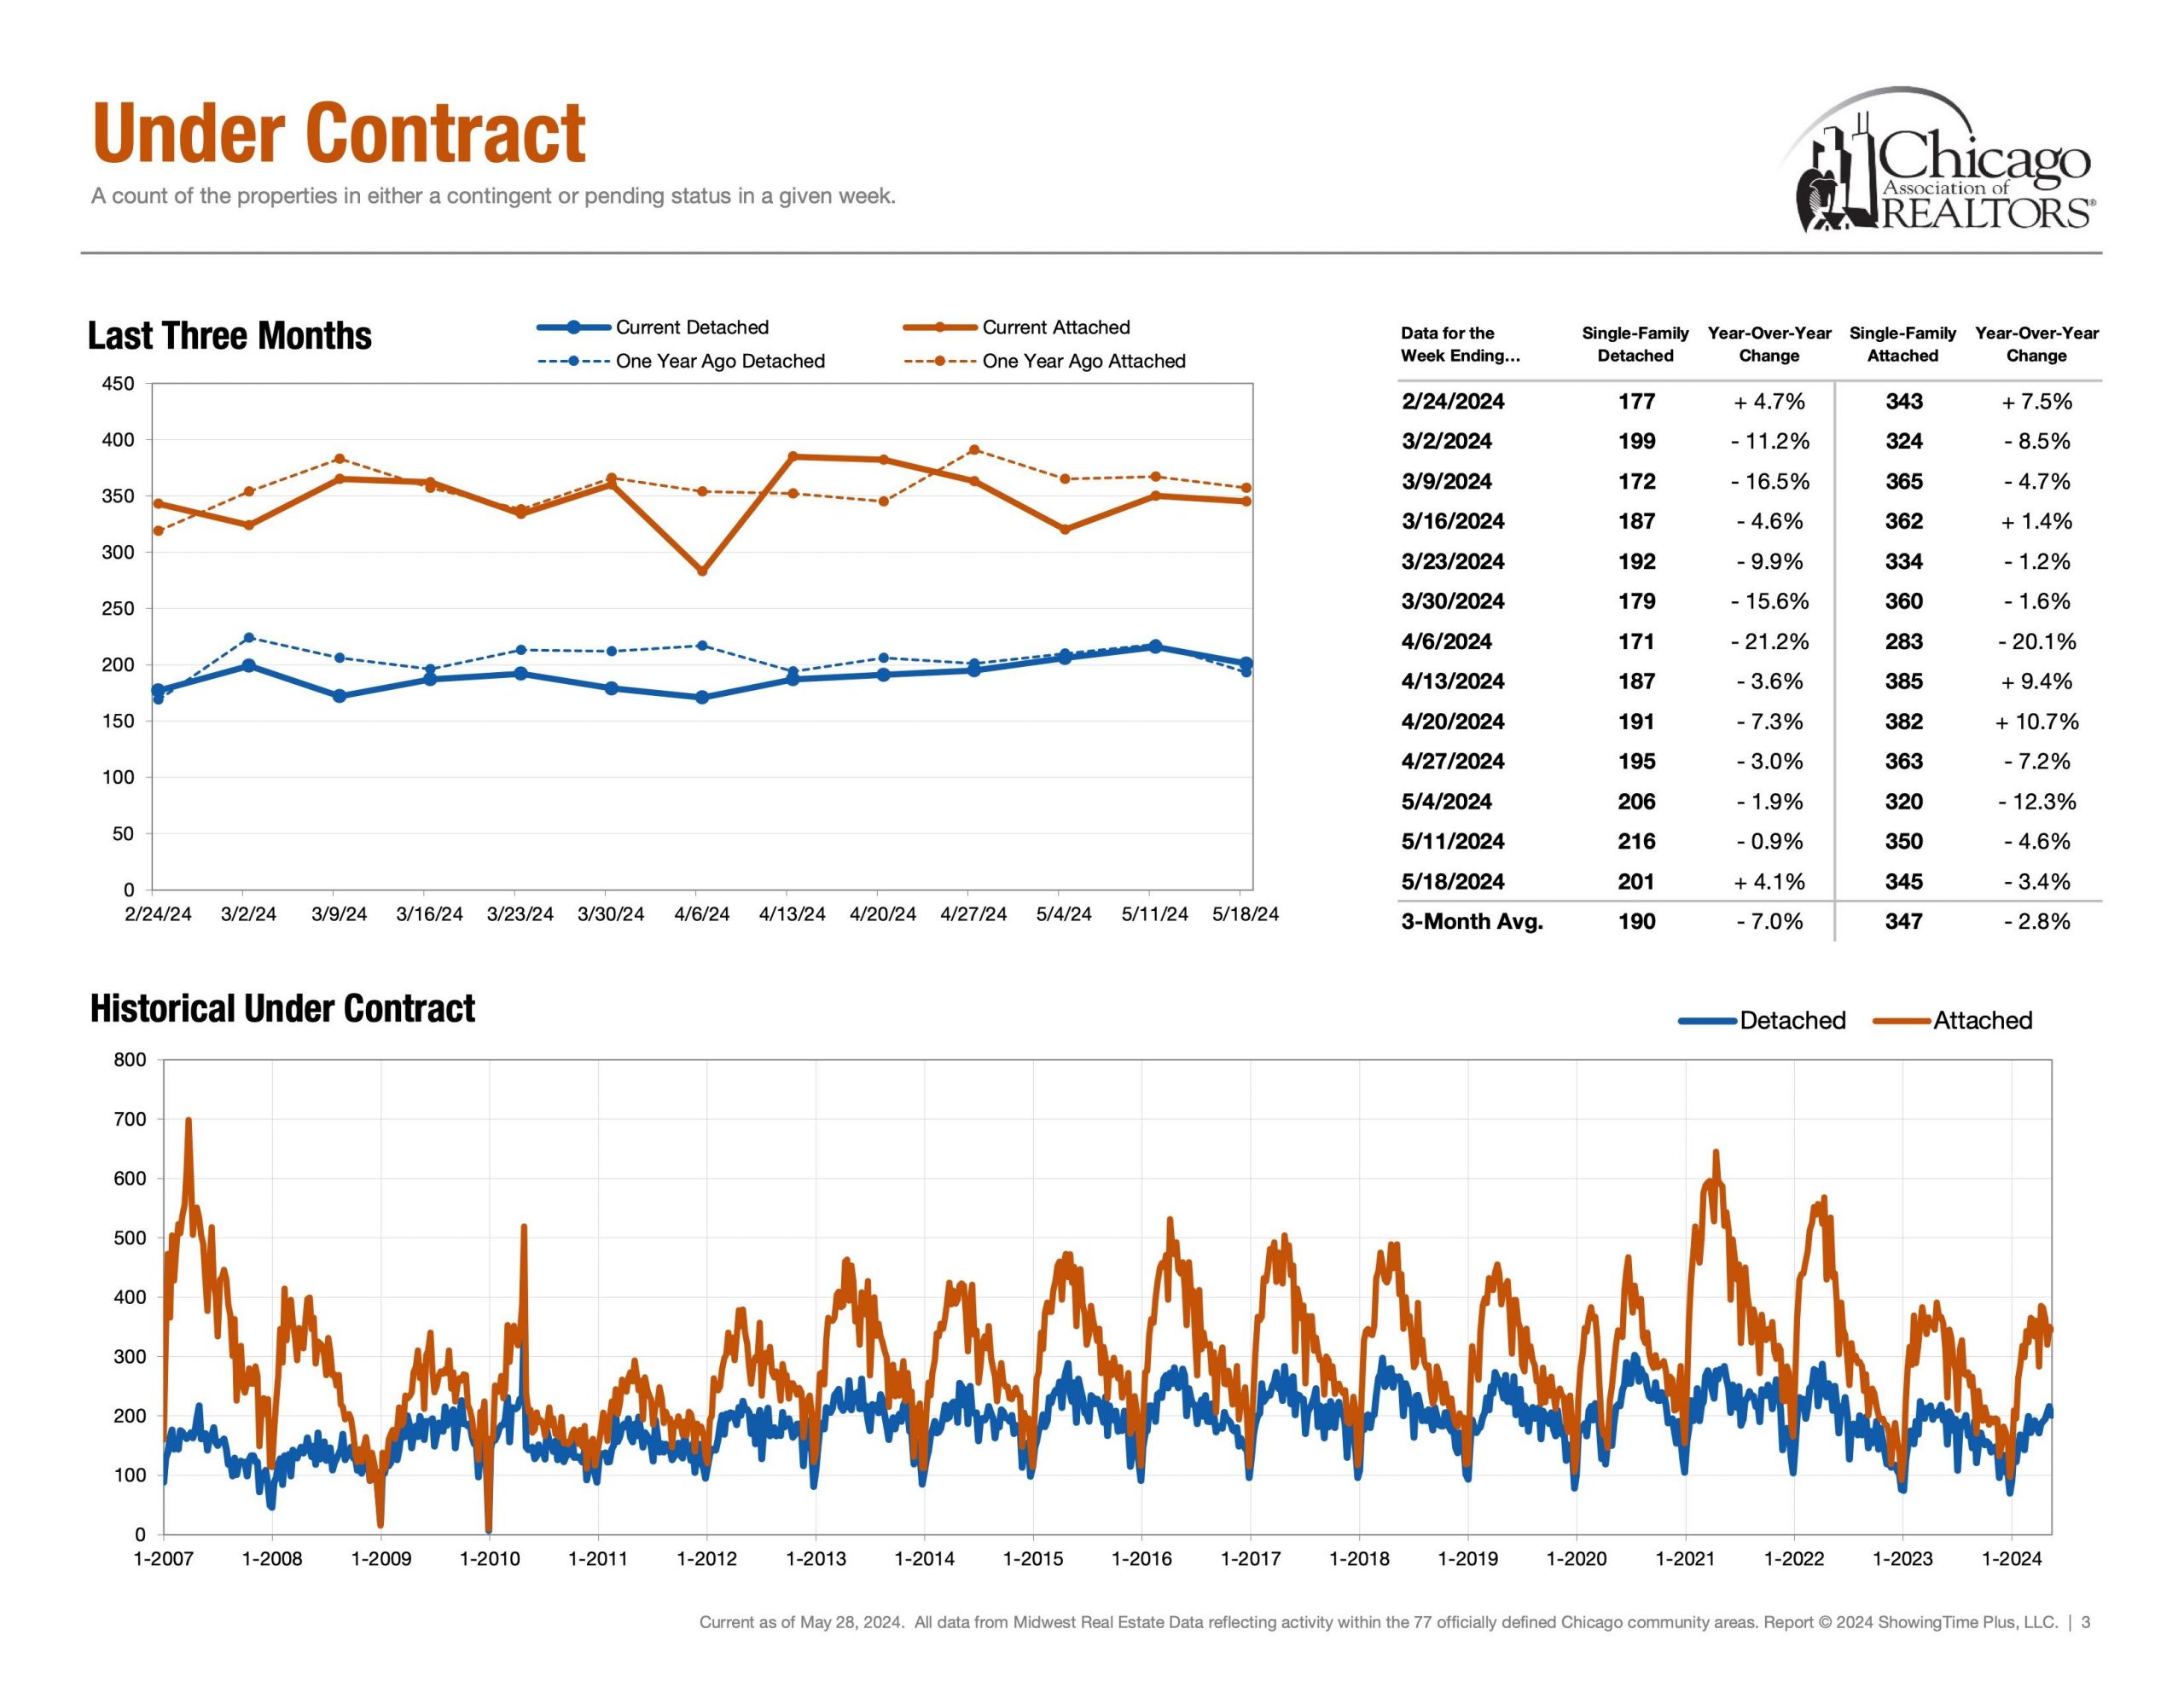
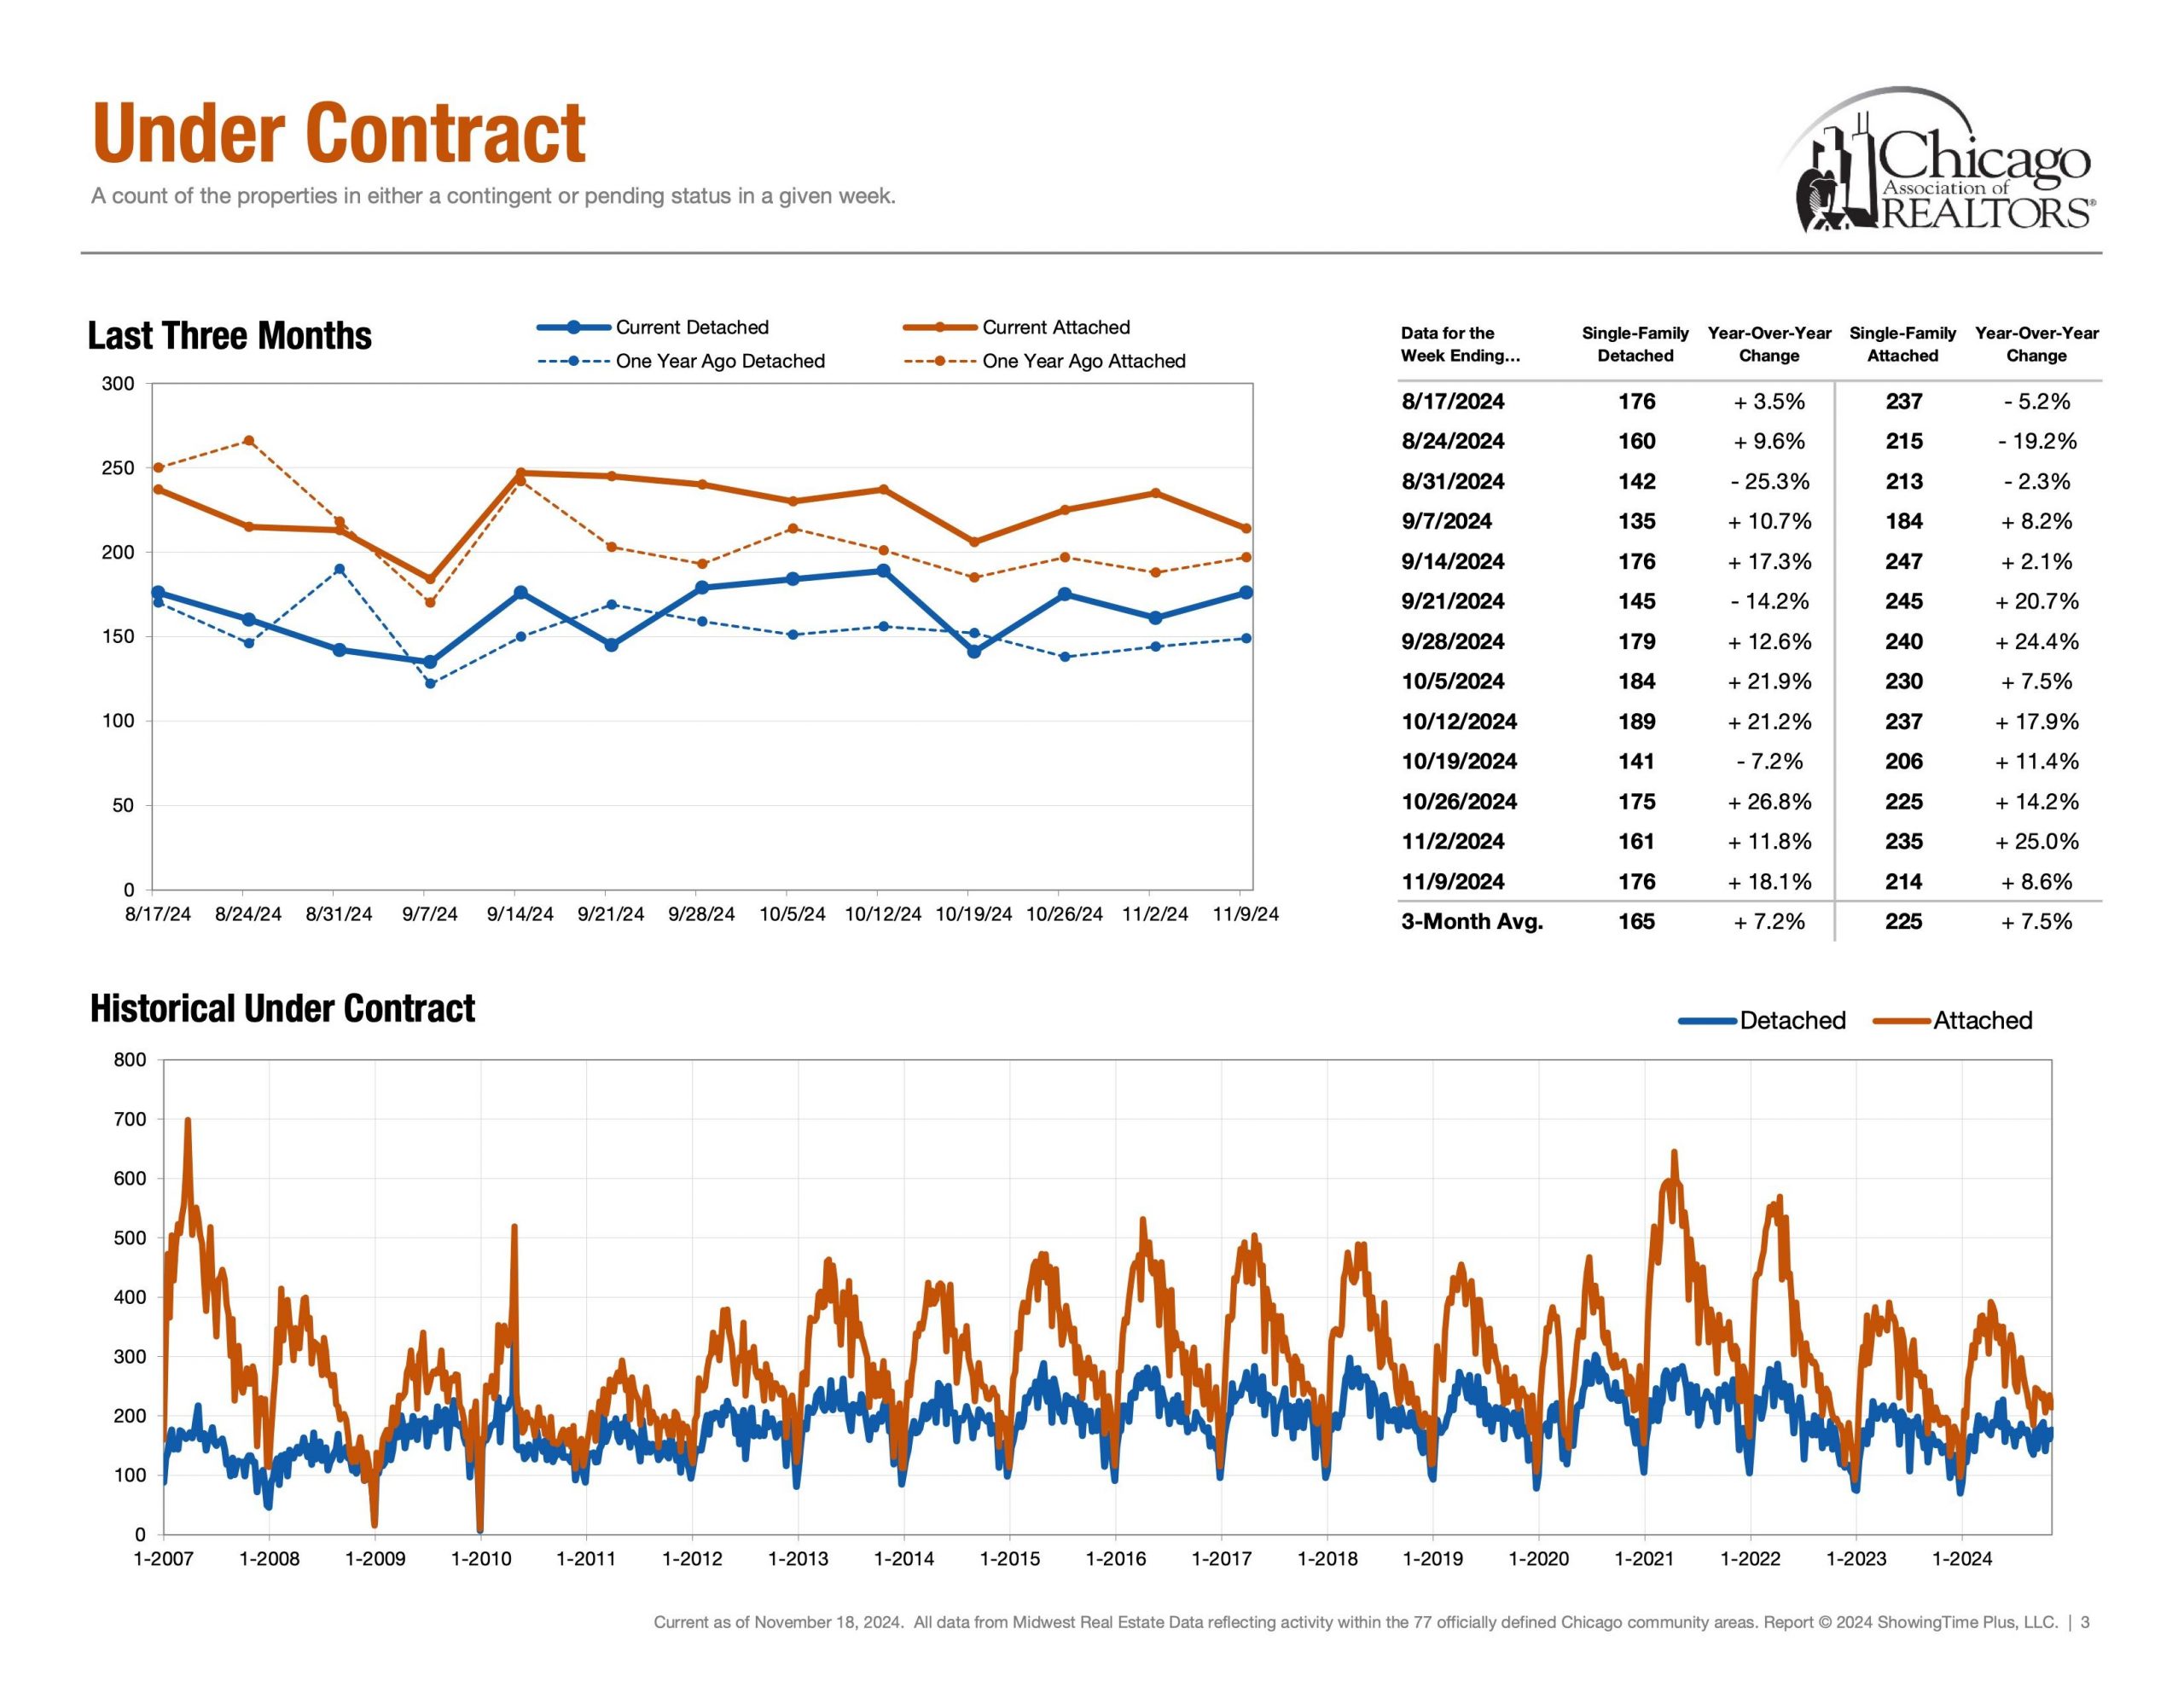
Detached Single = 176 Properties (Nov 3rd – Nov 9th)

Attached Single = 214 Properties (Nov 3rd – Nov 9th)

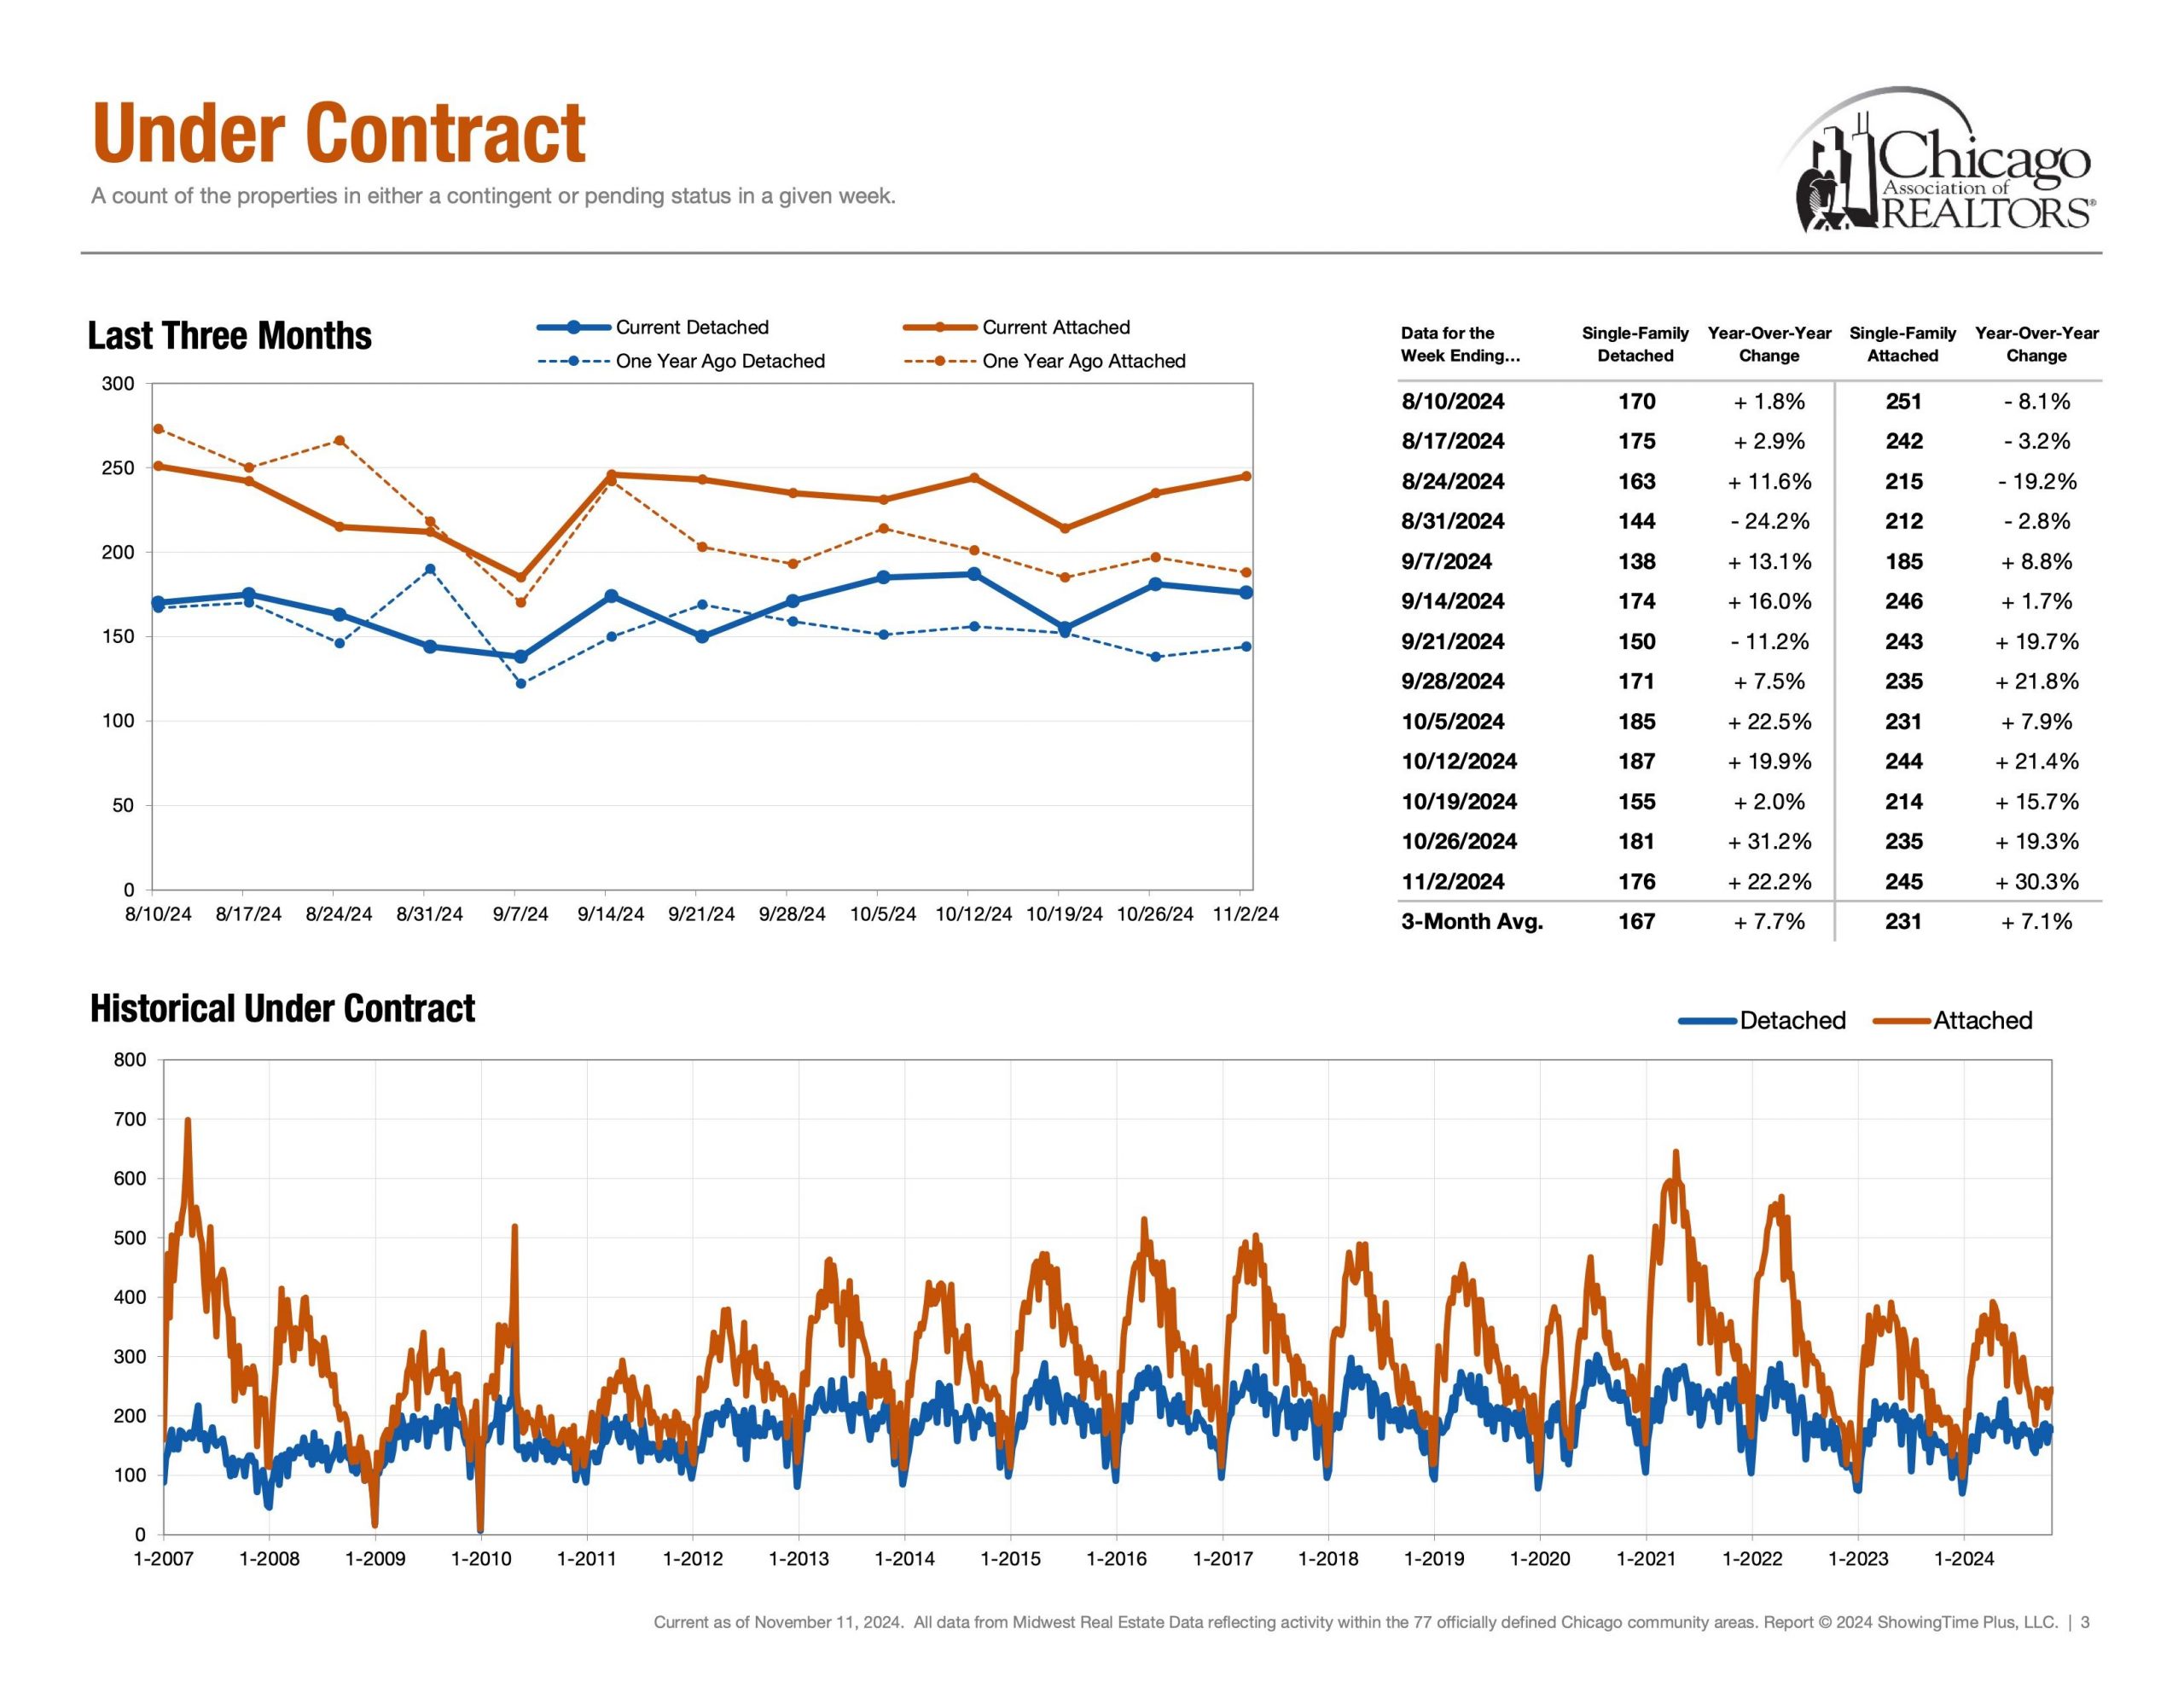
Secondly, under contract helps answer the question, “In our current market, how many buyers are buying?” Showcasing the heartbeat of the real estate market. Interestingly, demand metrics become more insightful when compared and contrasted with supply/inventory metrics. This is the 8th week in a row of sustained increase of under contract for attached properties. Detached third week. Worth noting Demand is up. Supply is not. This may result in decreased market time and increase in negotiations.


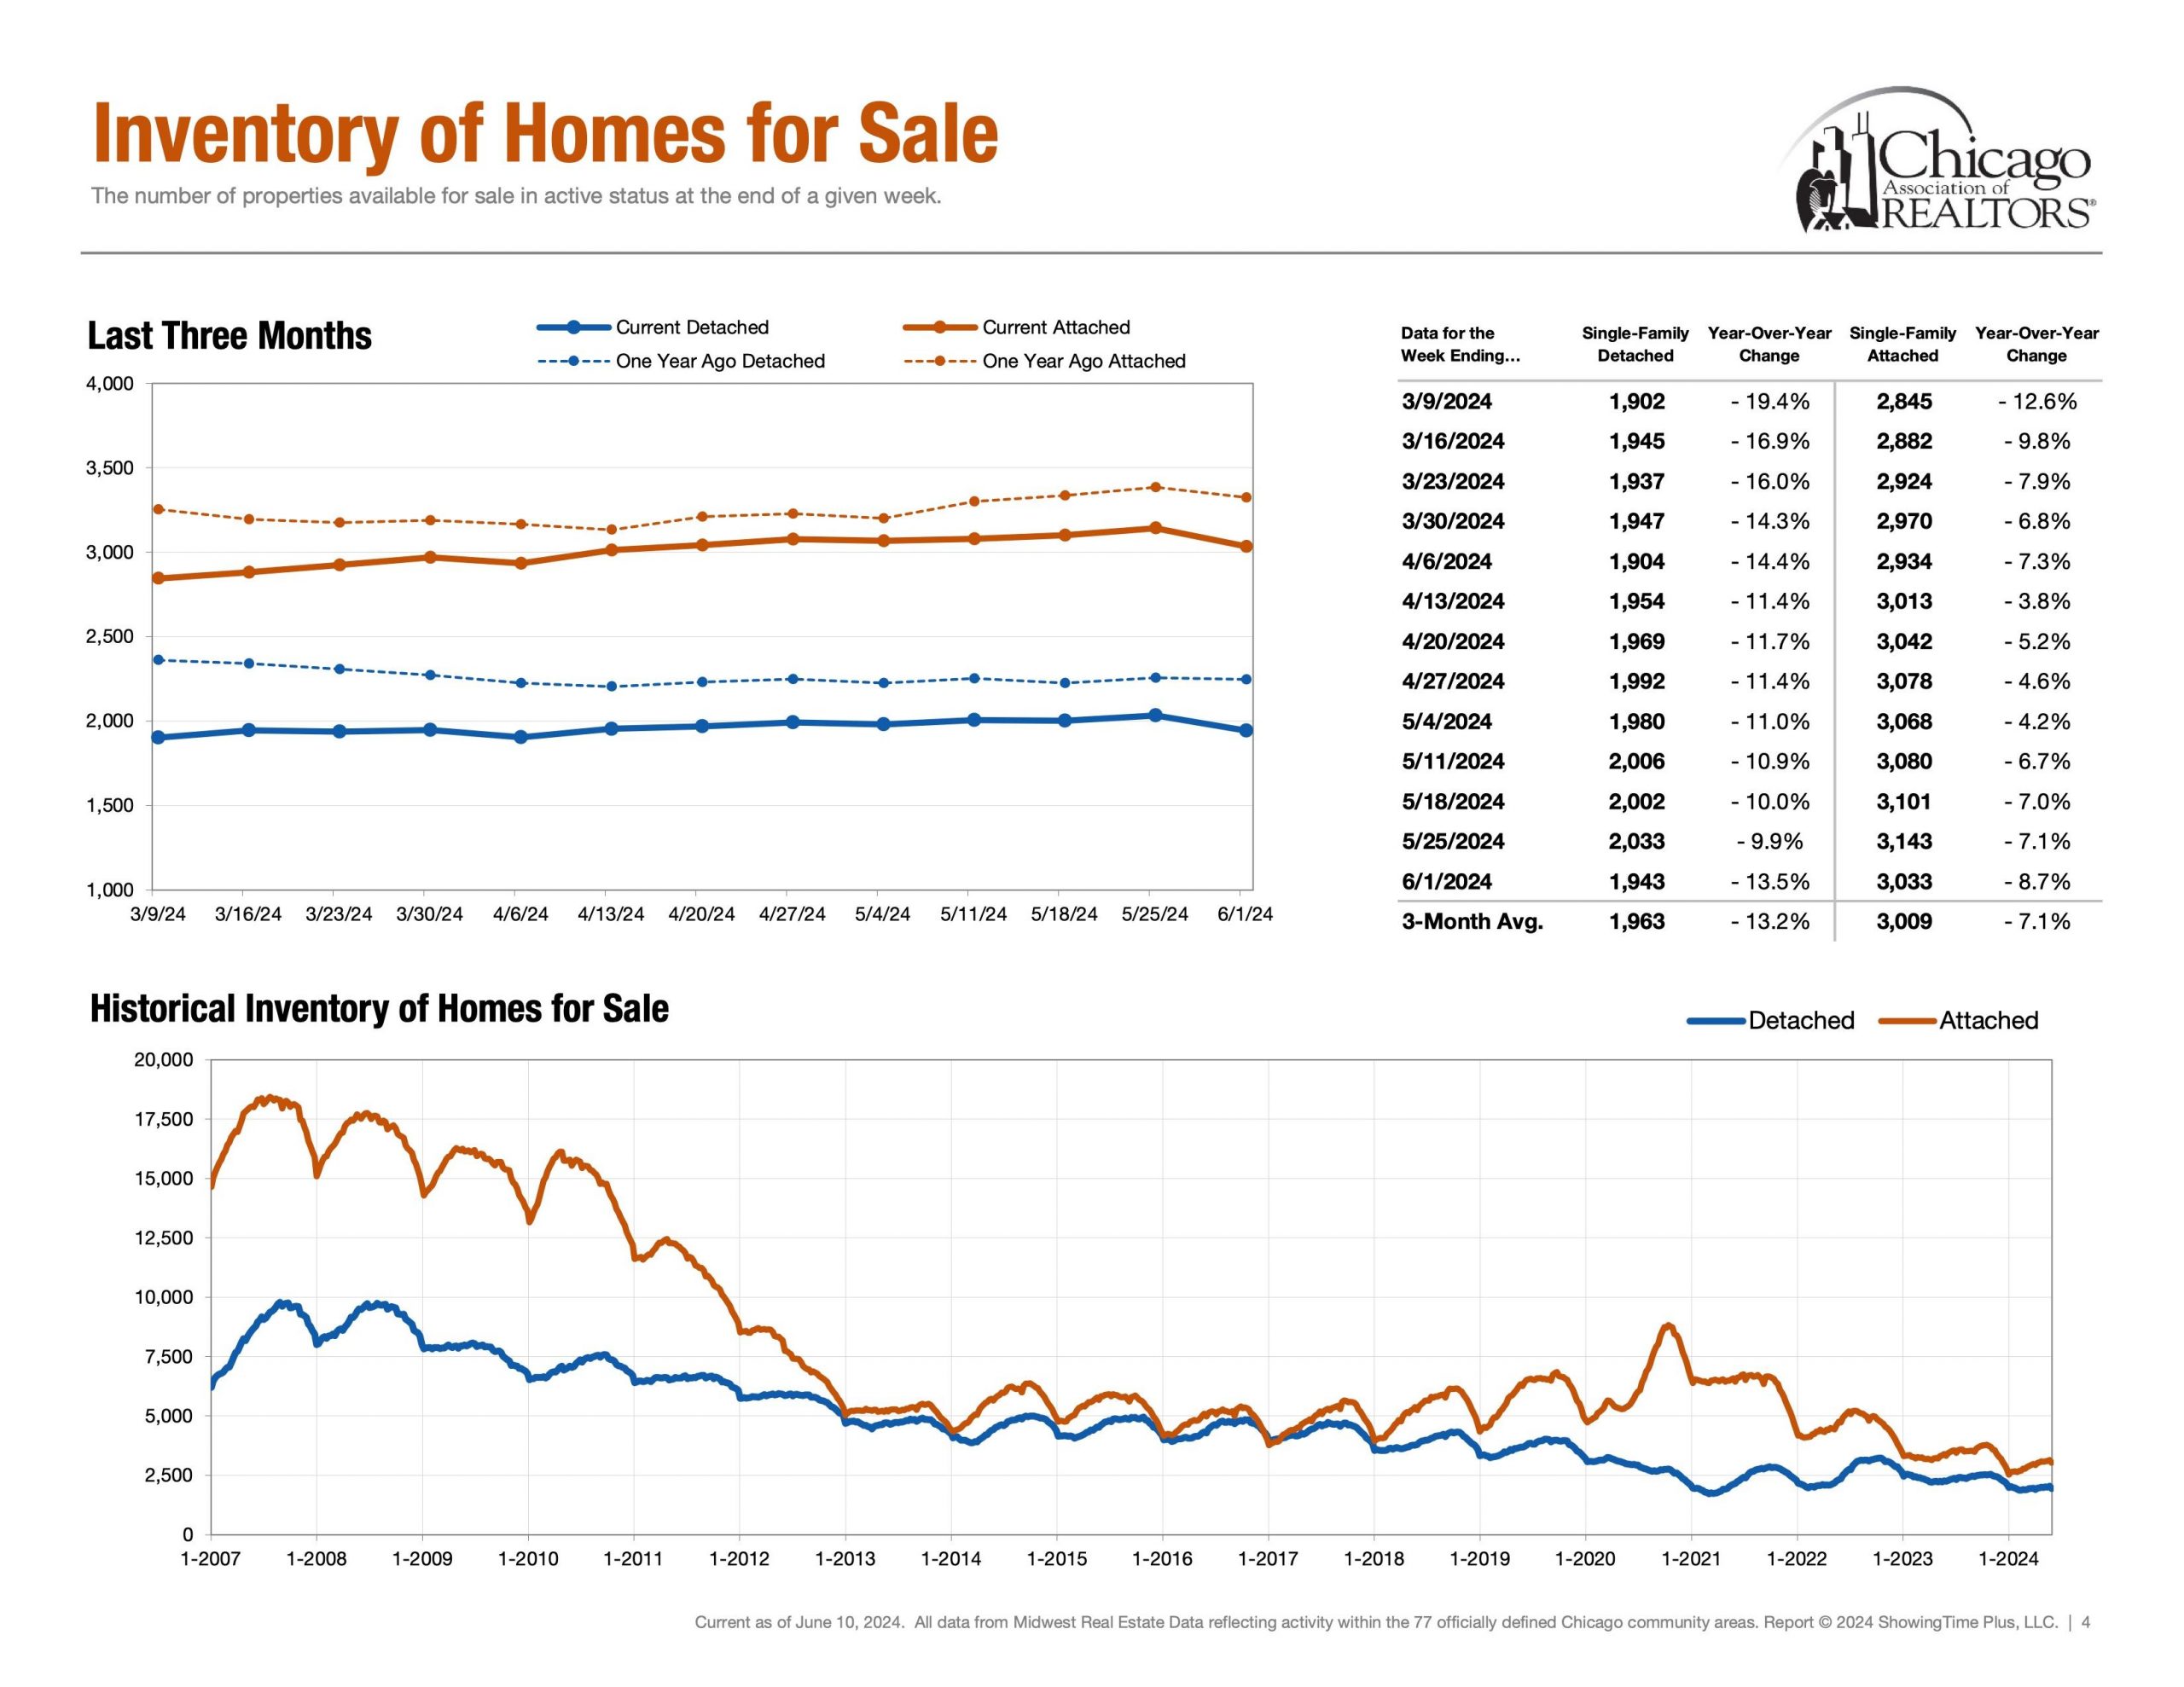
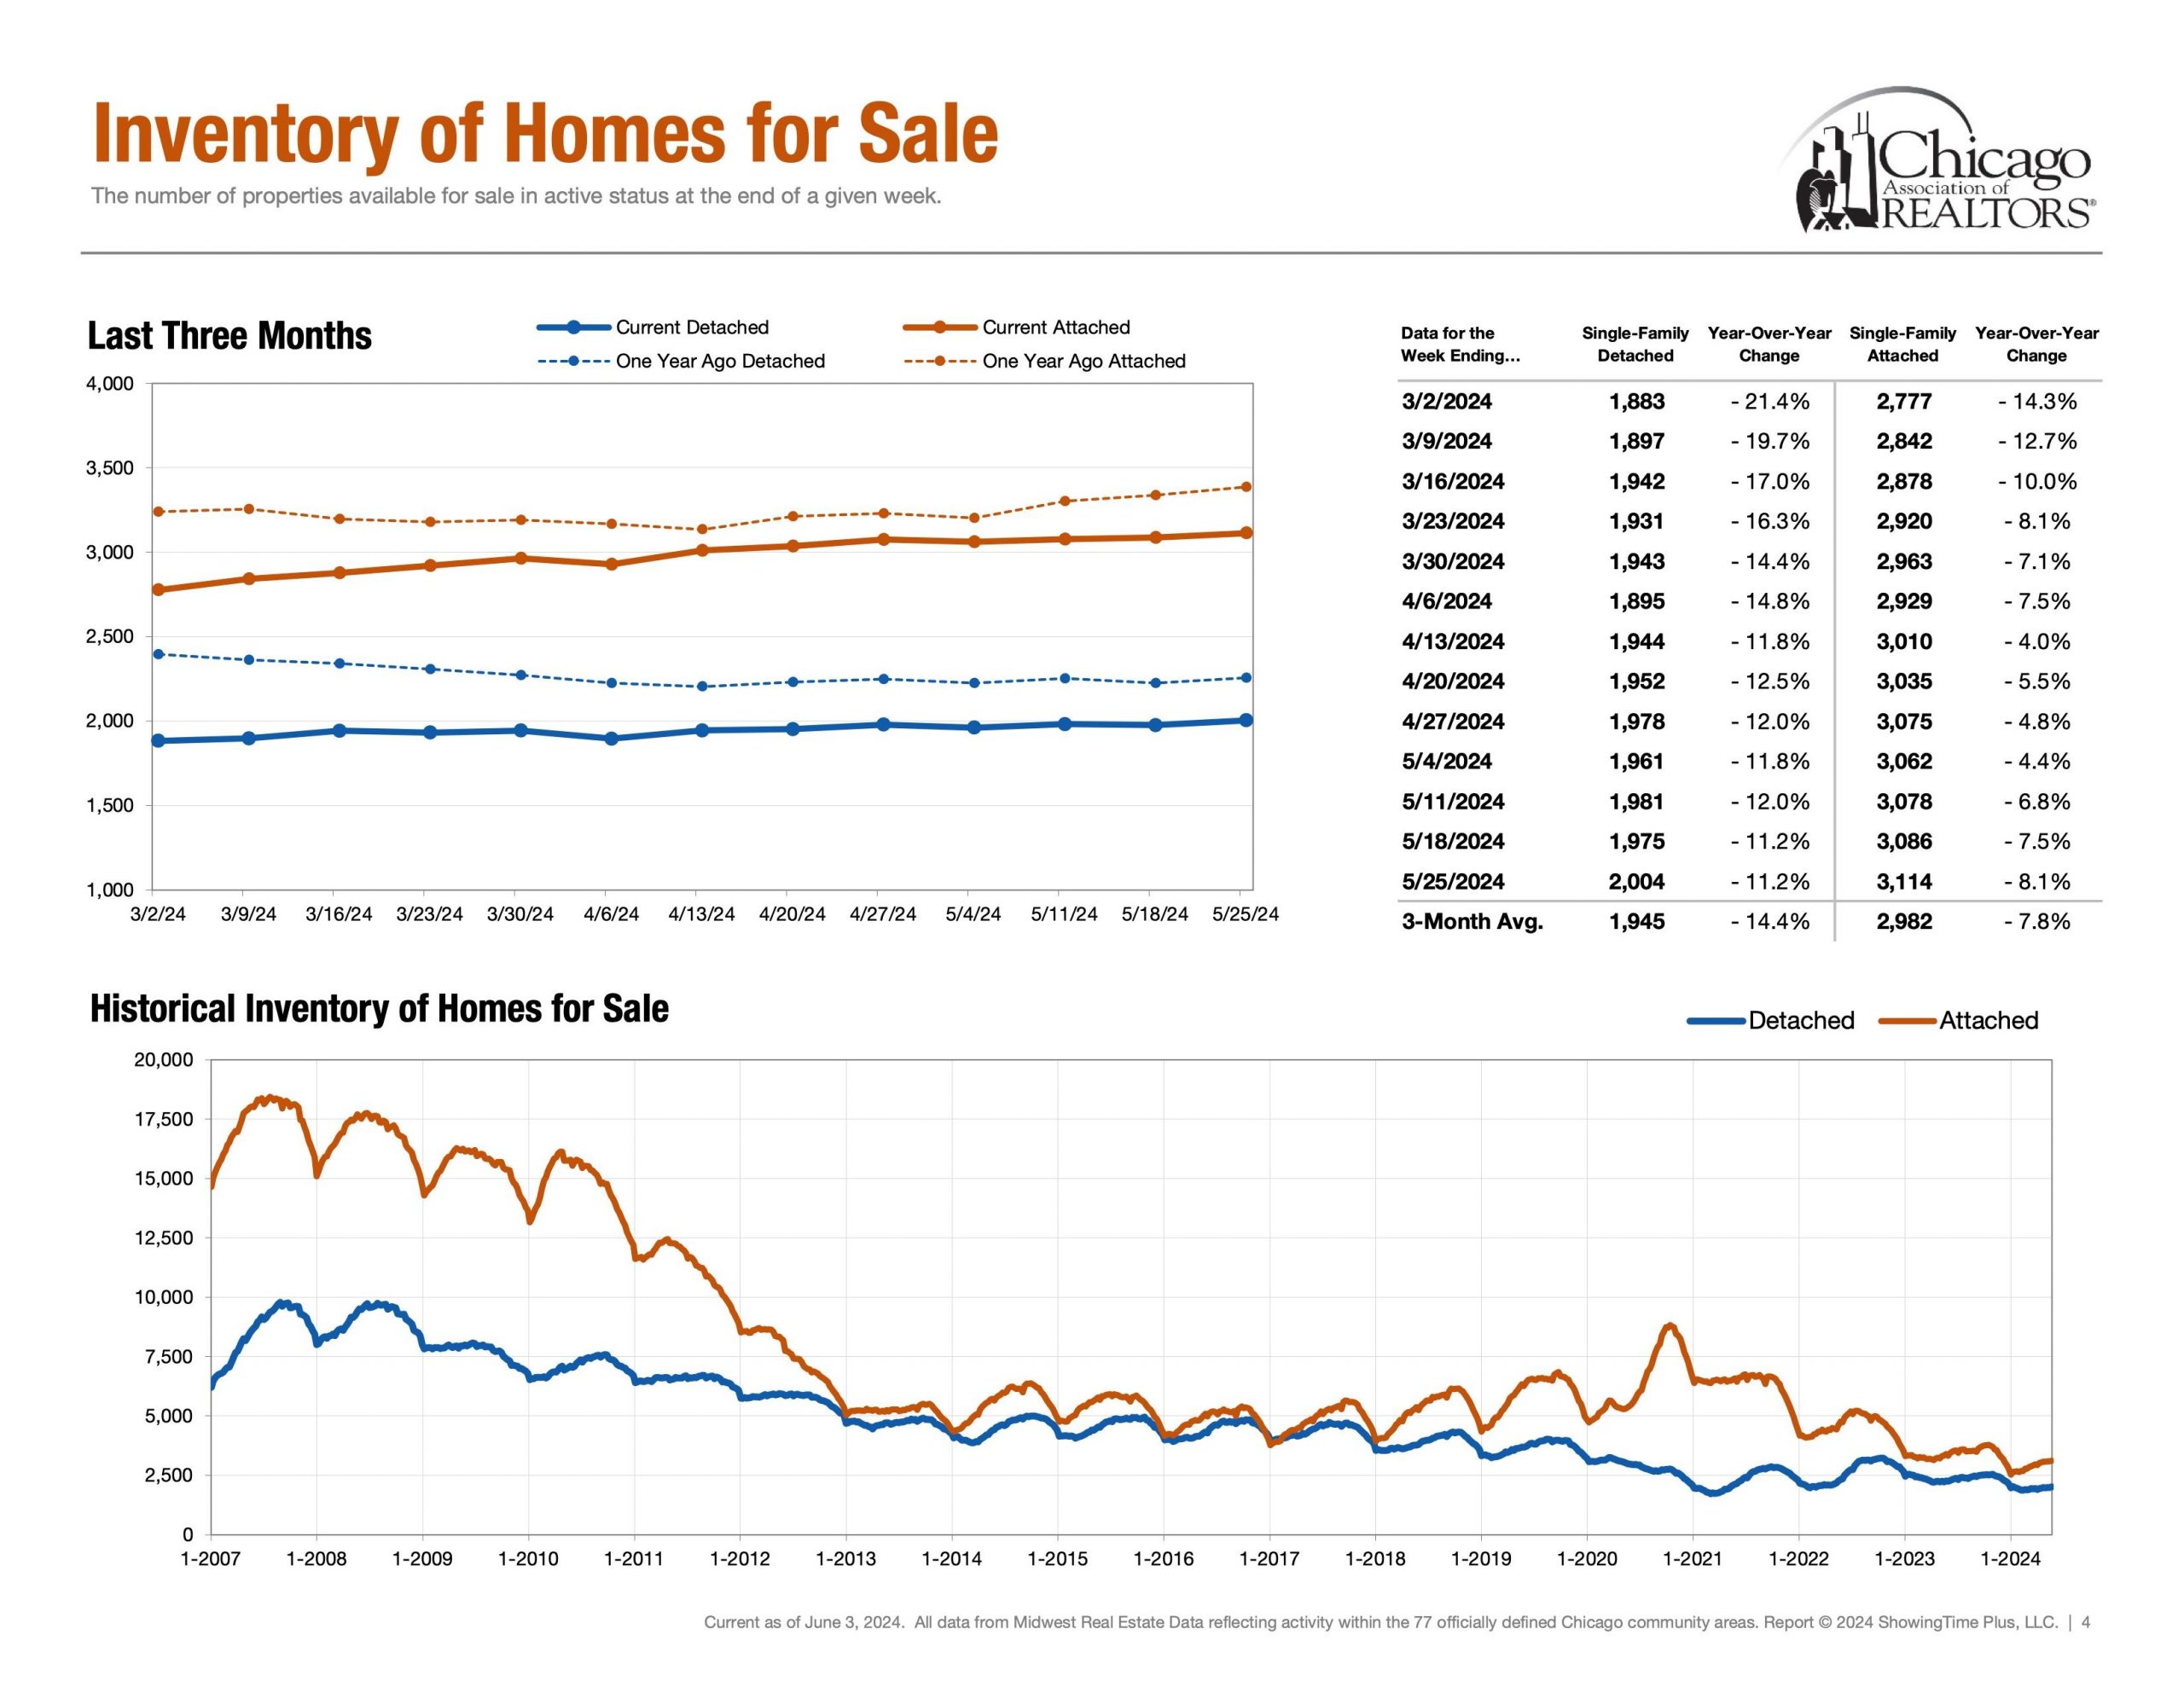
Supply | Inventory of Homes for Sale


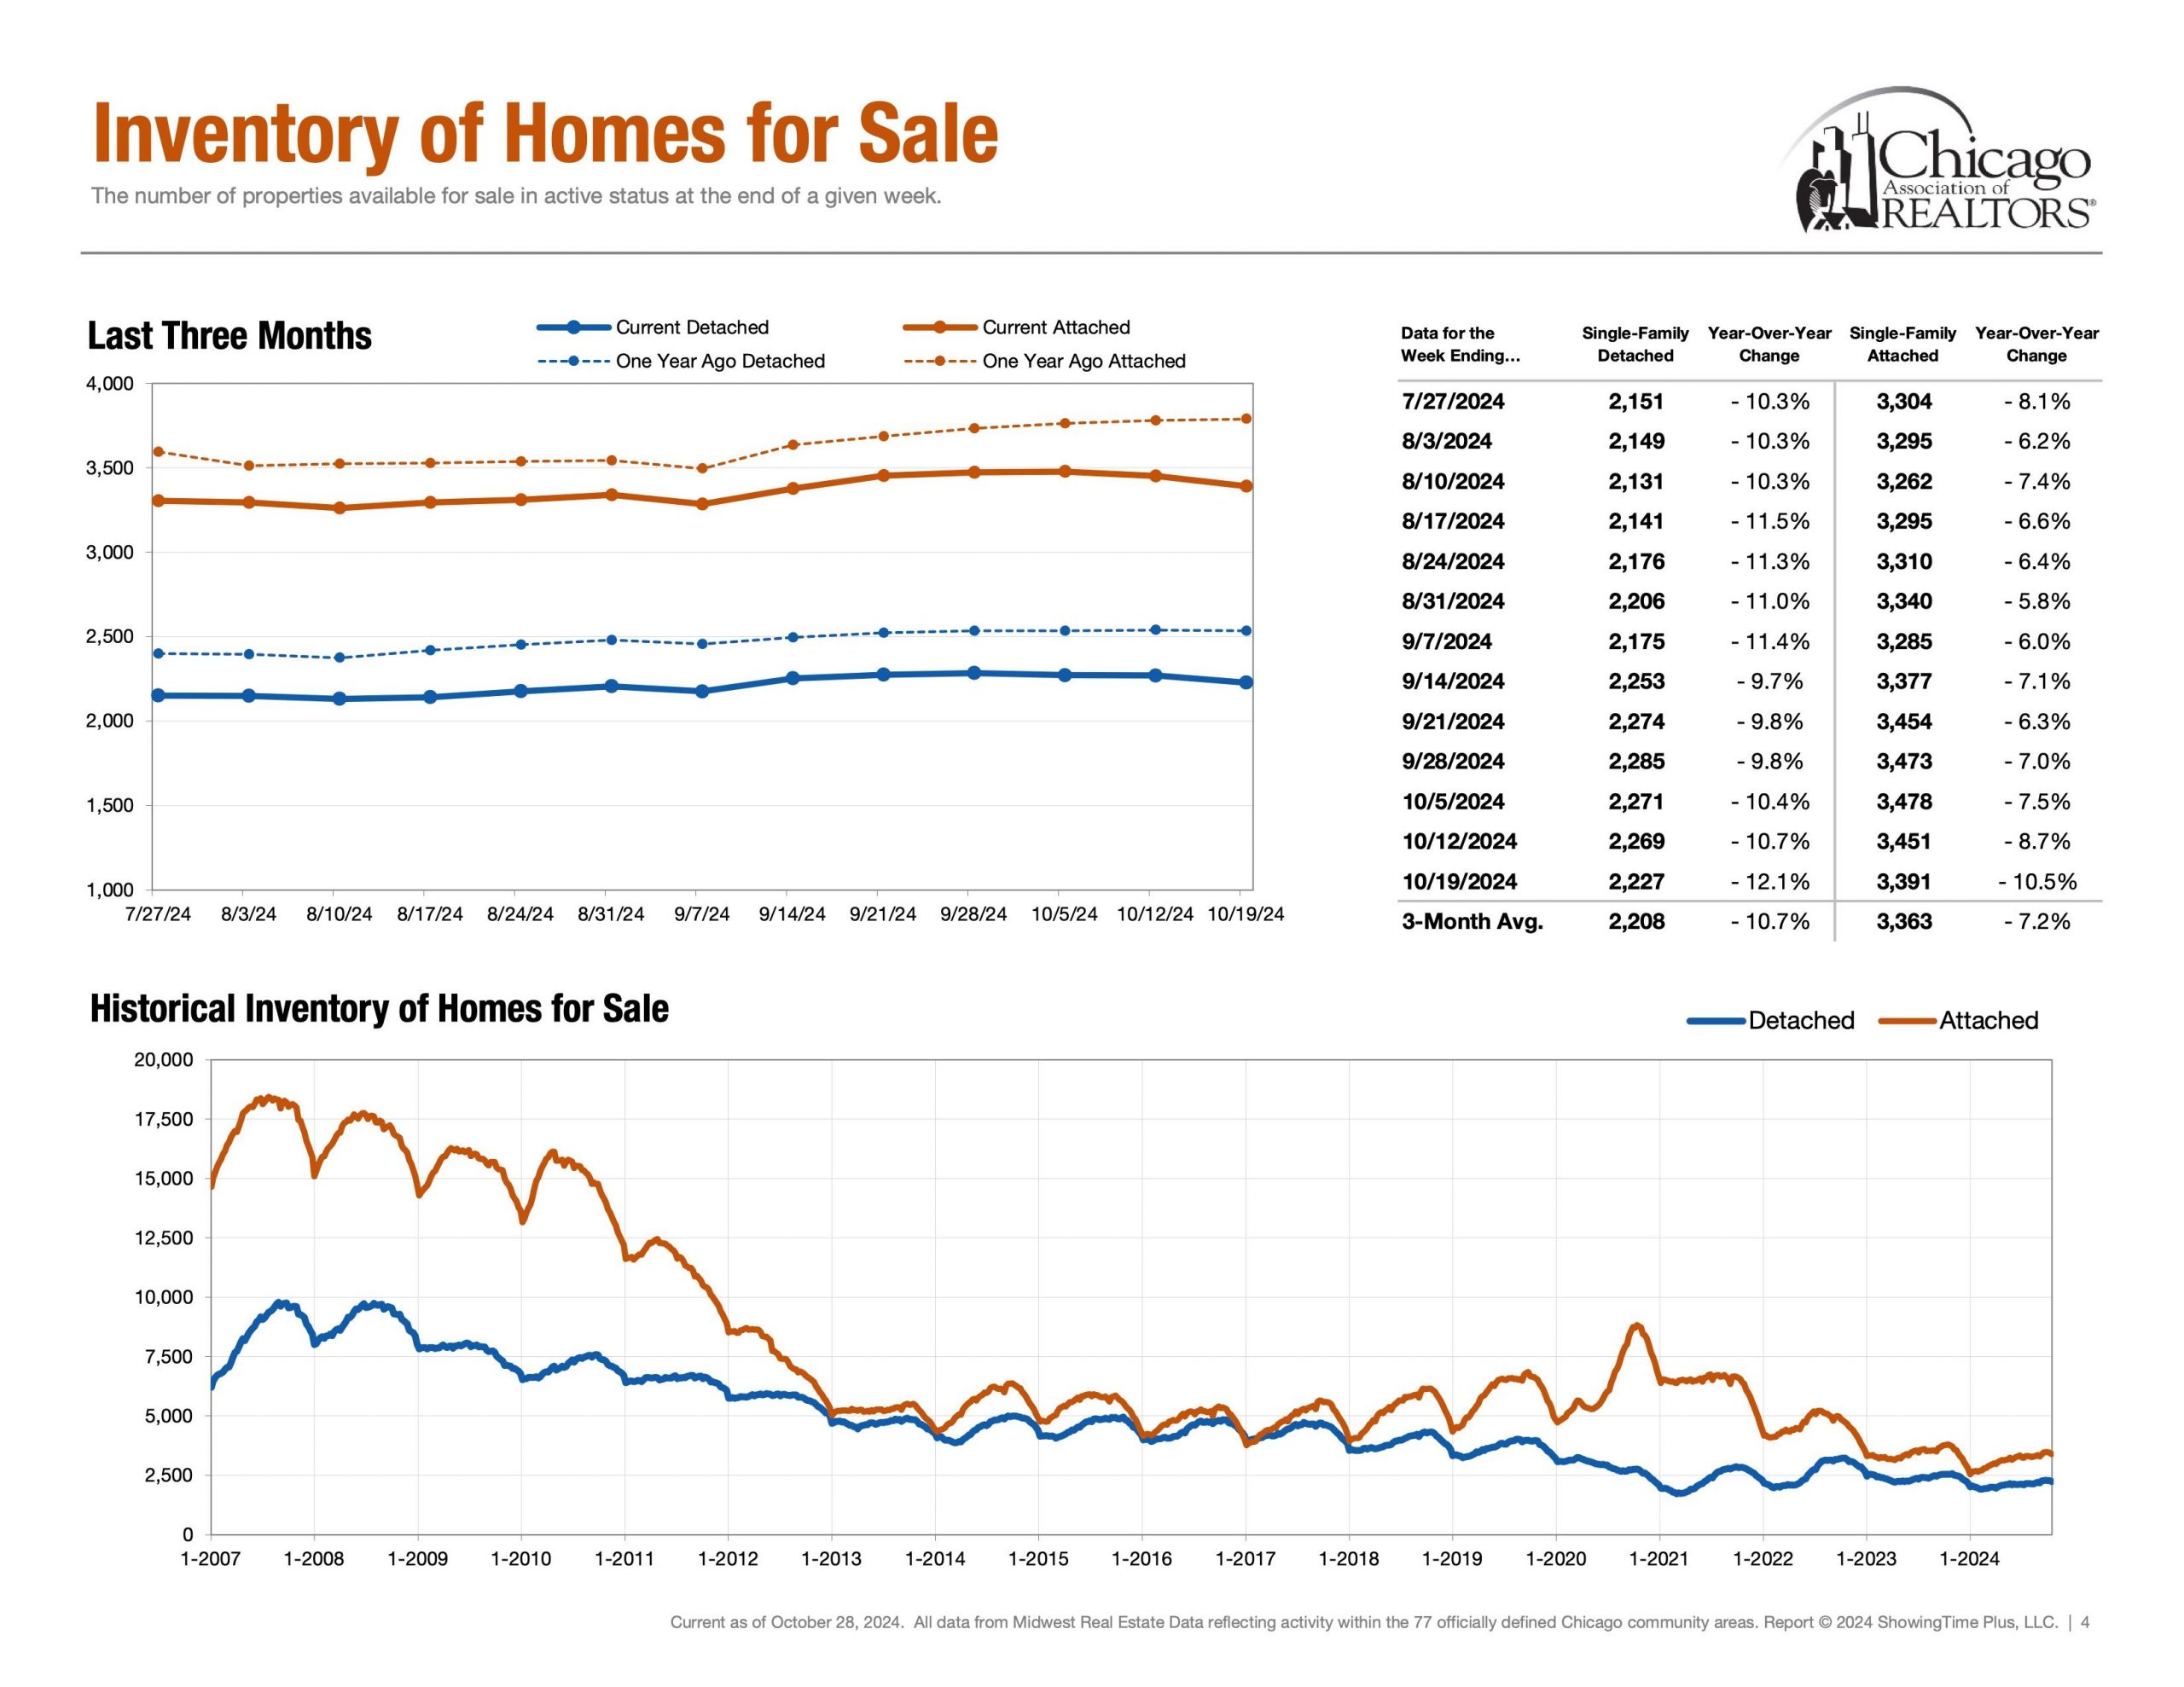
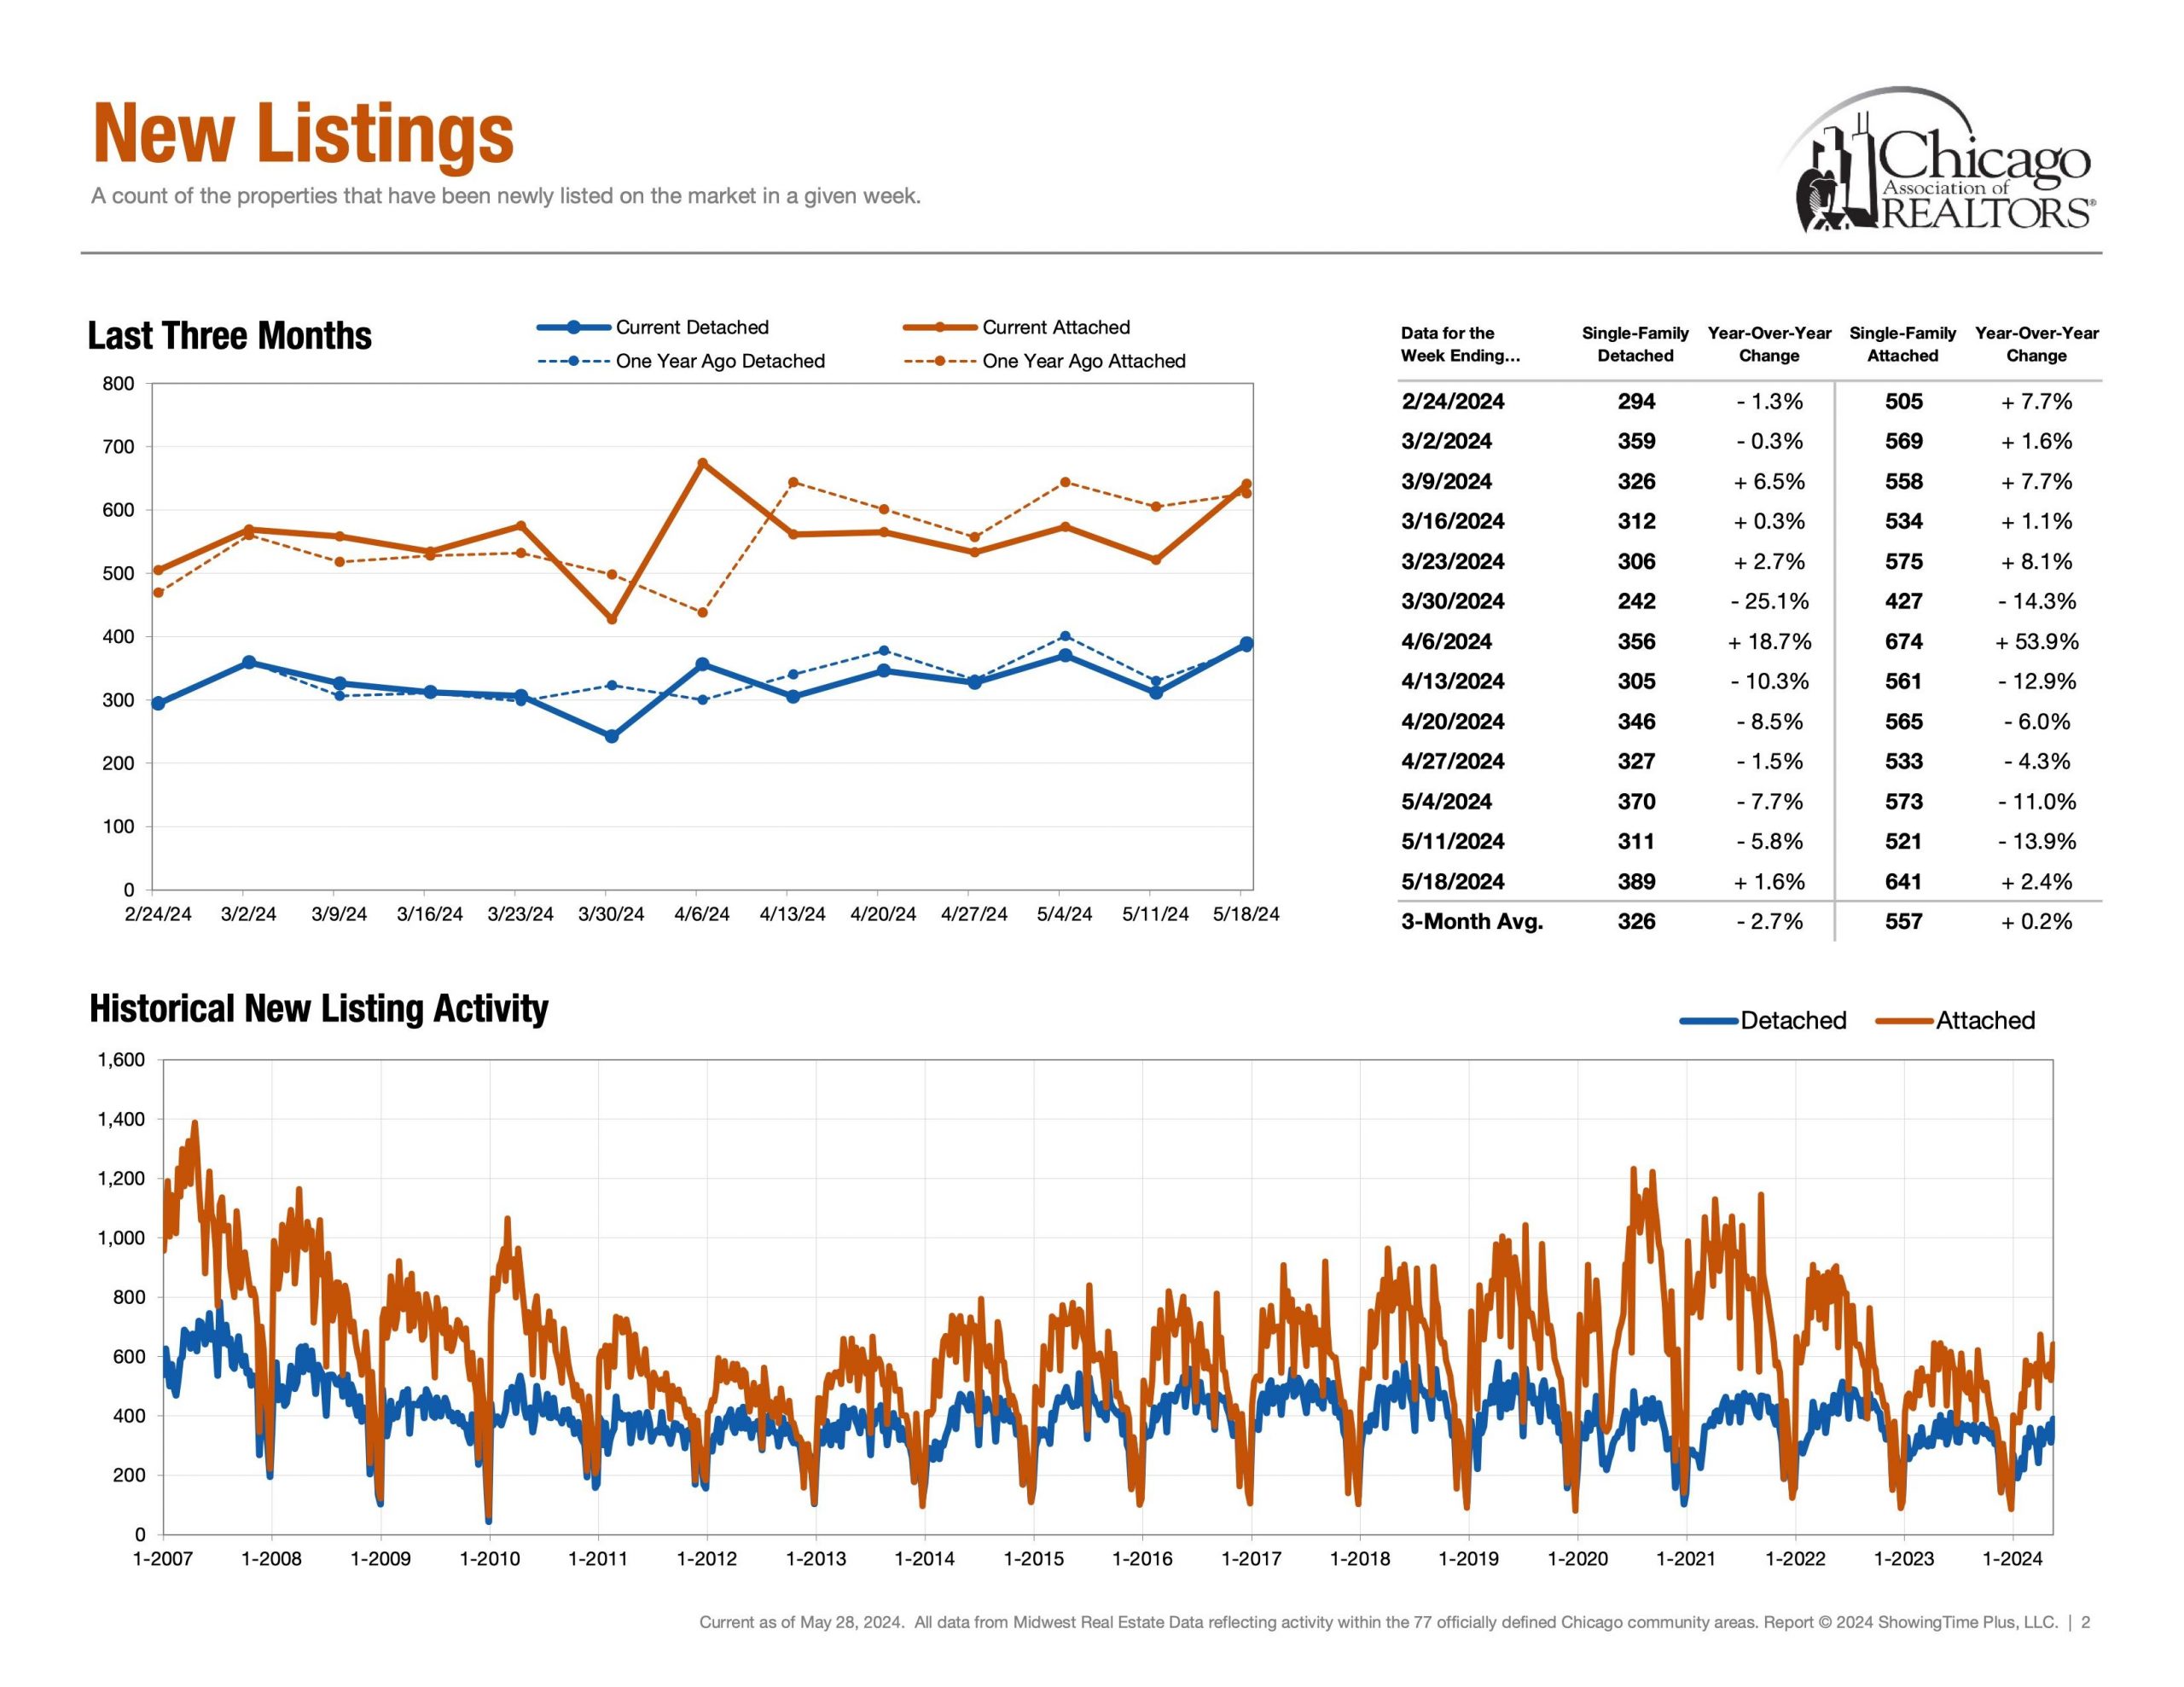
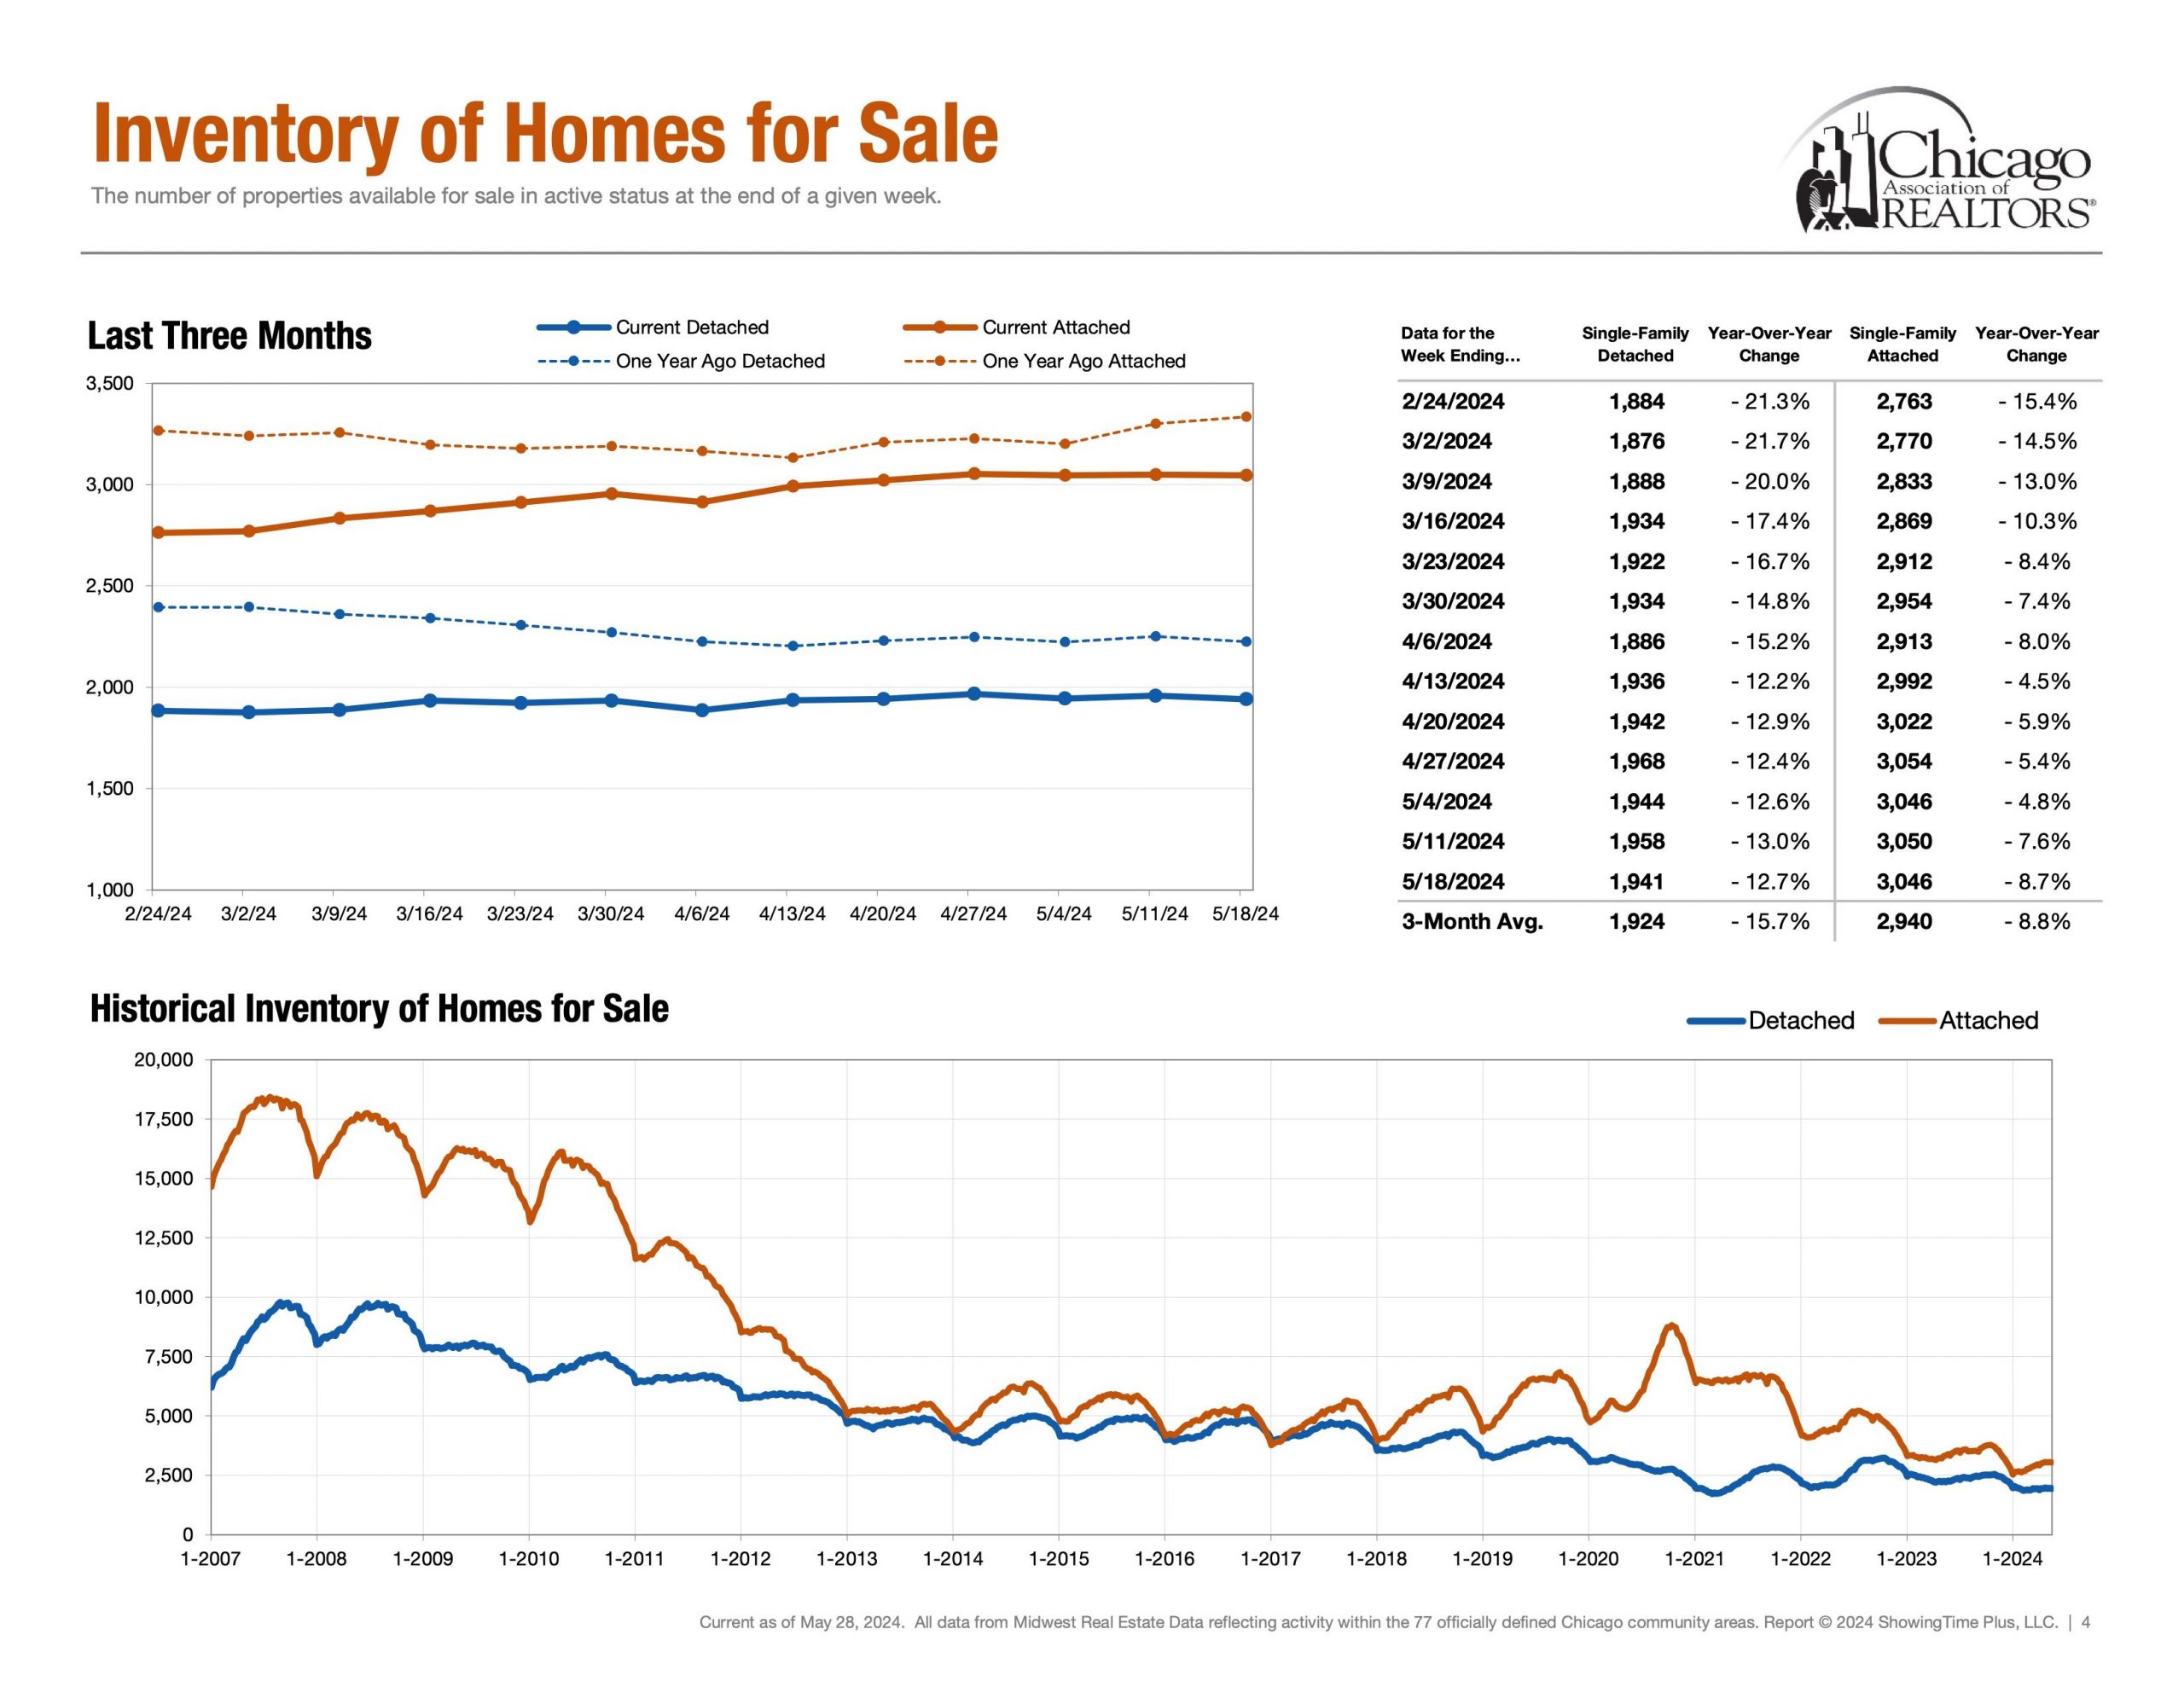
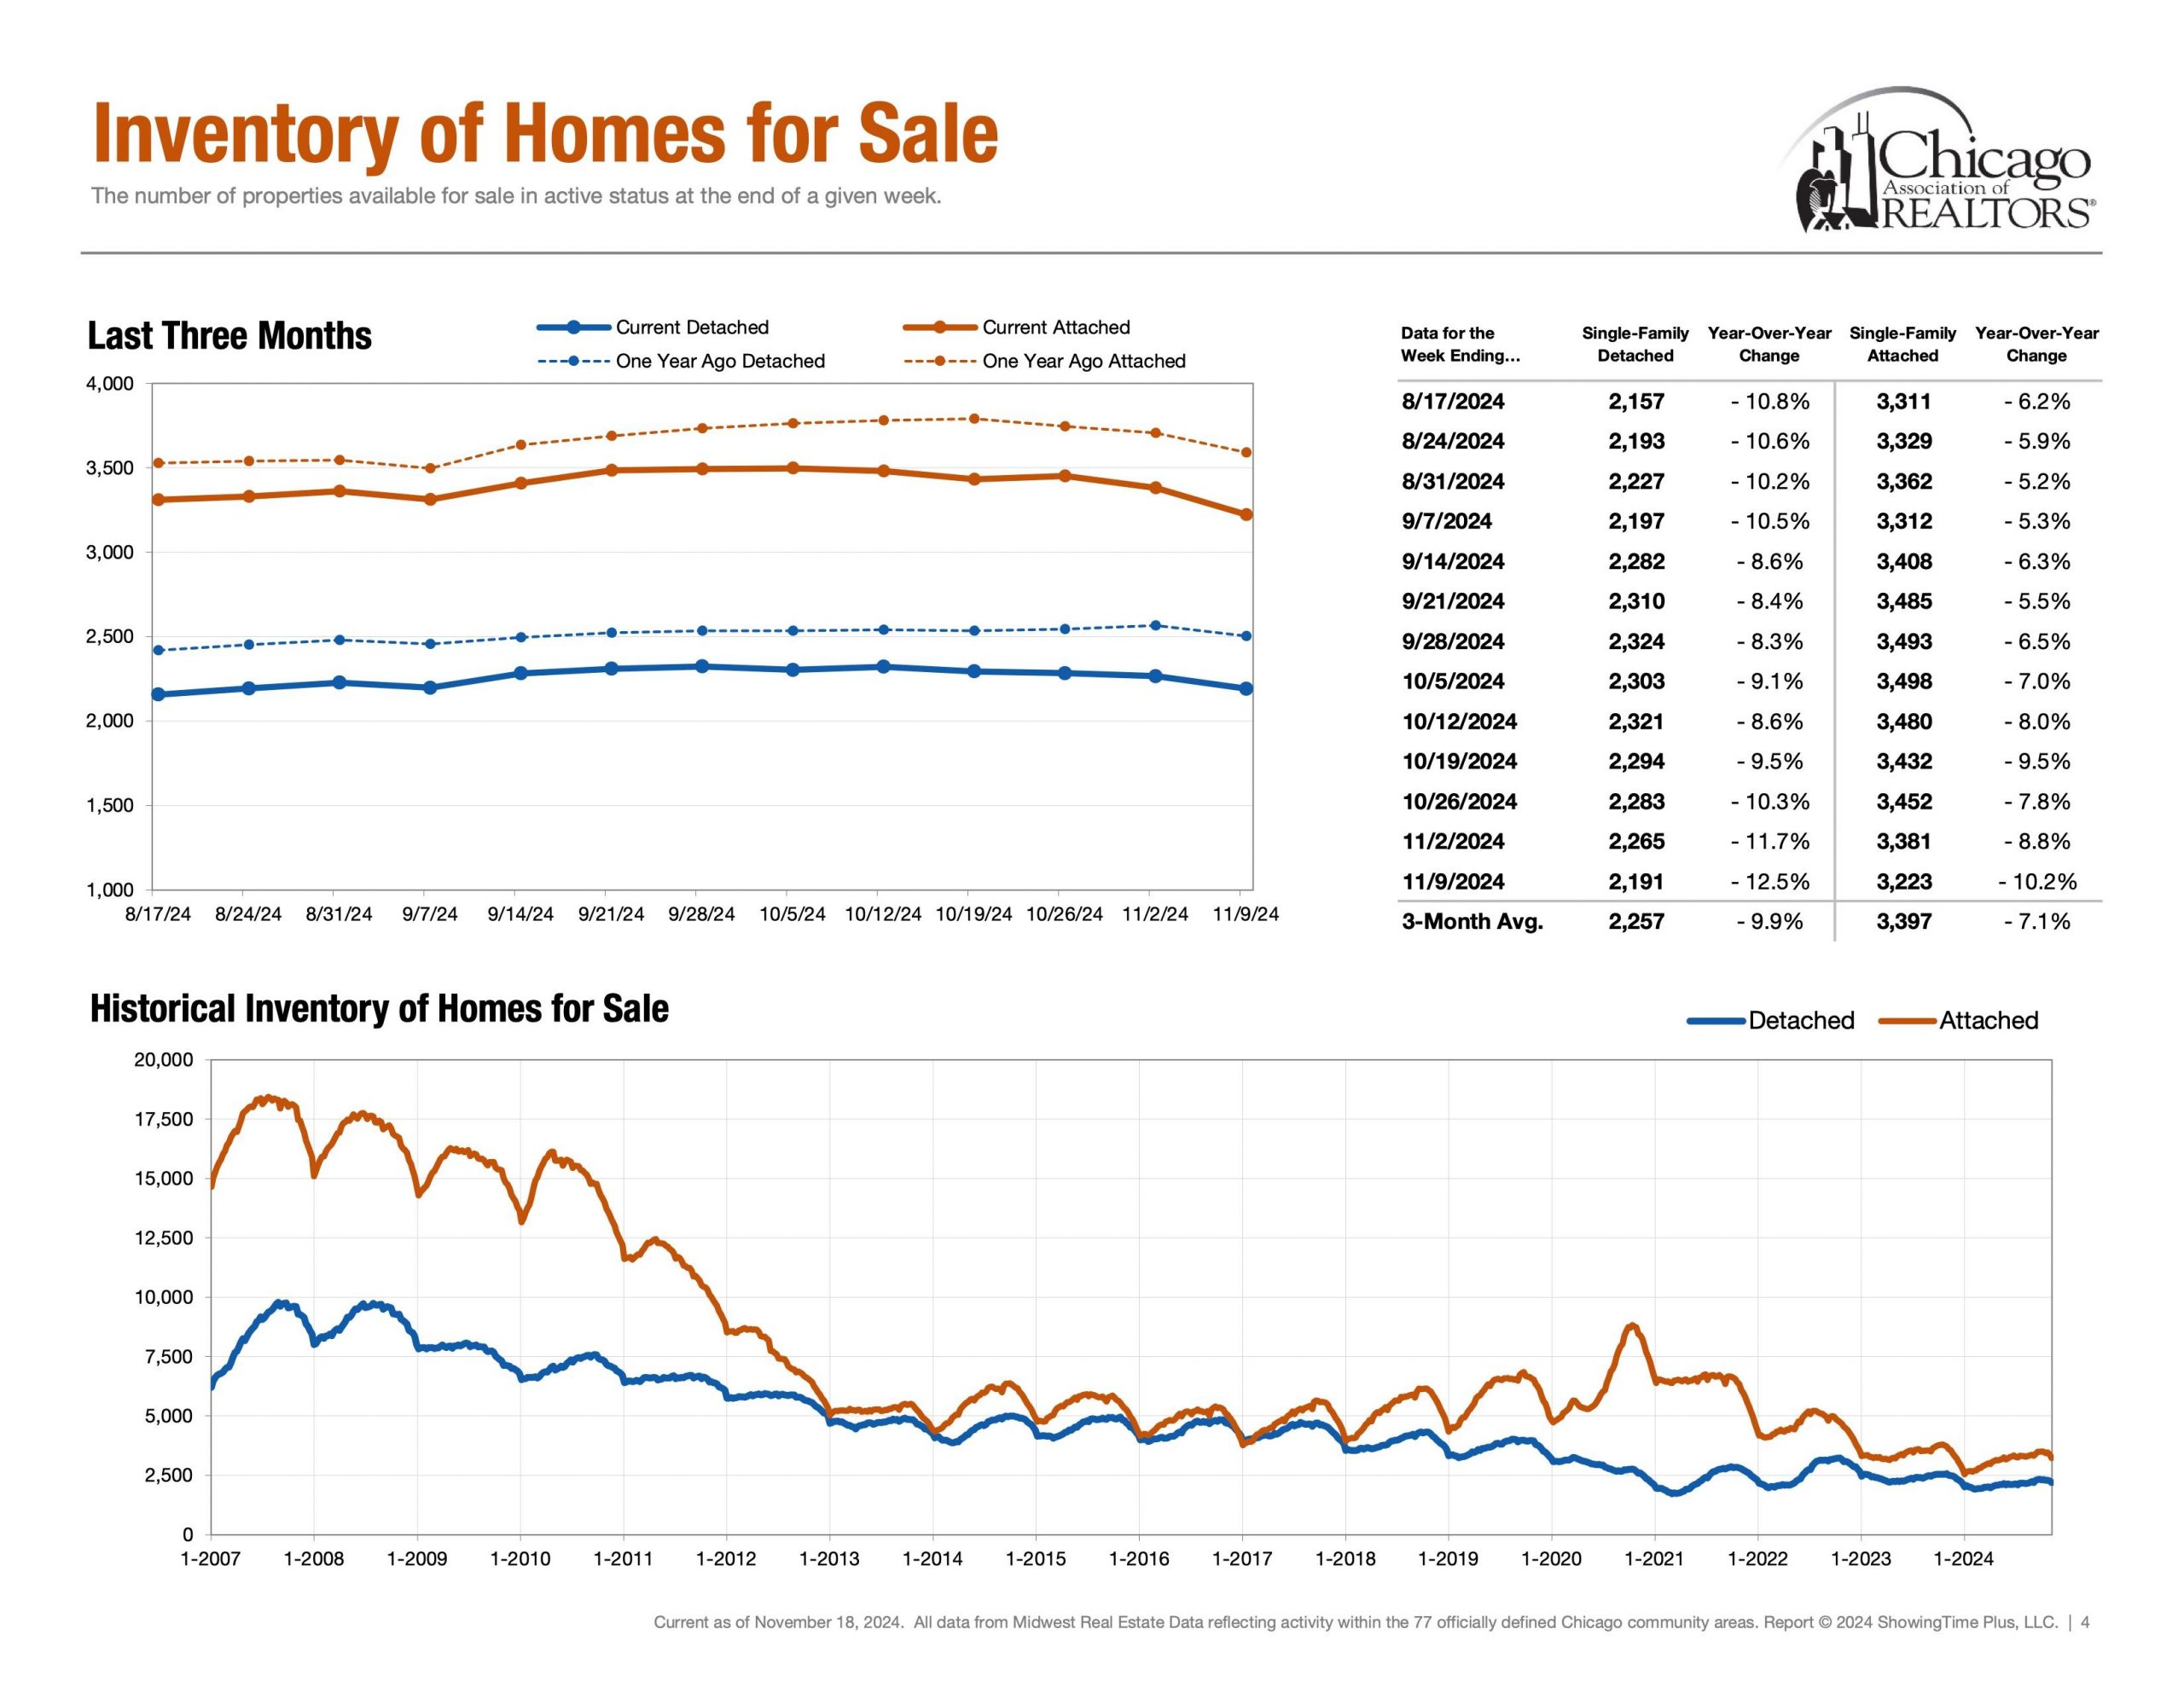
Detached Single = 2,191 Properties (Nov 2nd – Nov 9th)

Attached Single = 3,223 Properties (Nov 2nd – Nov 9th)

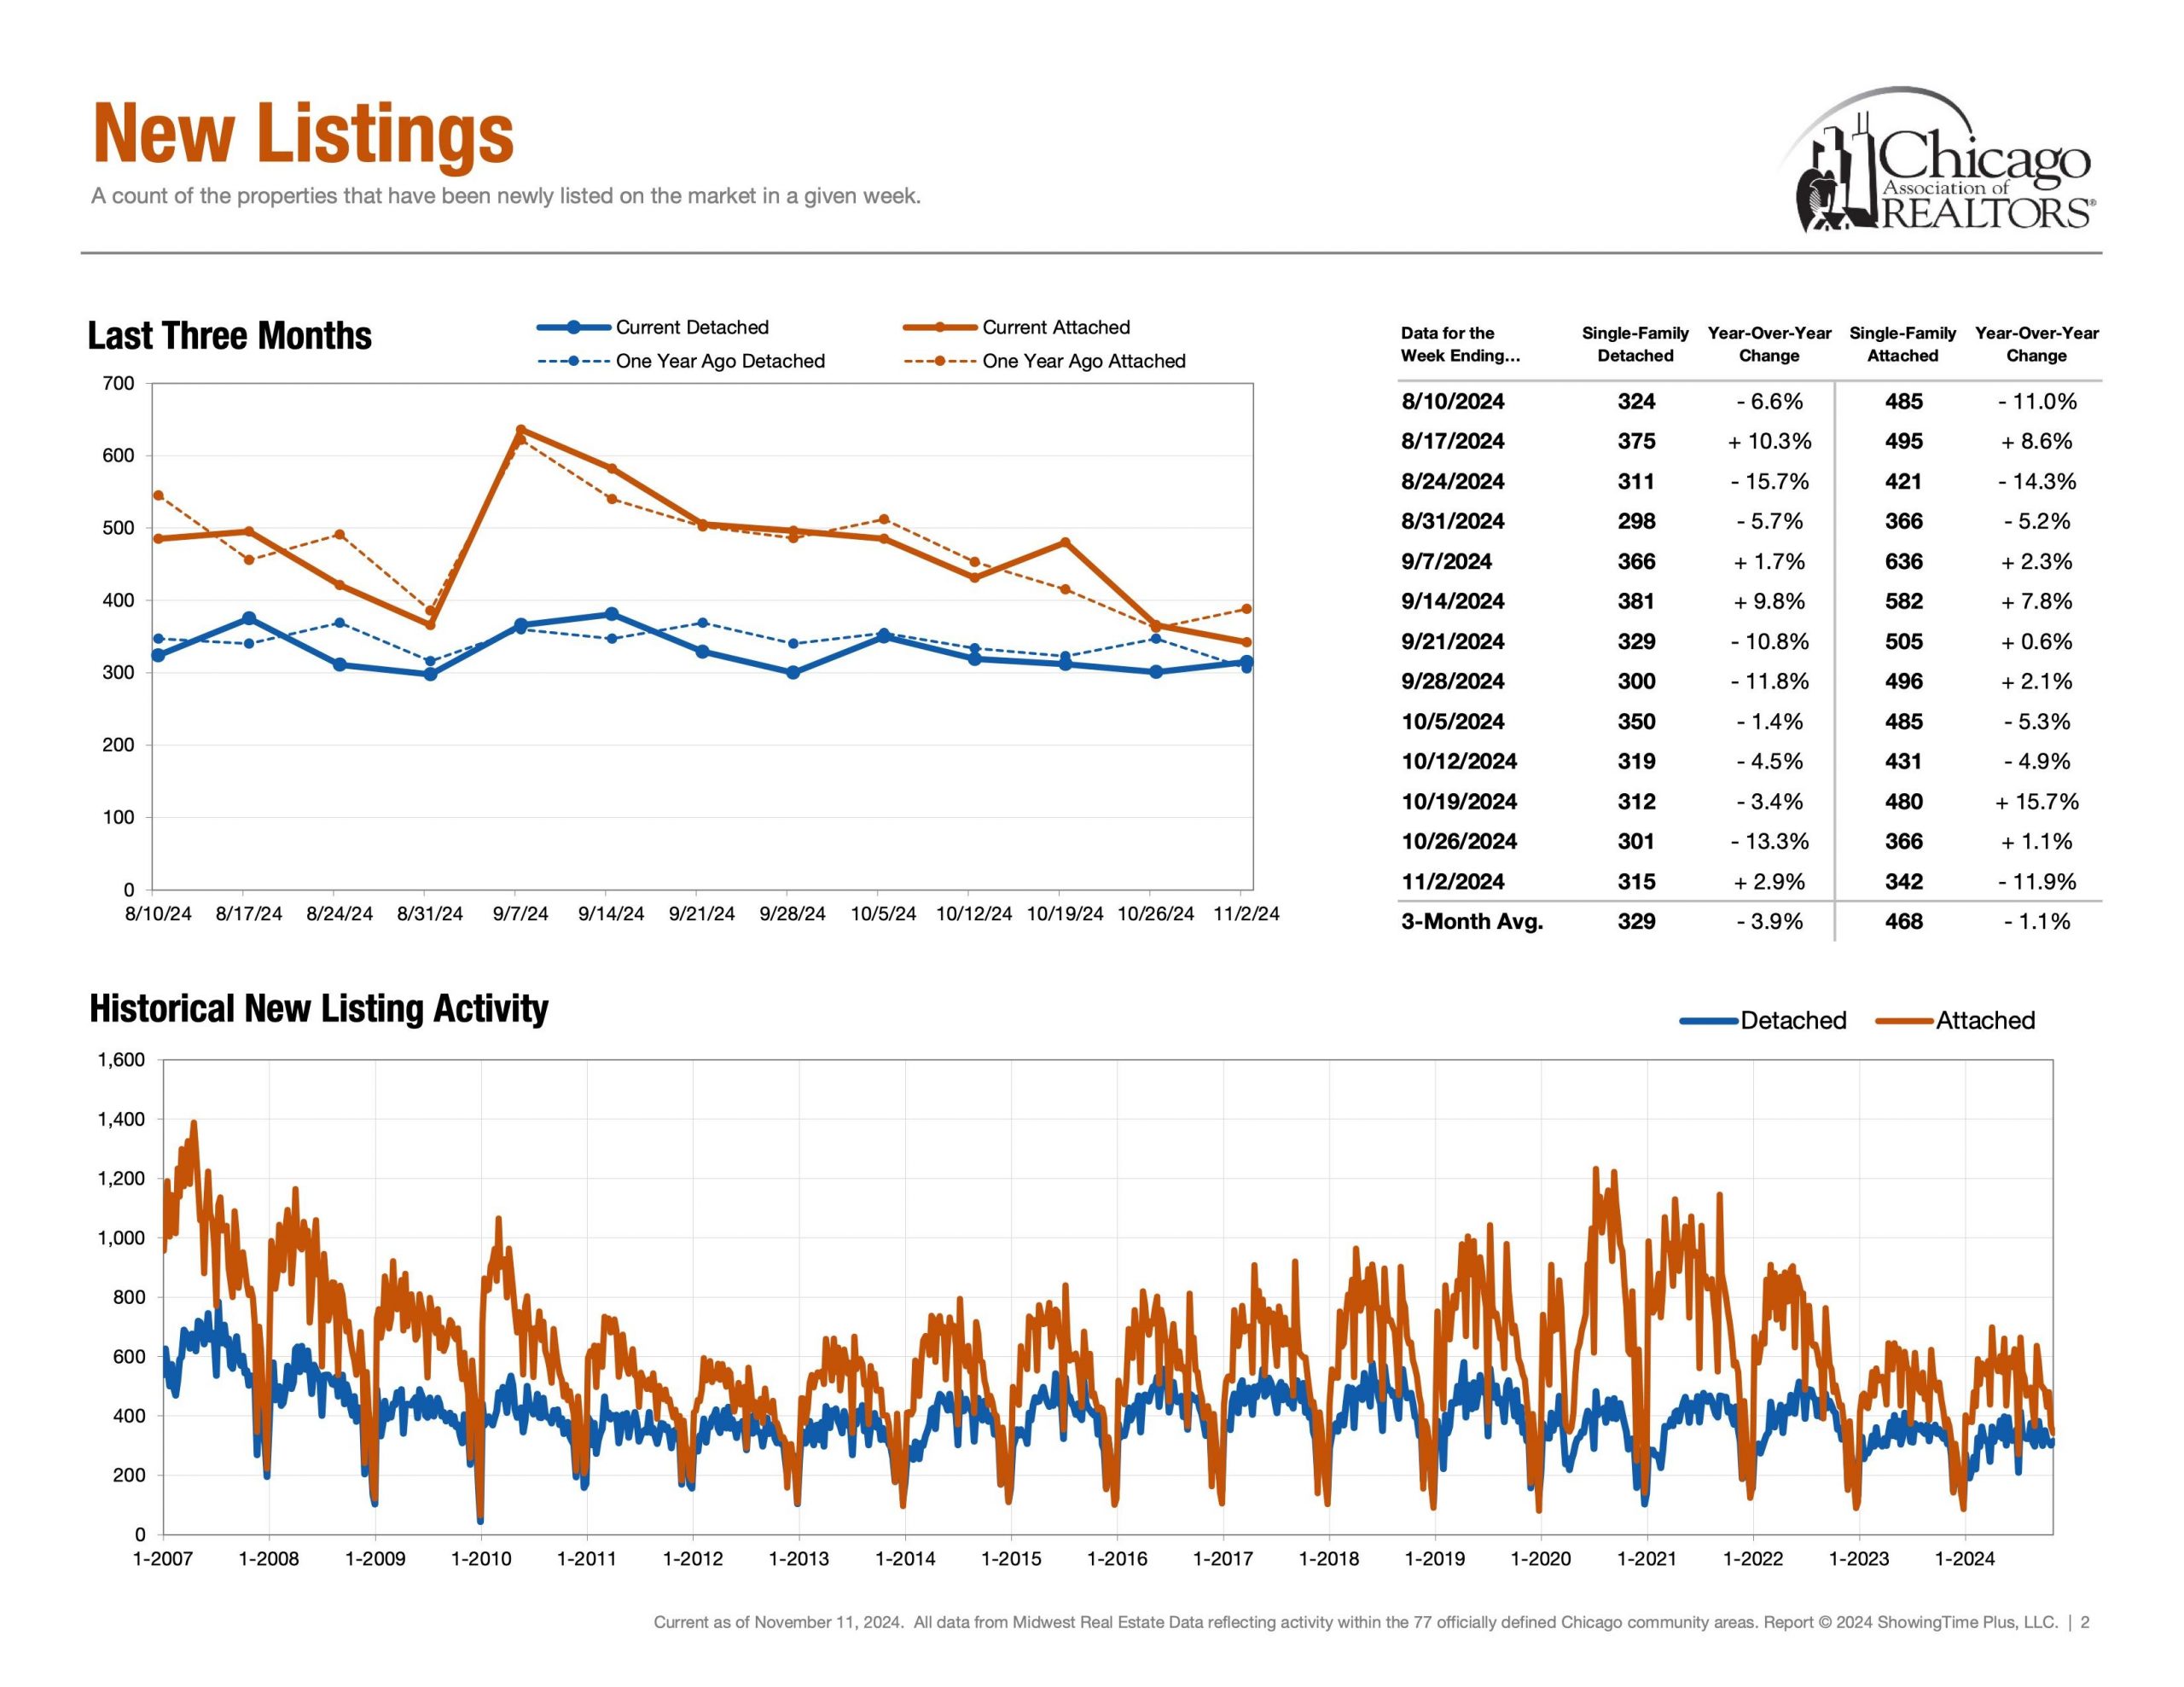
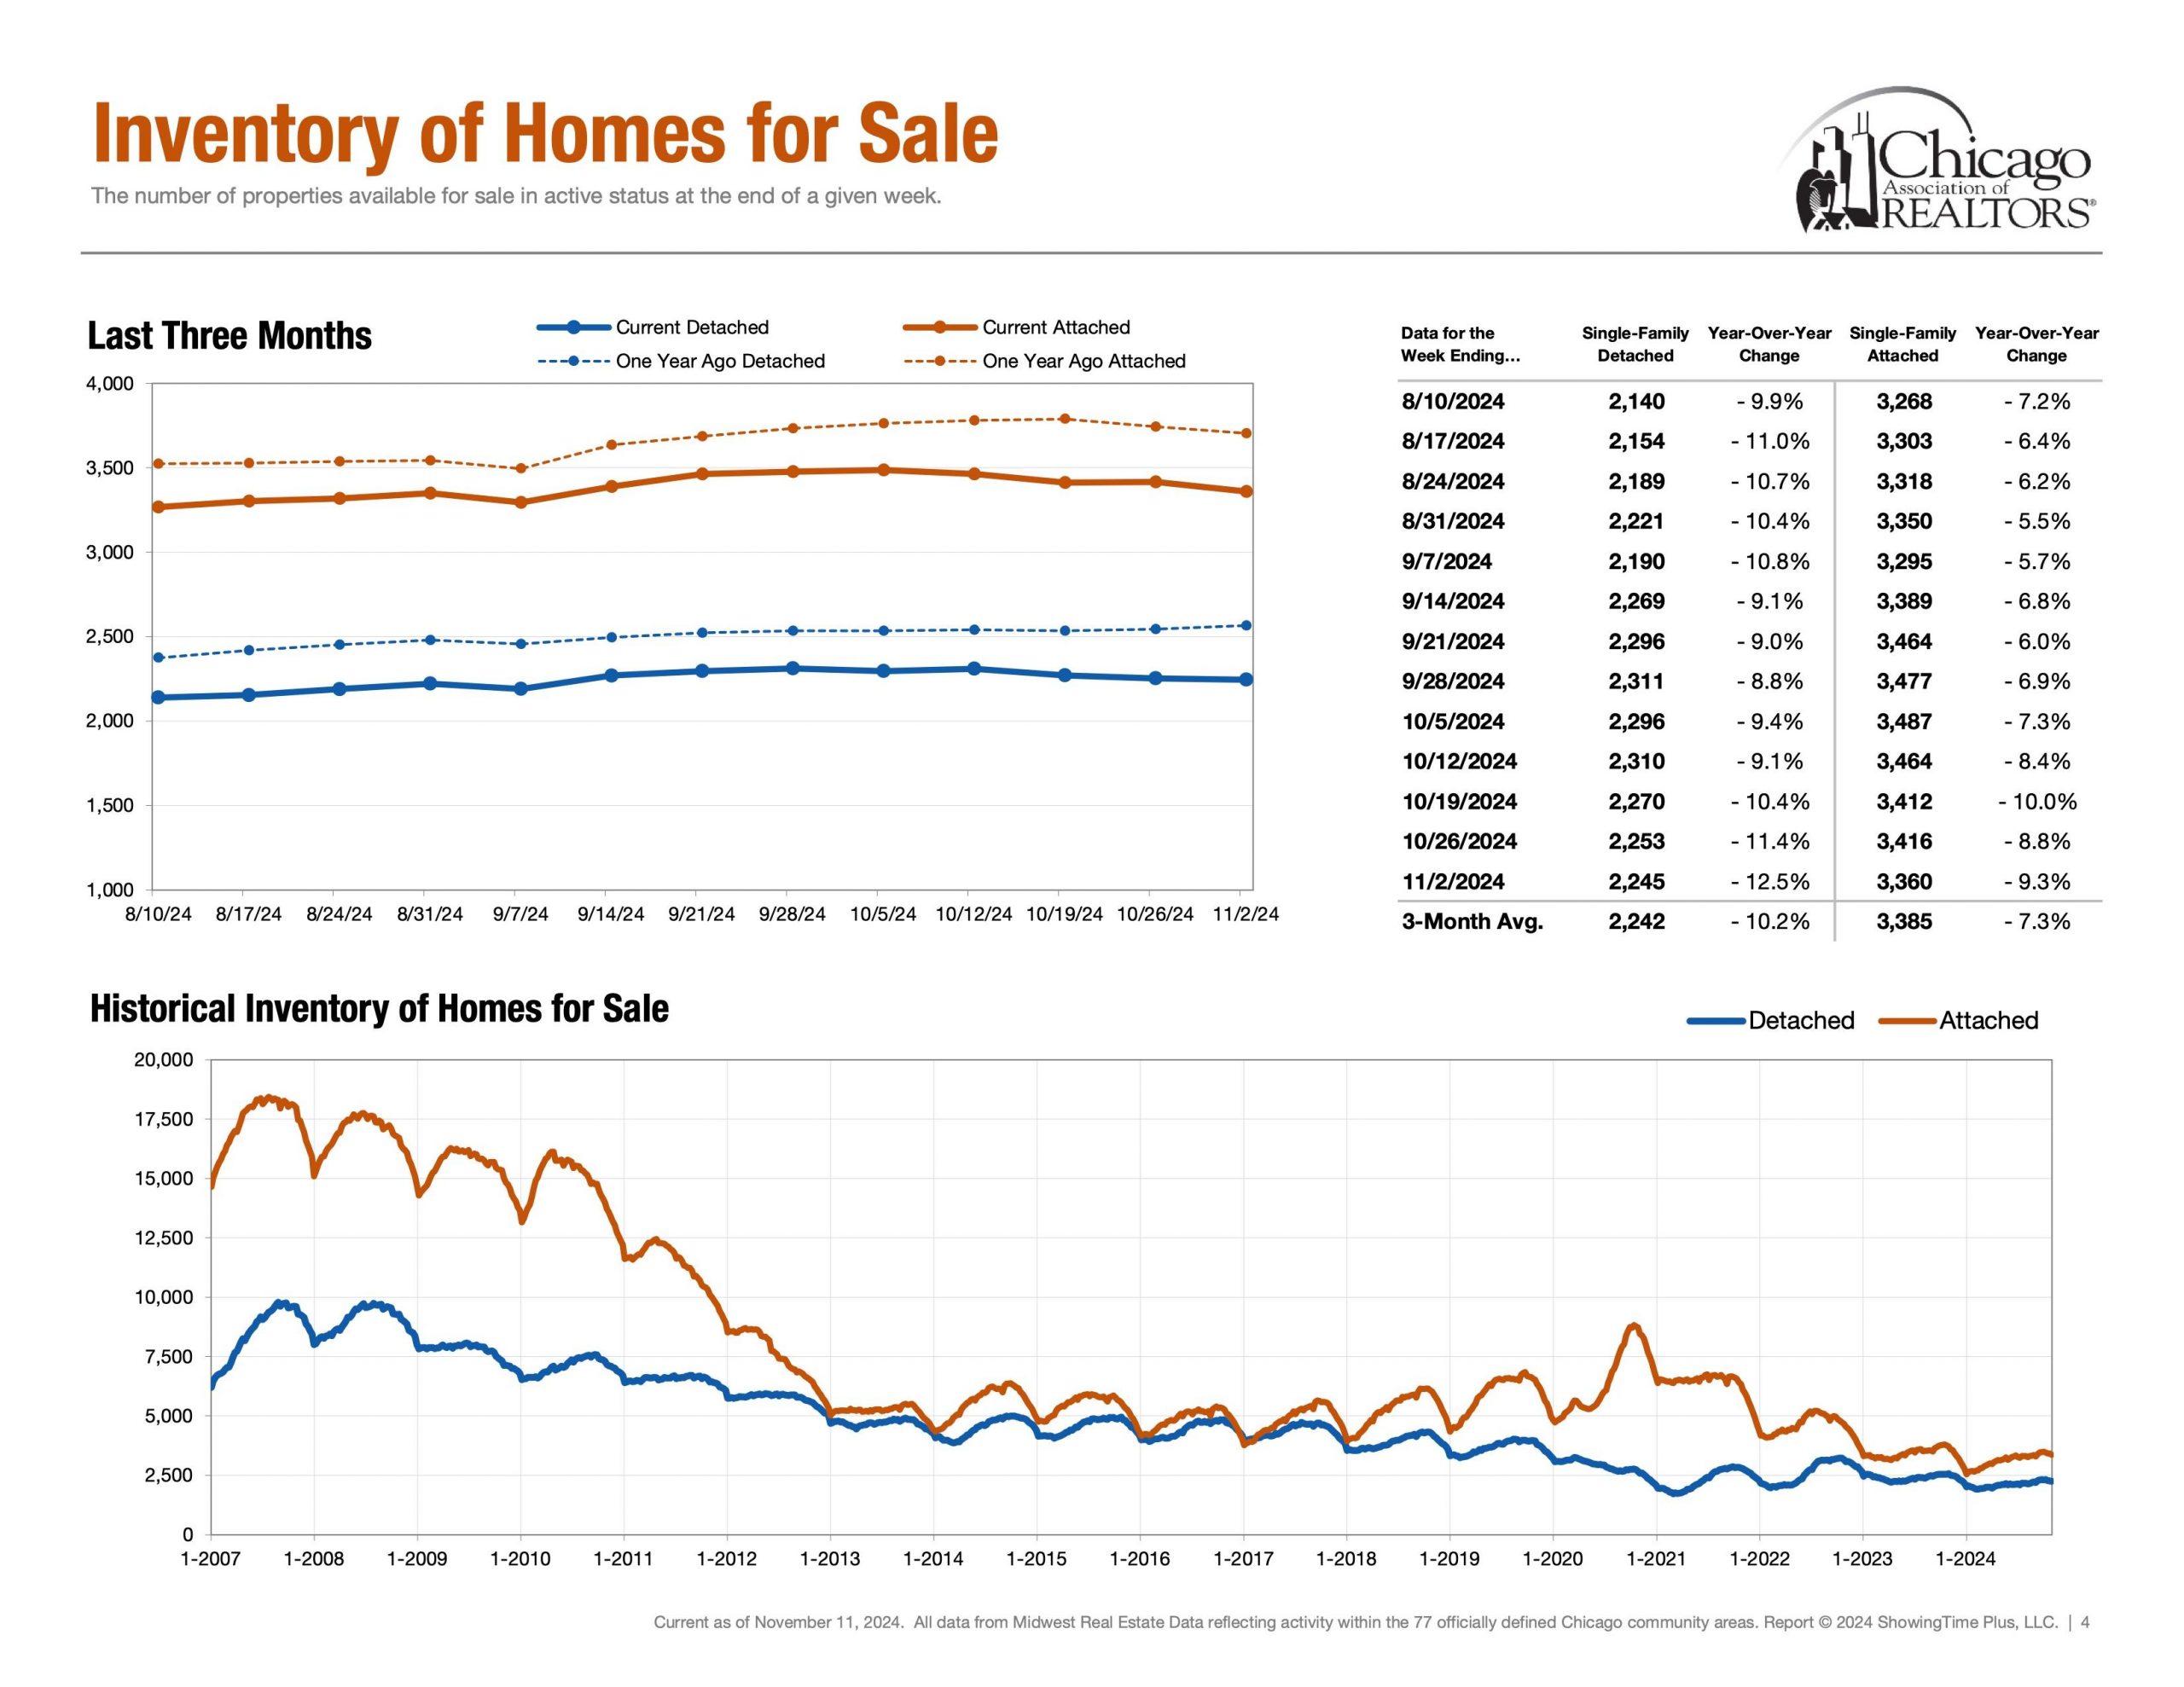
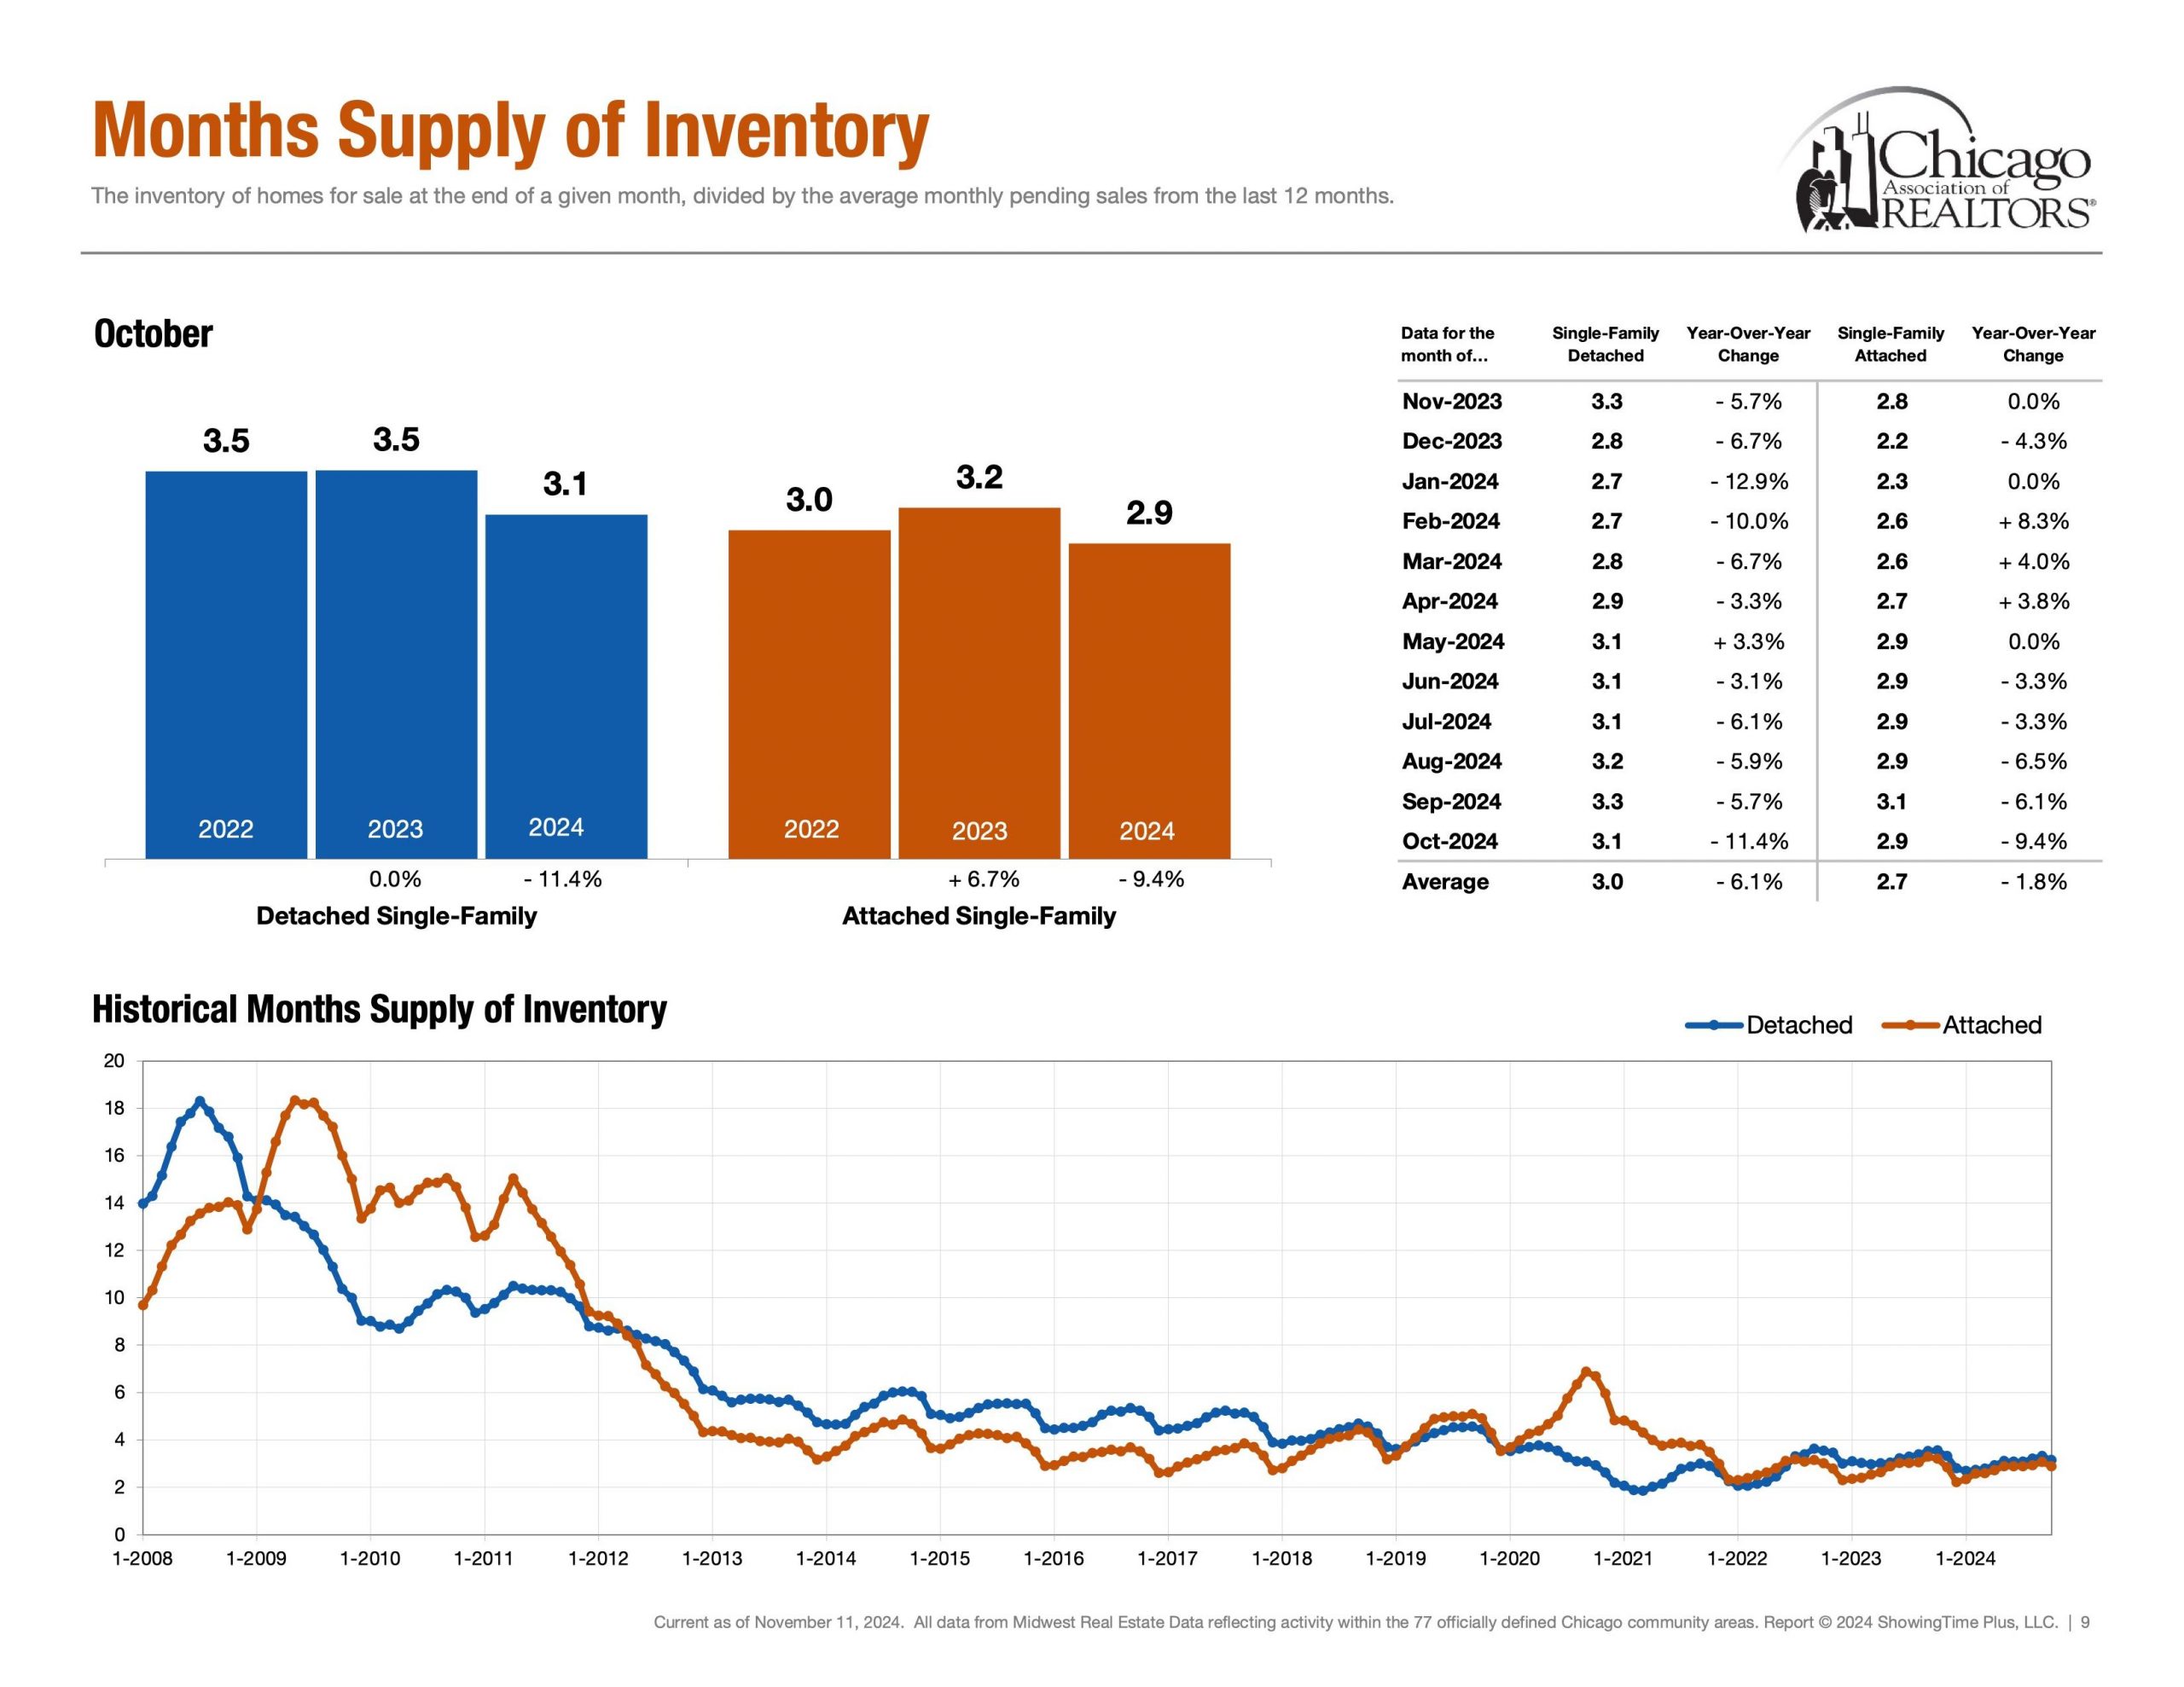
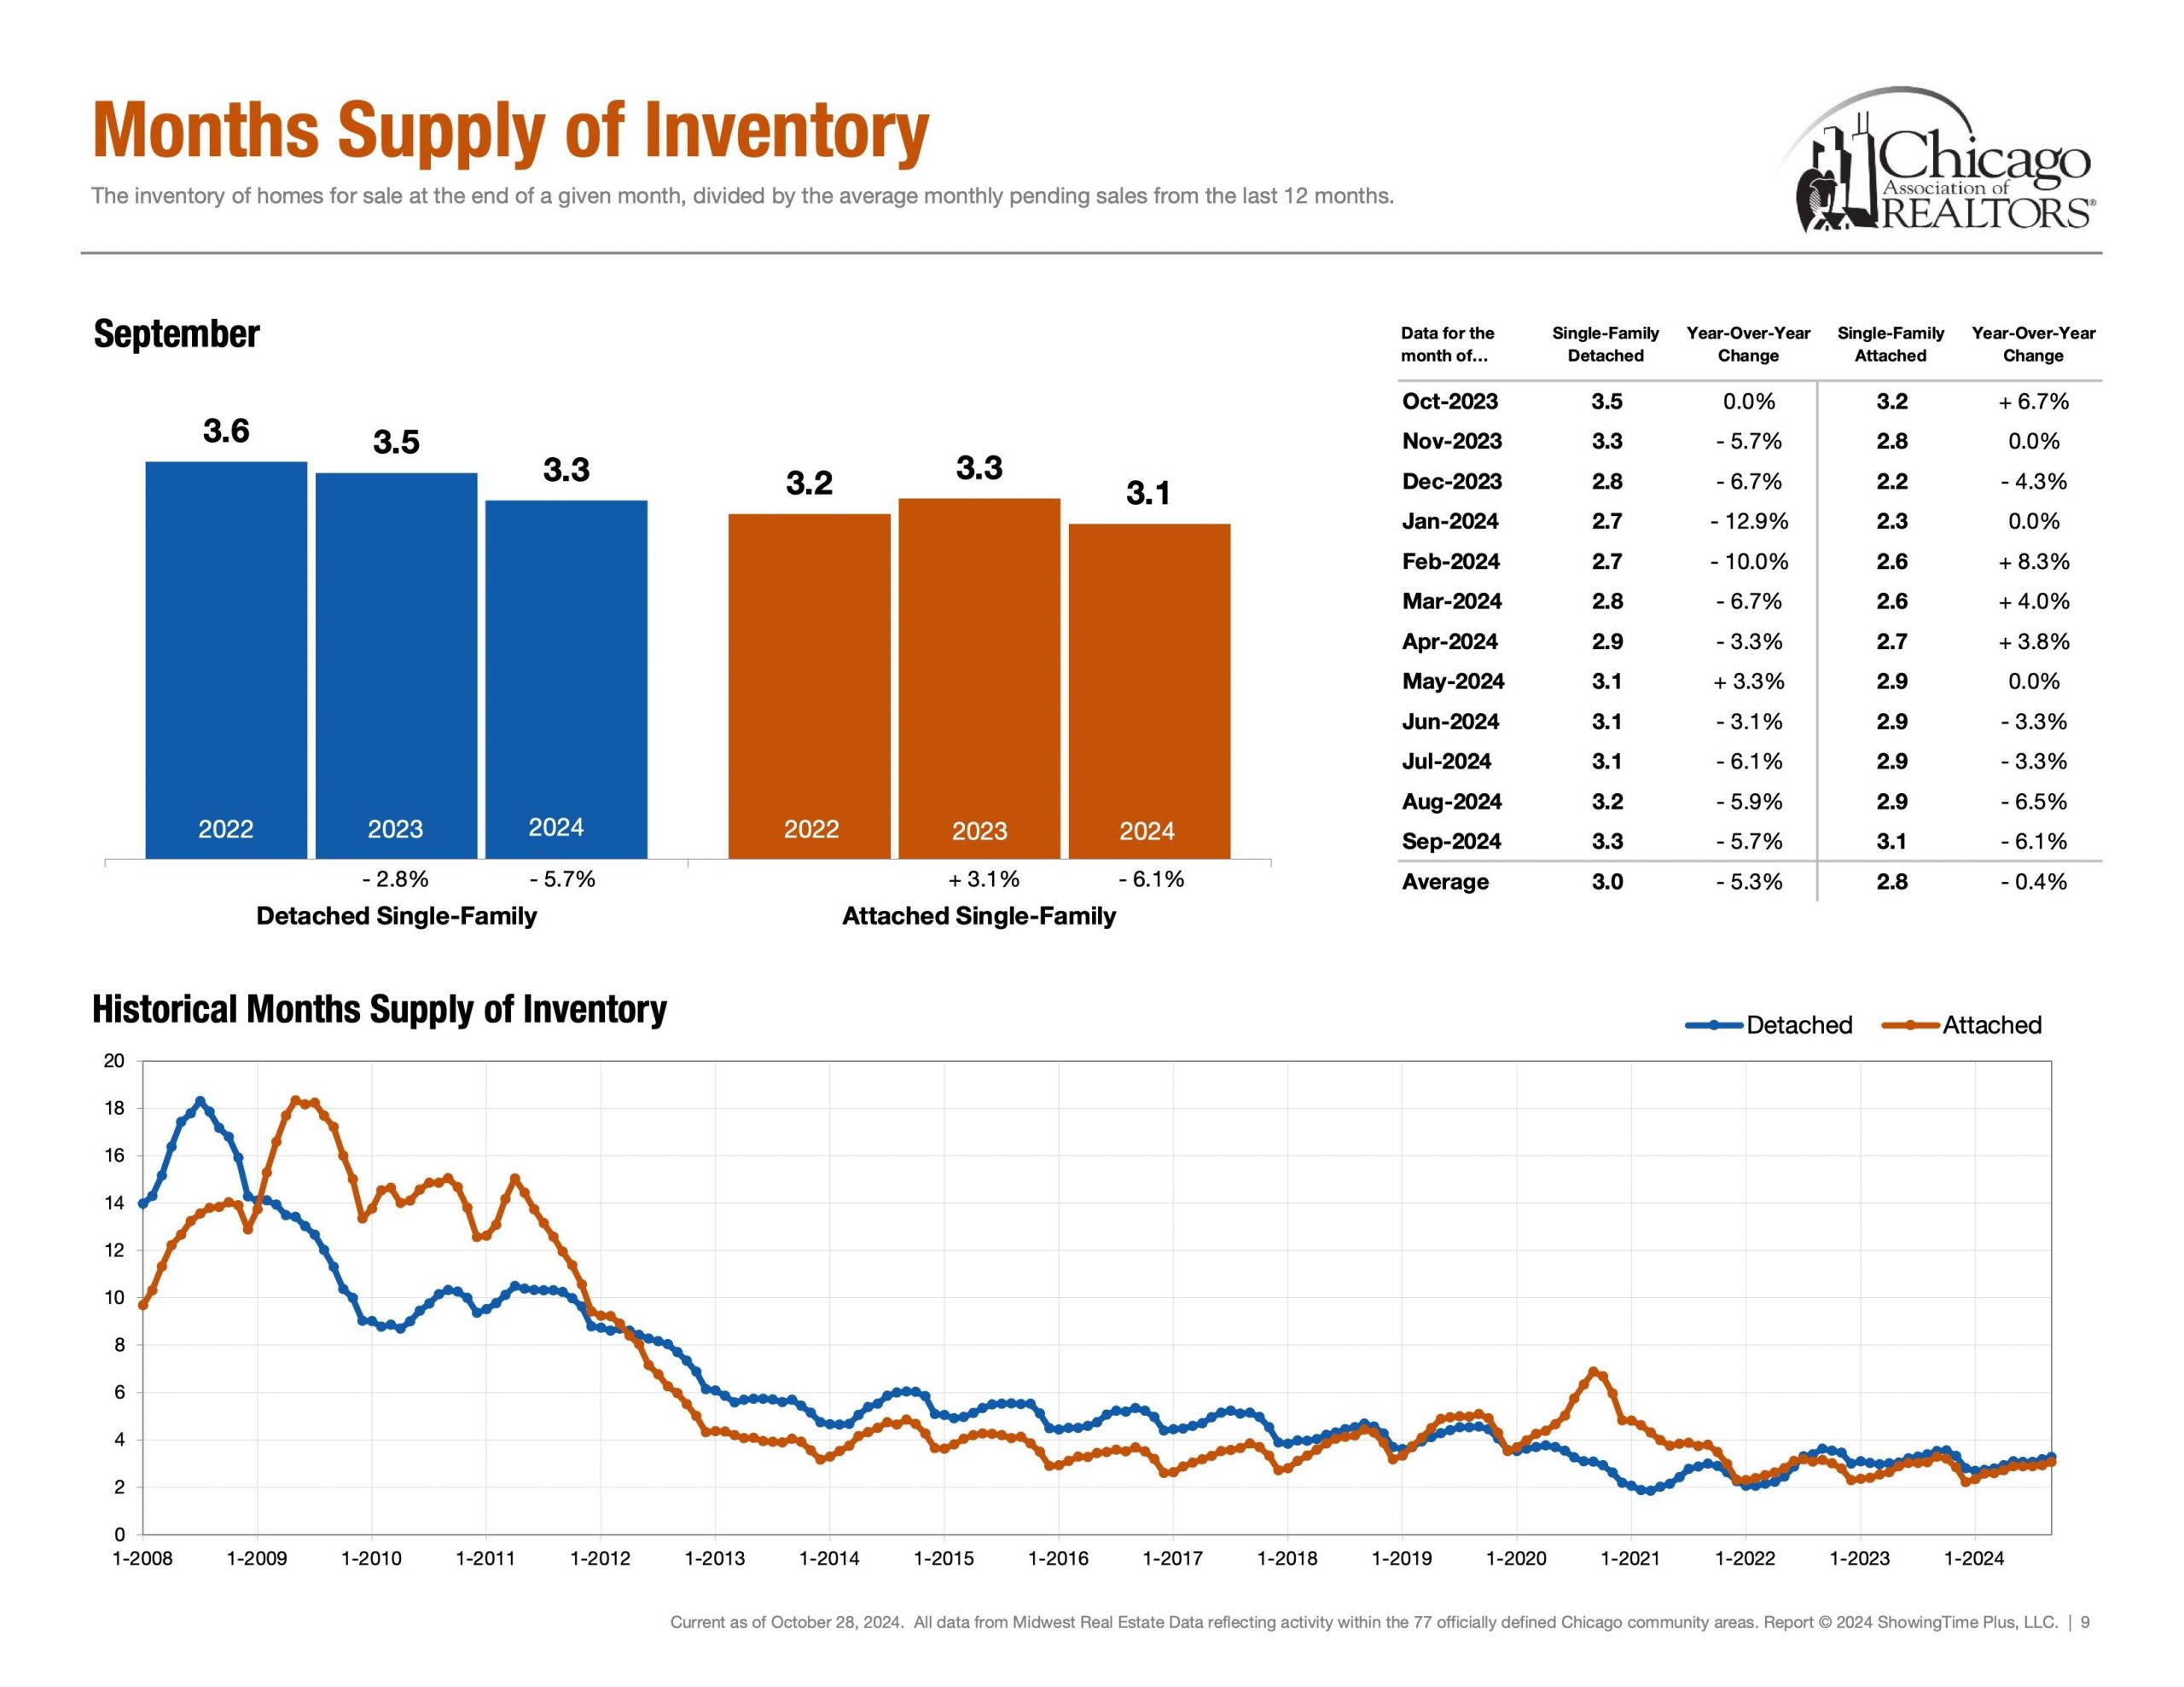
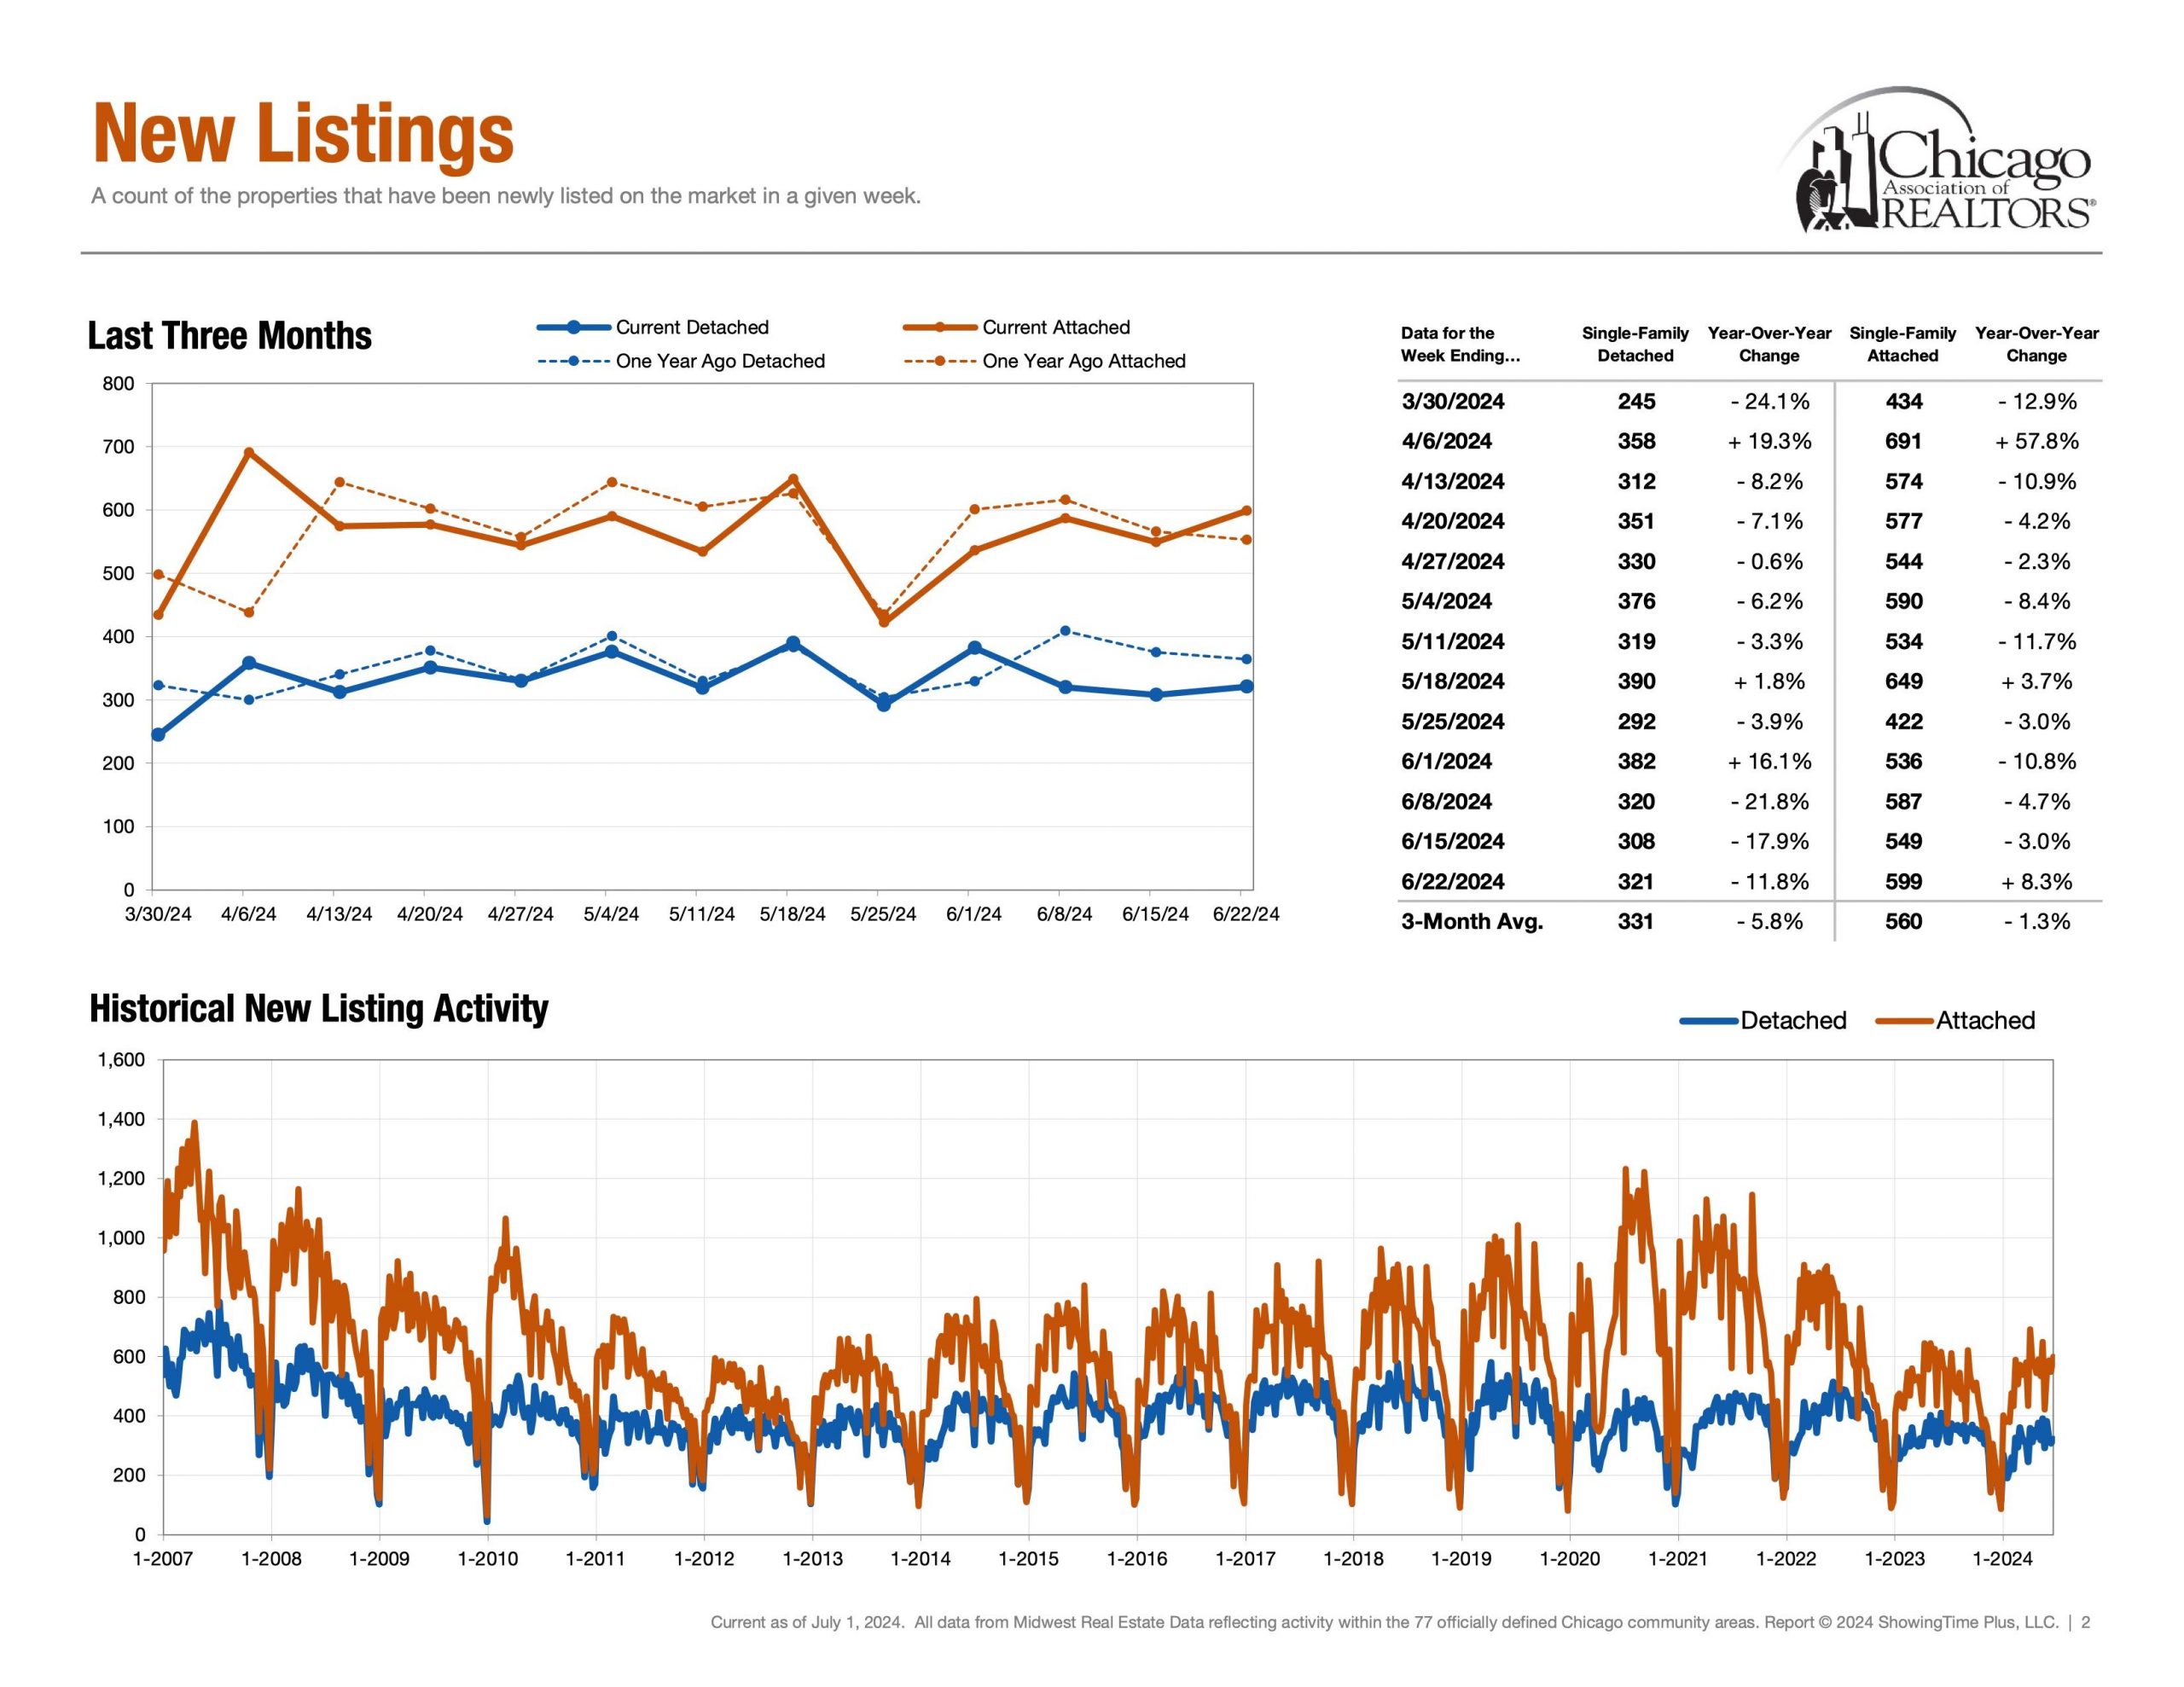
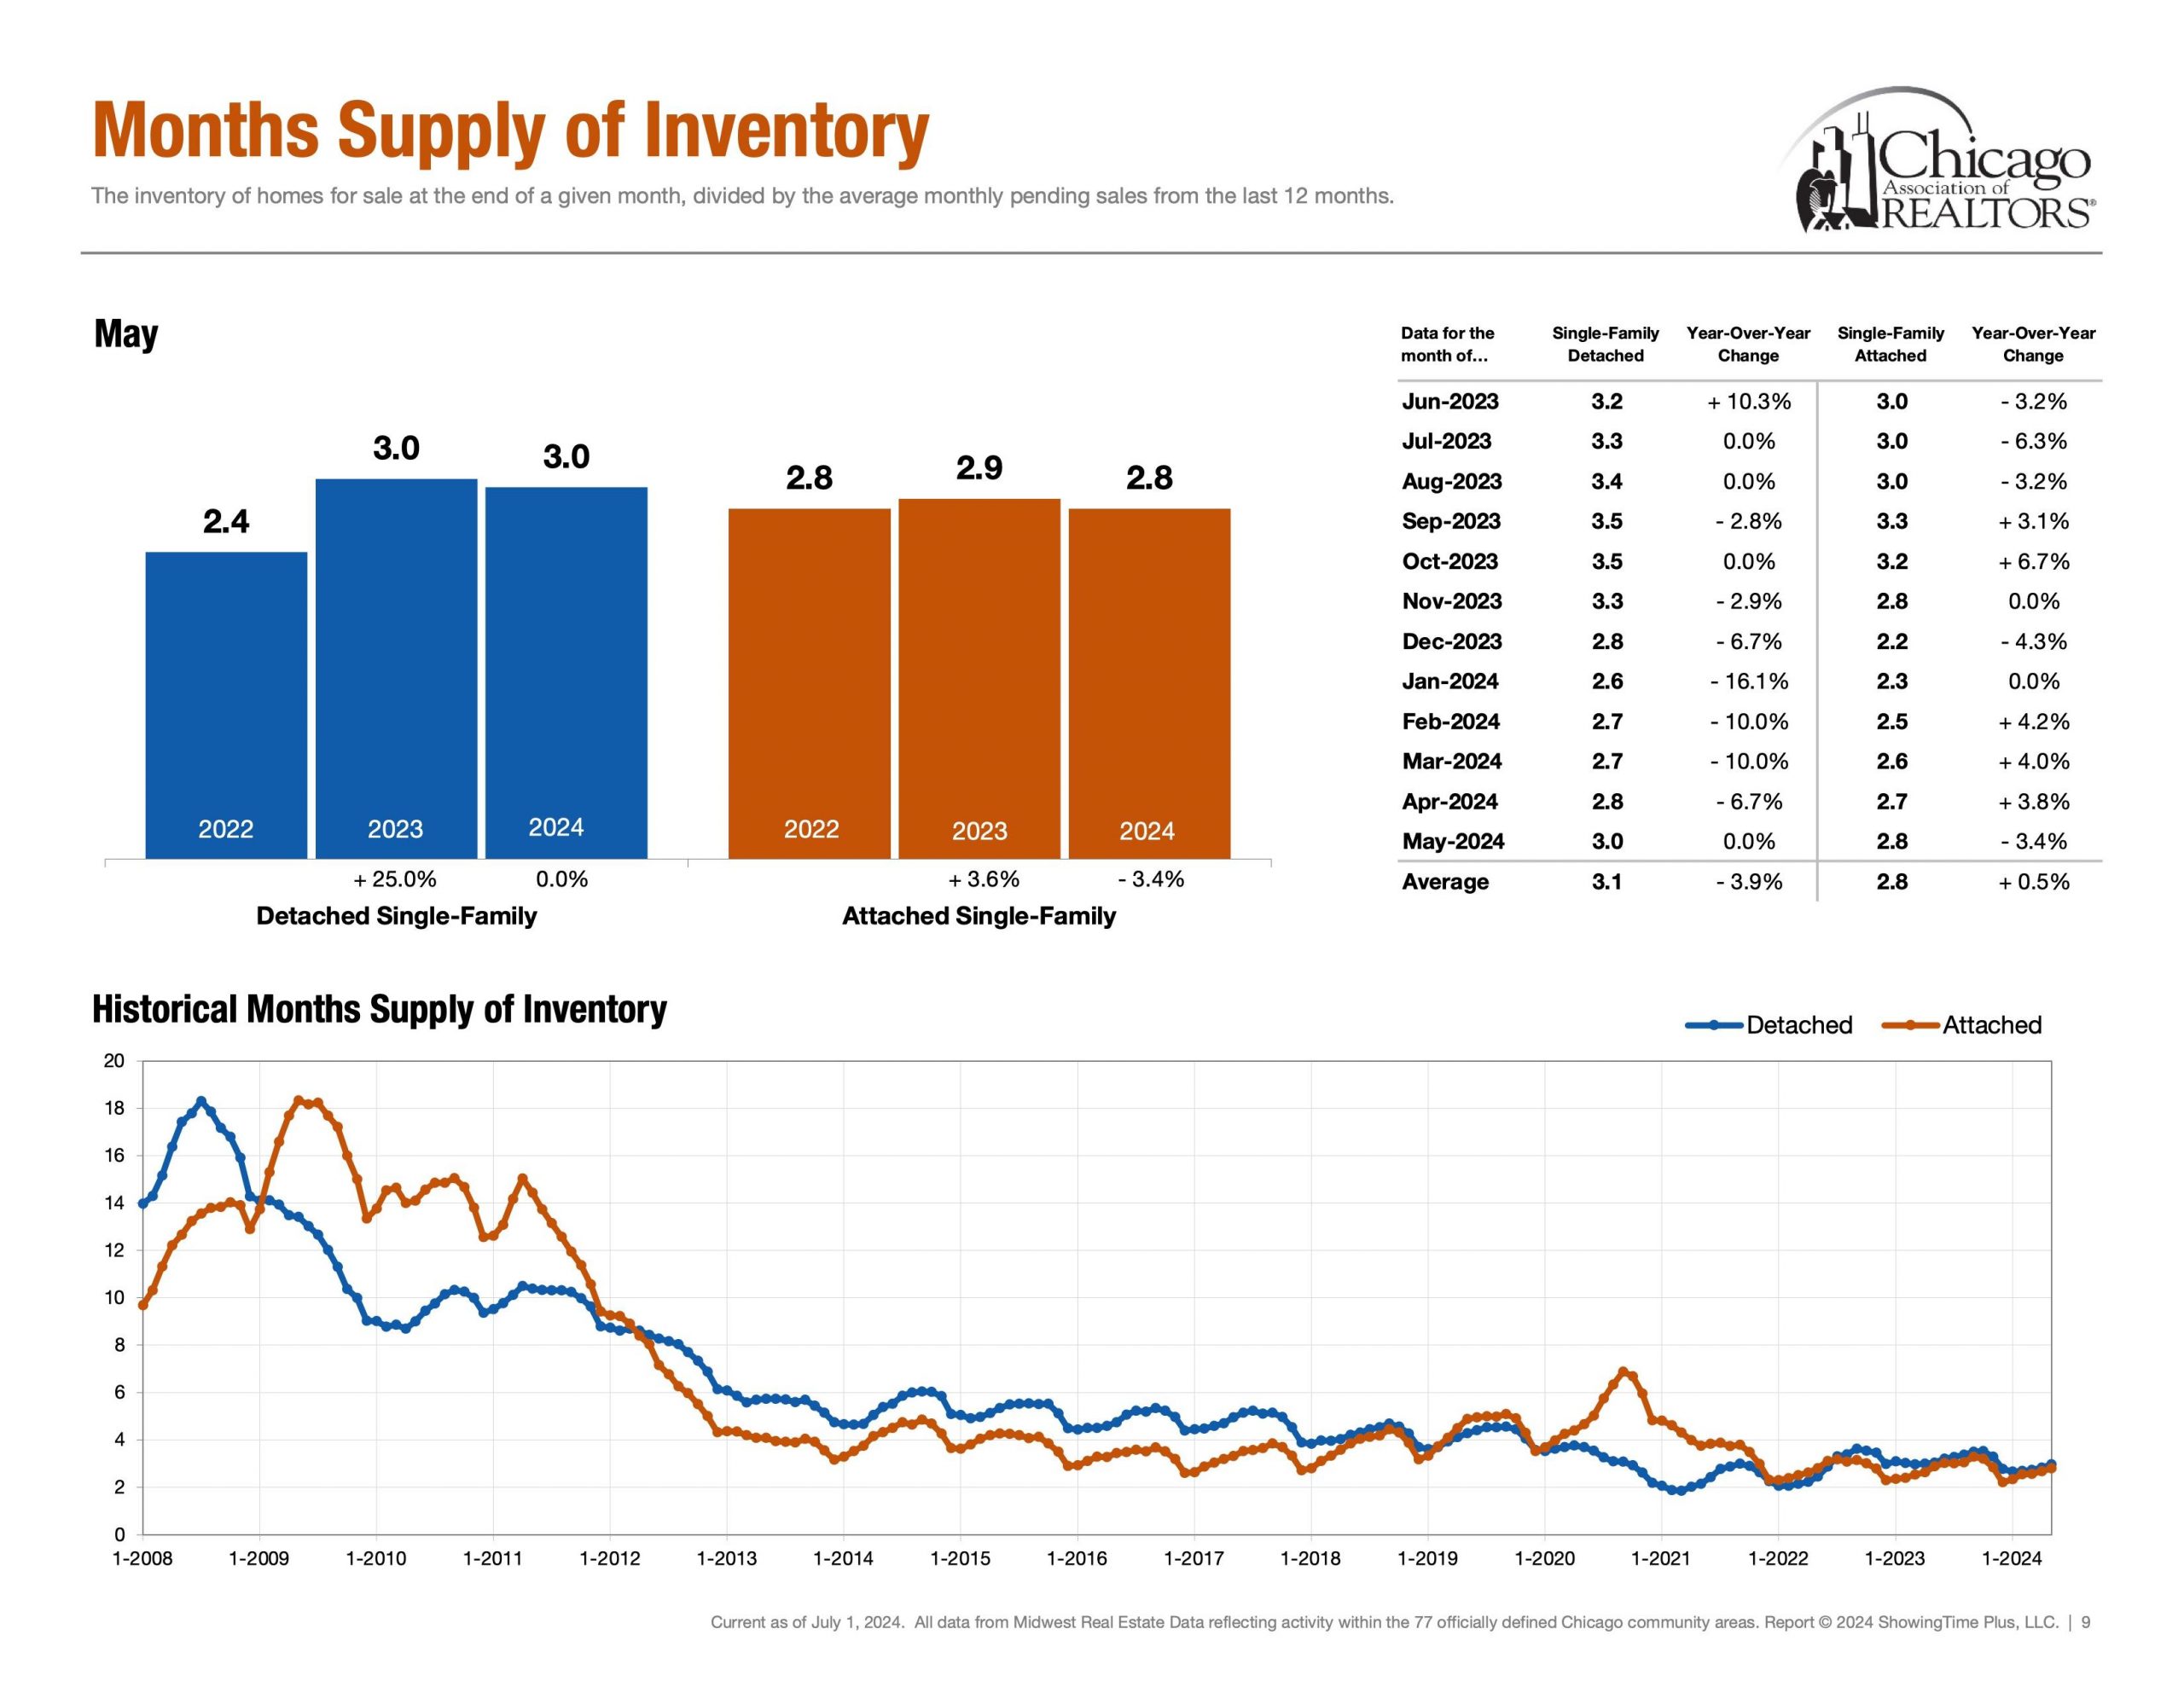
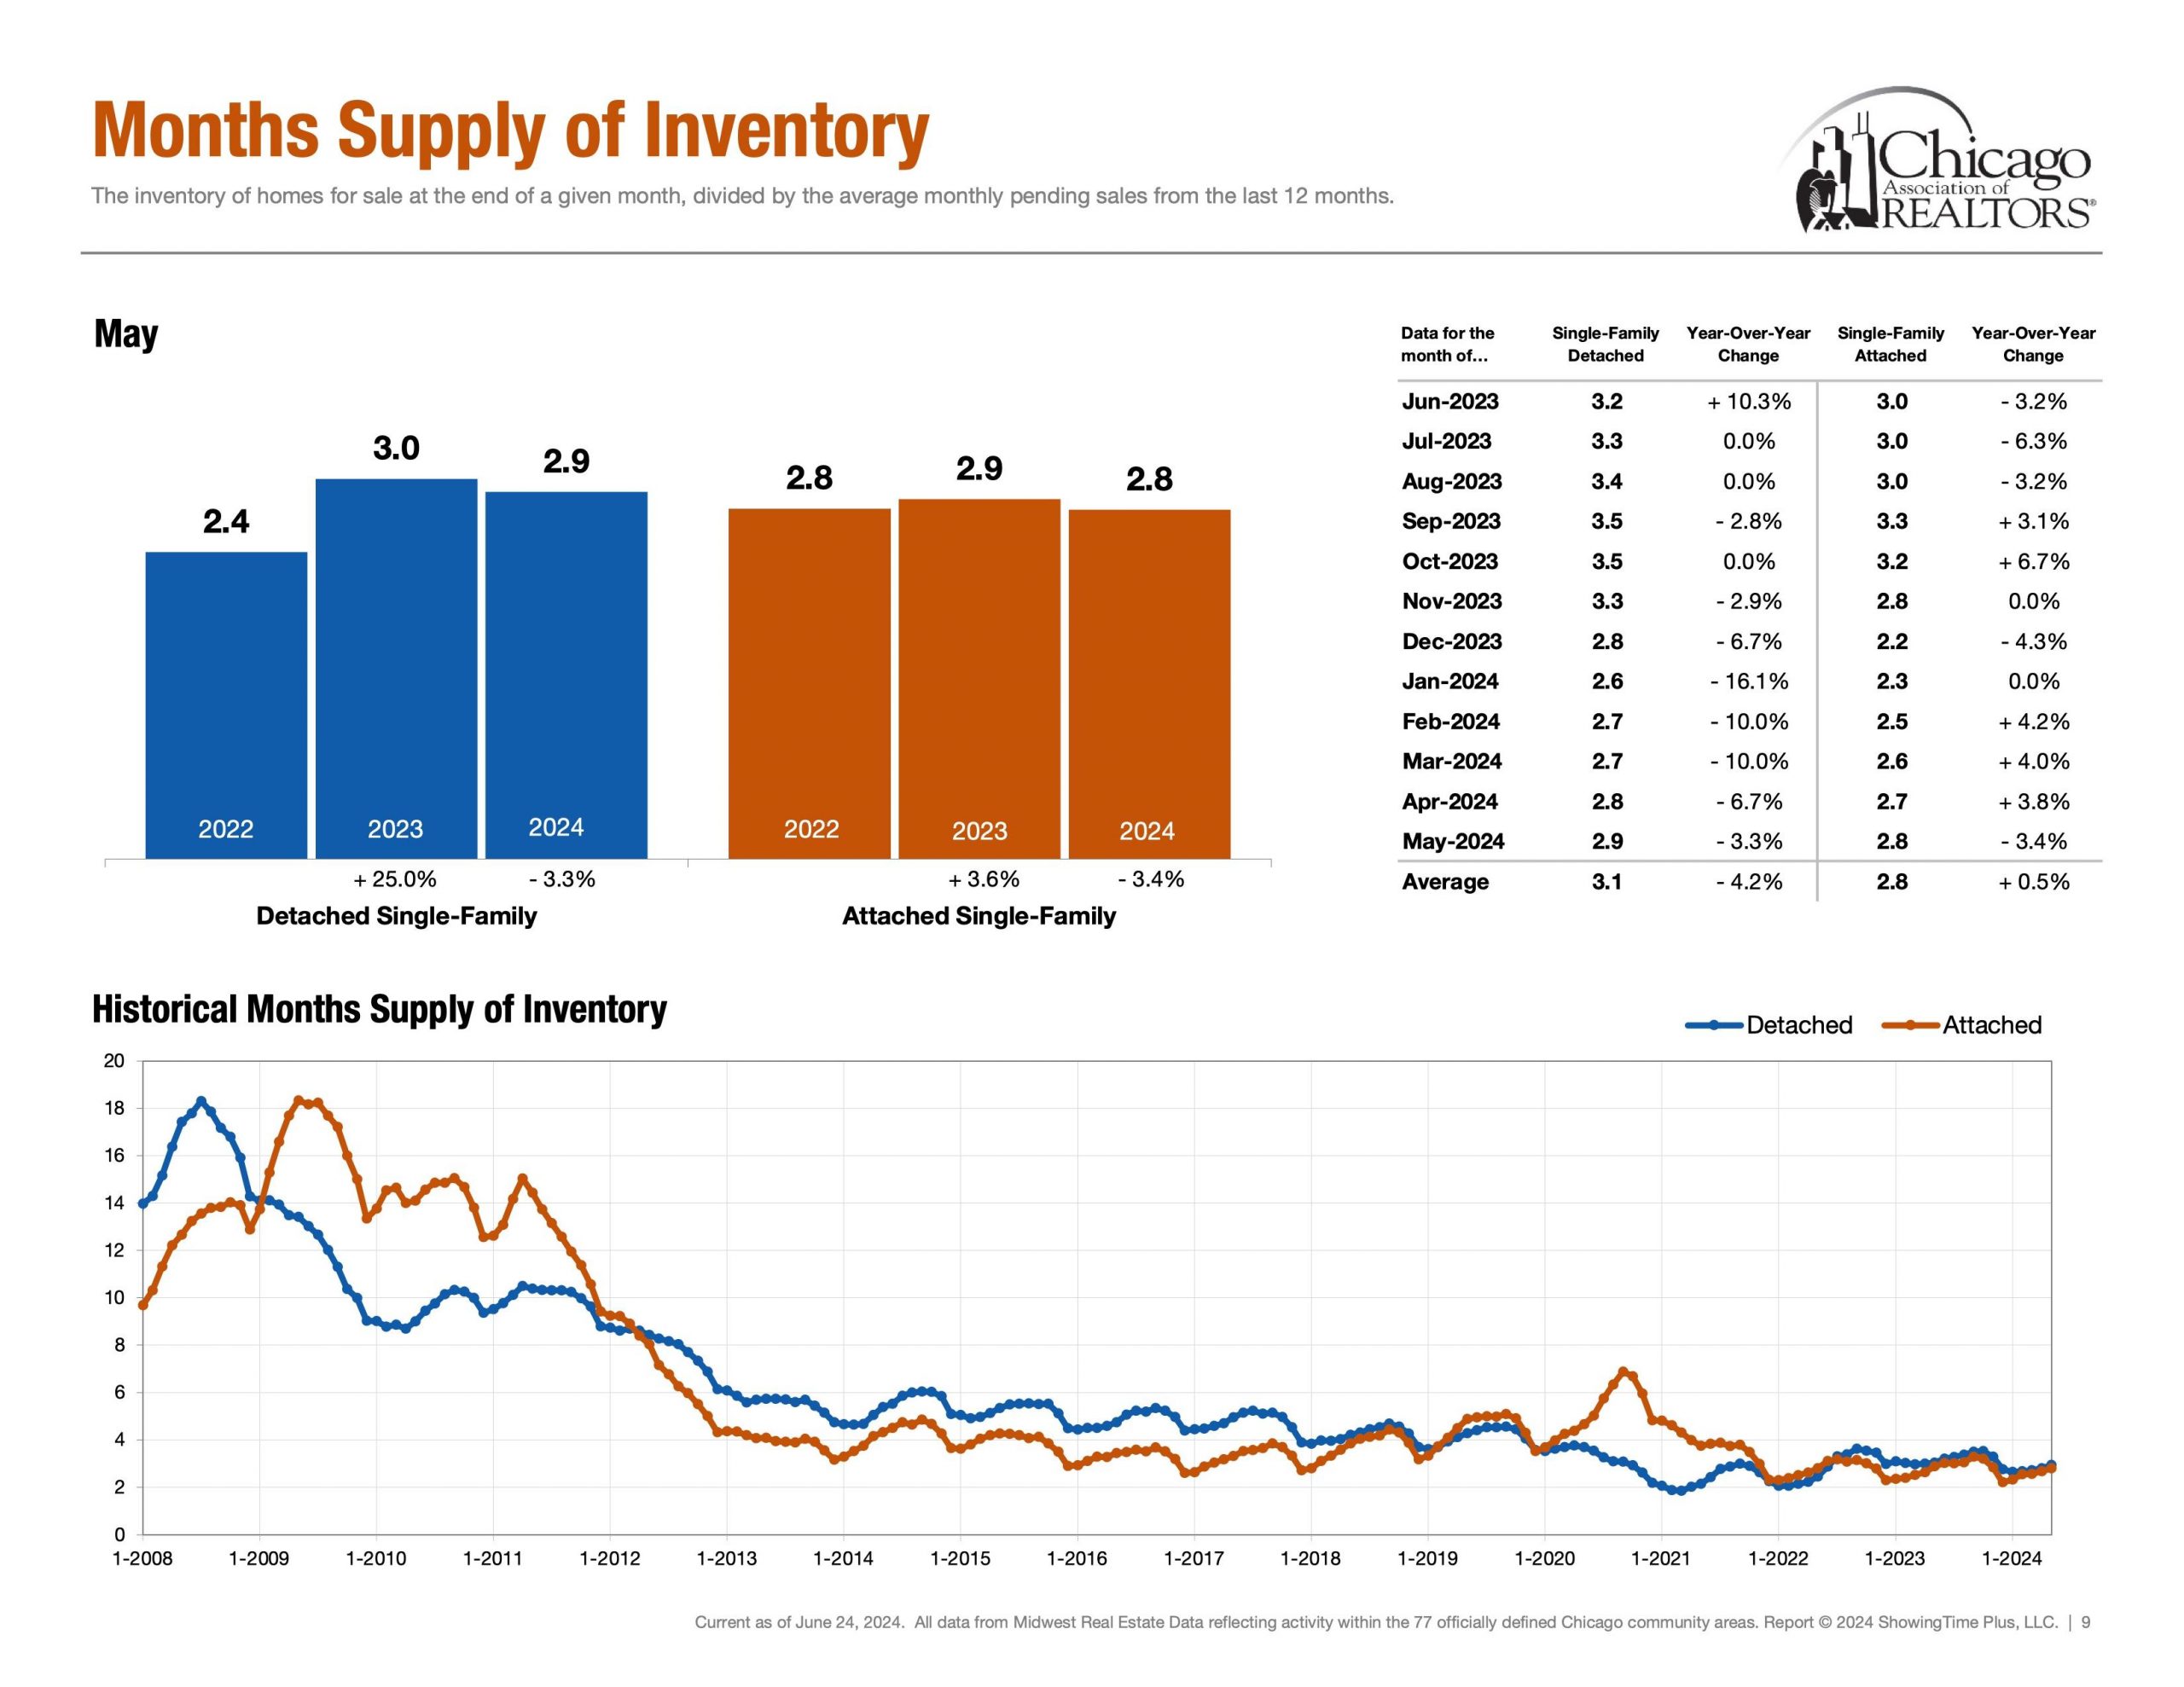
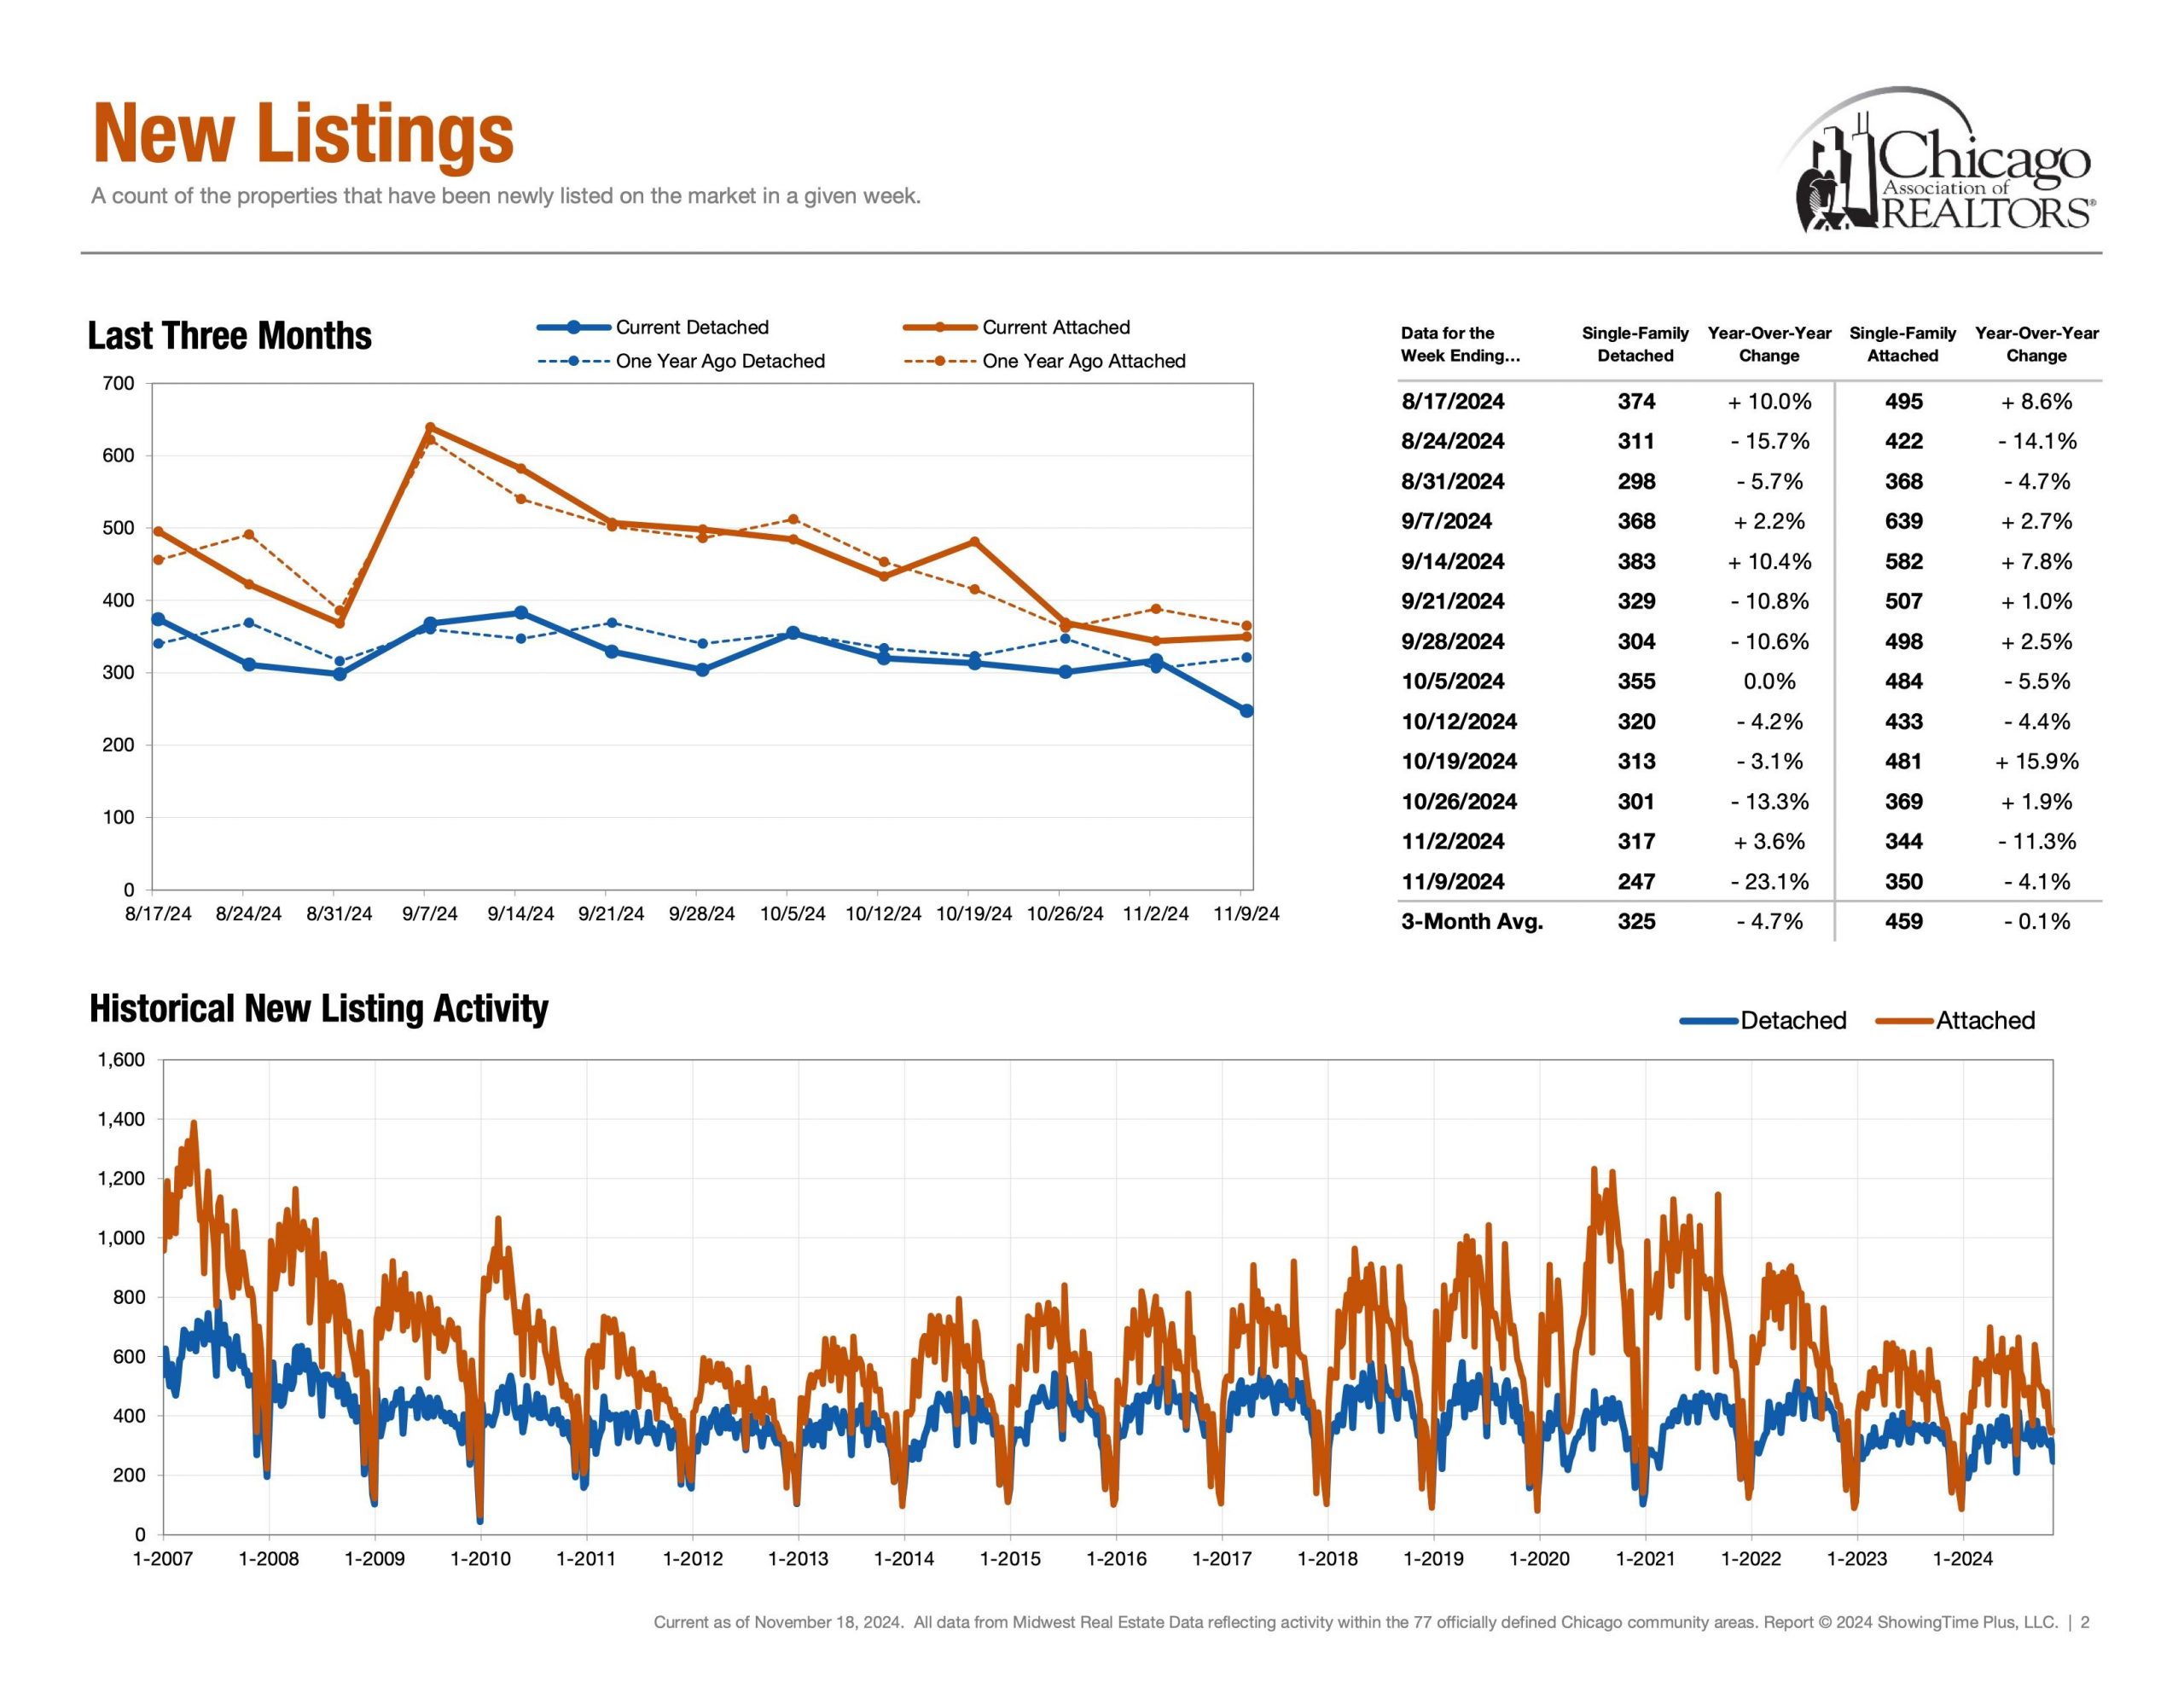
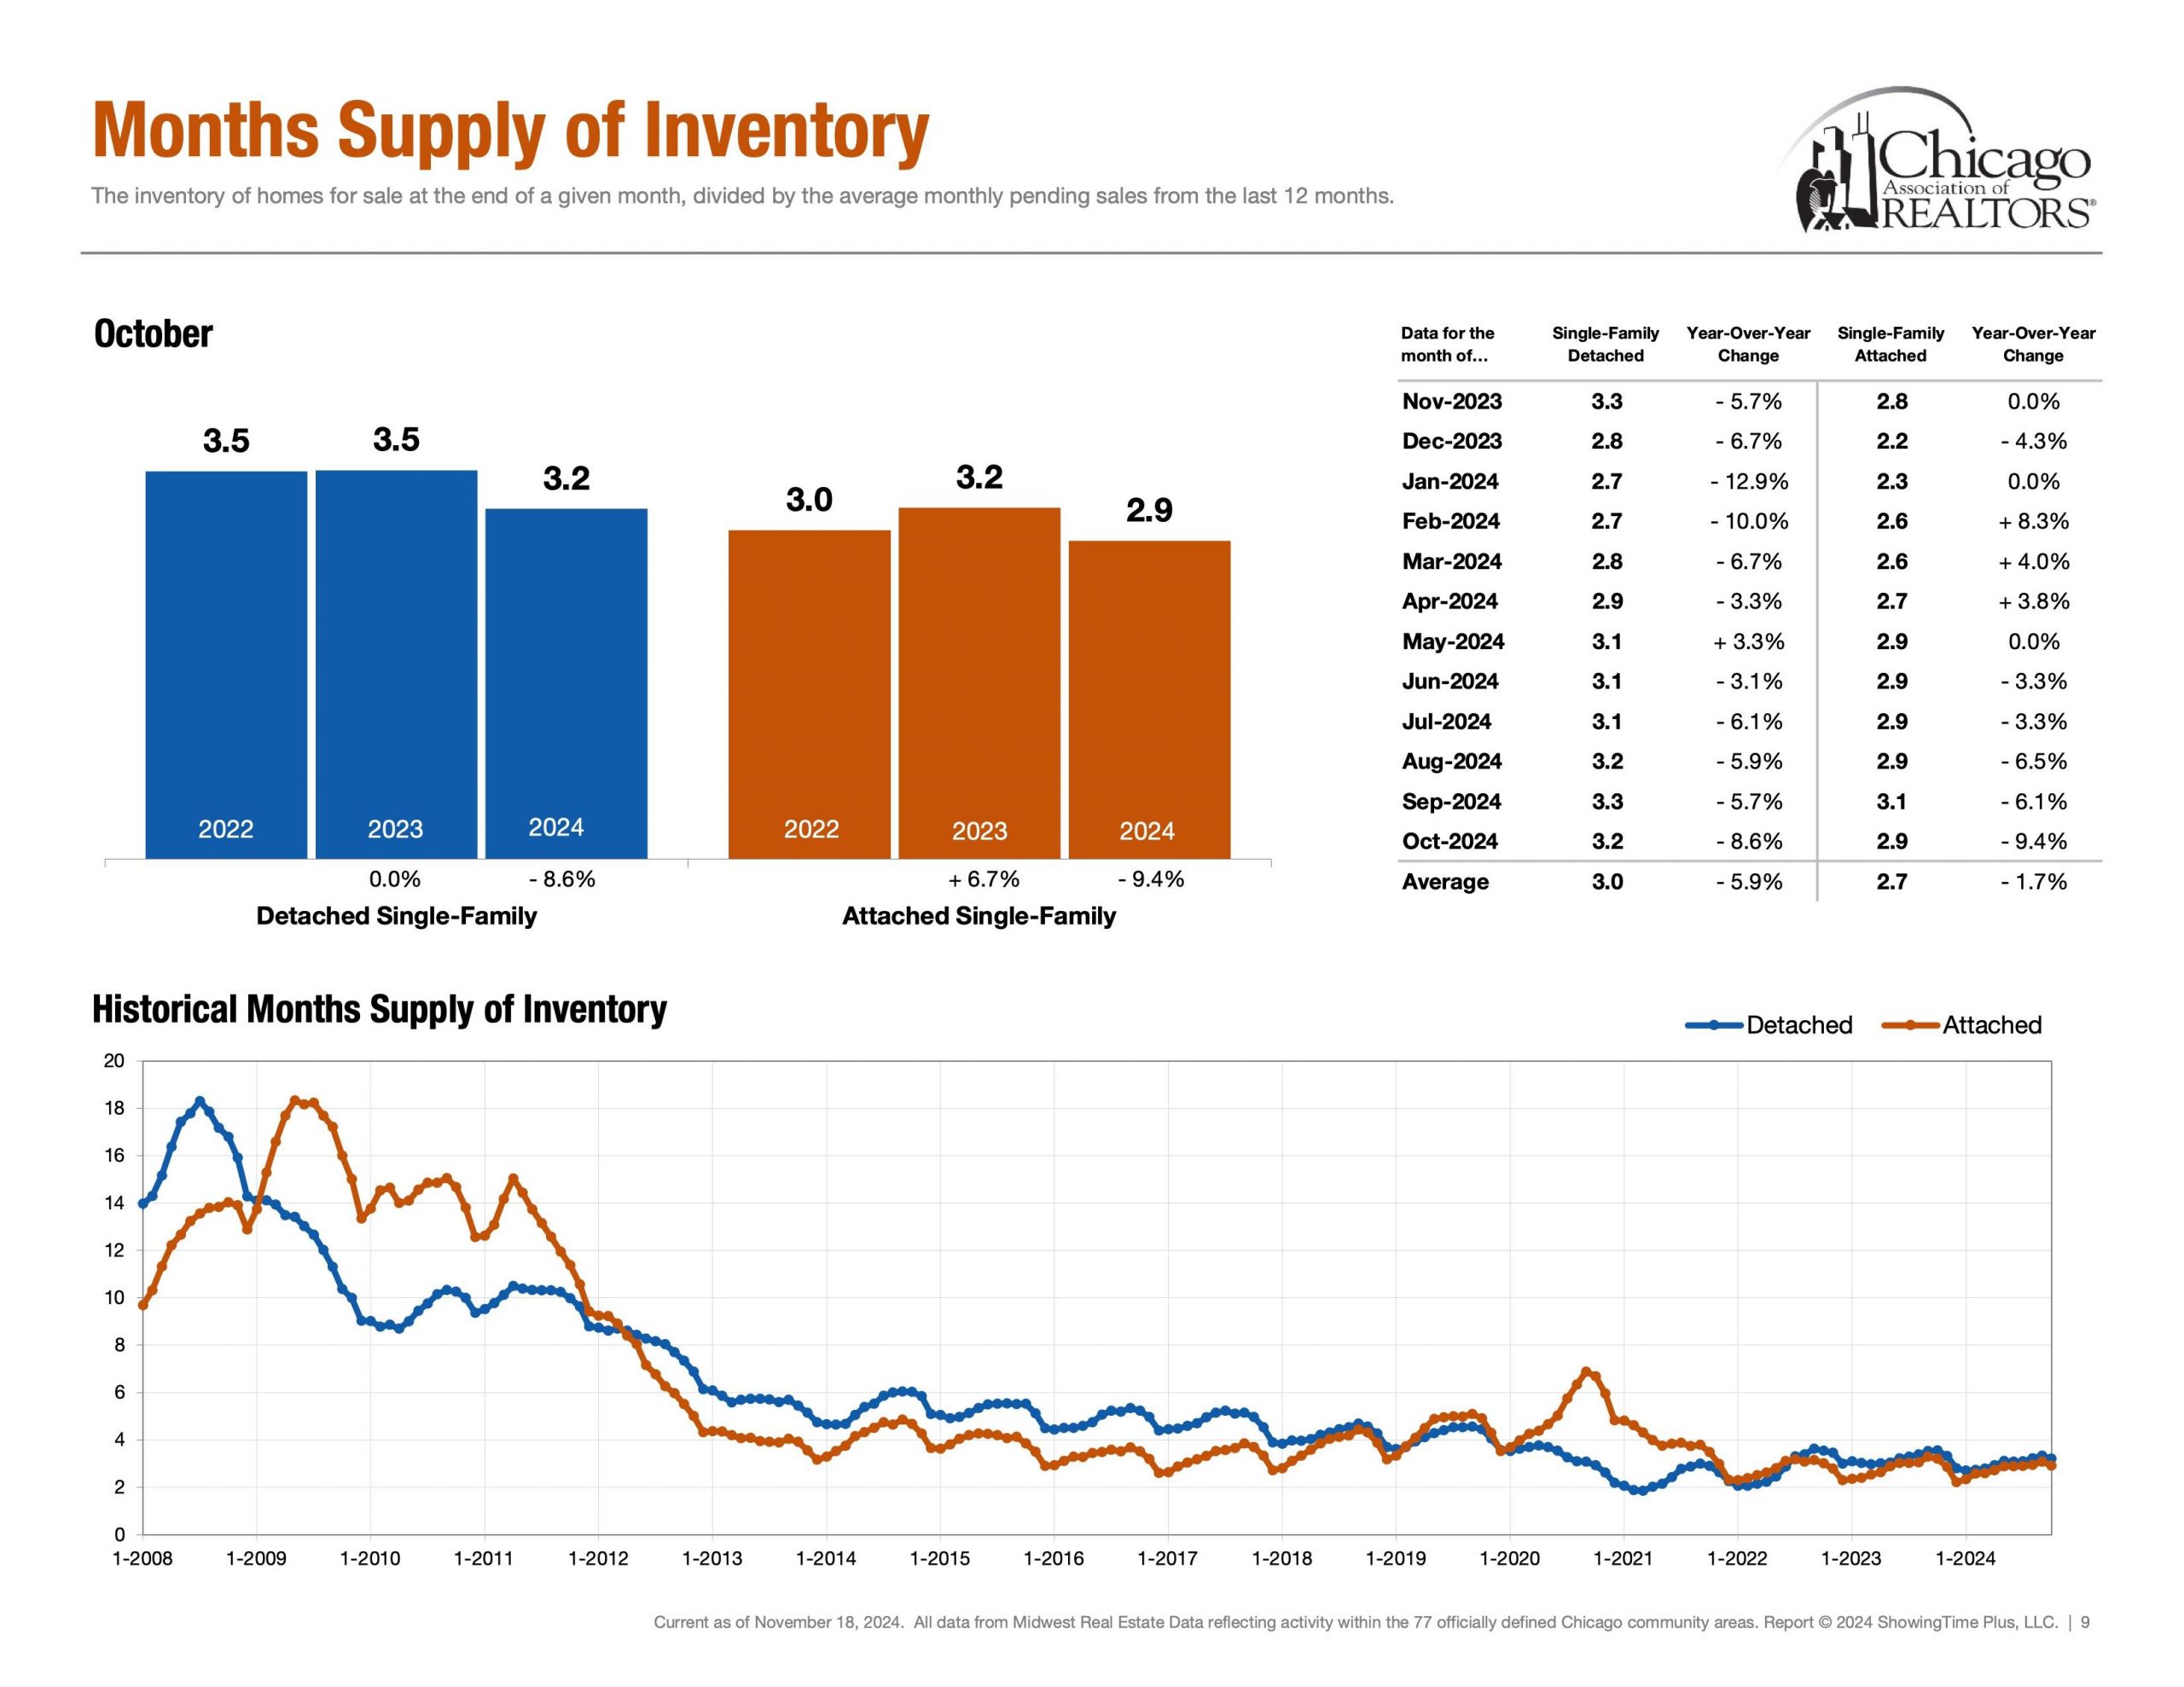
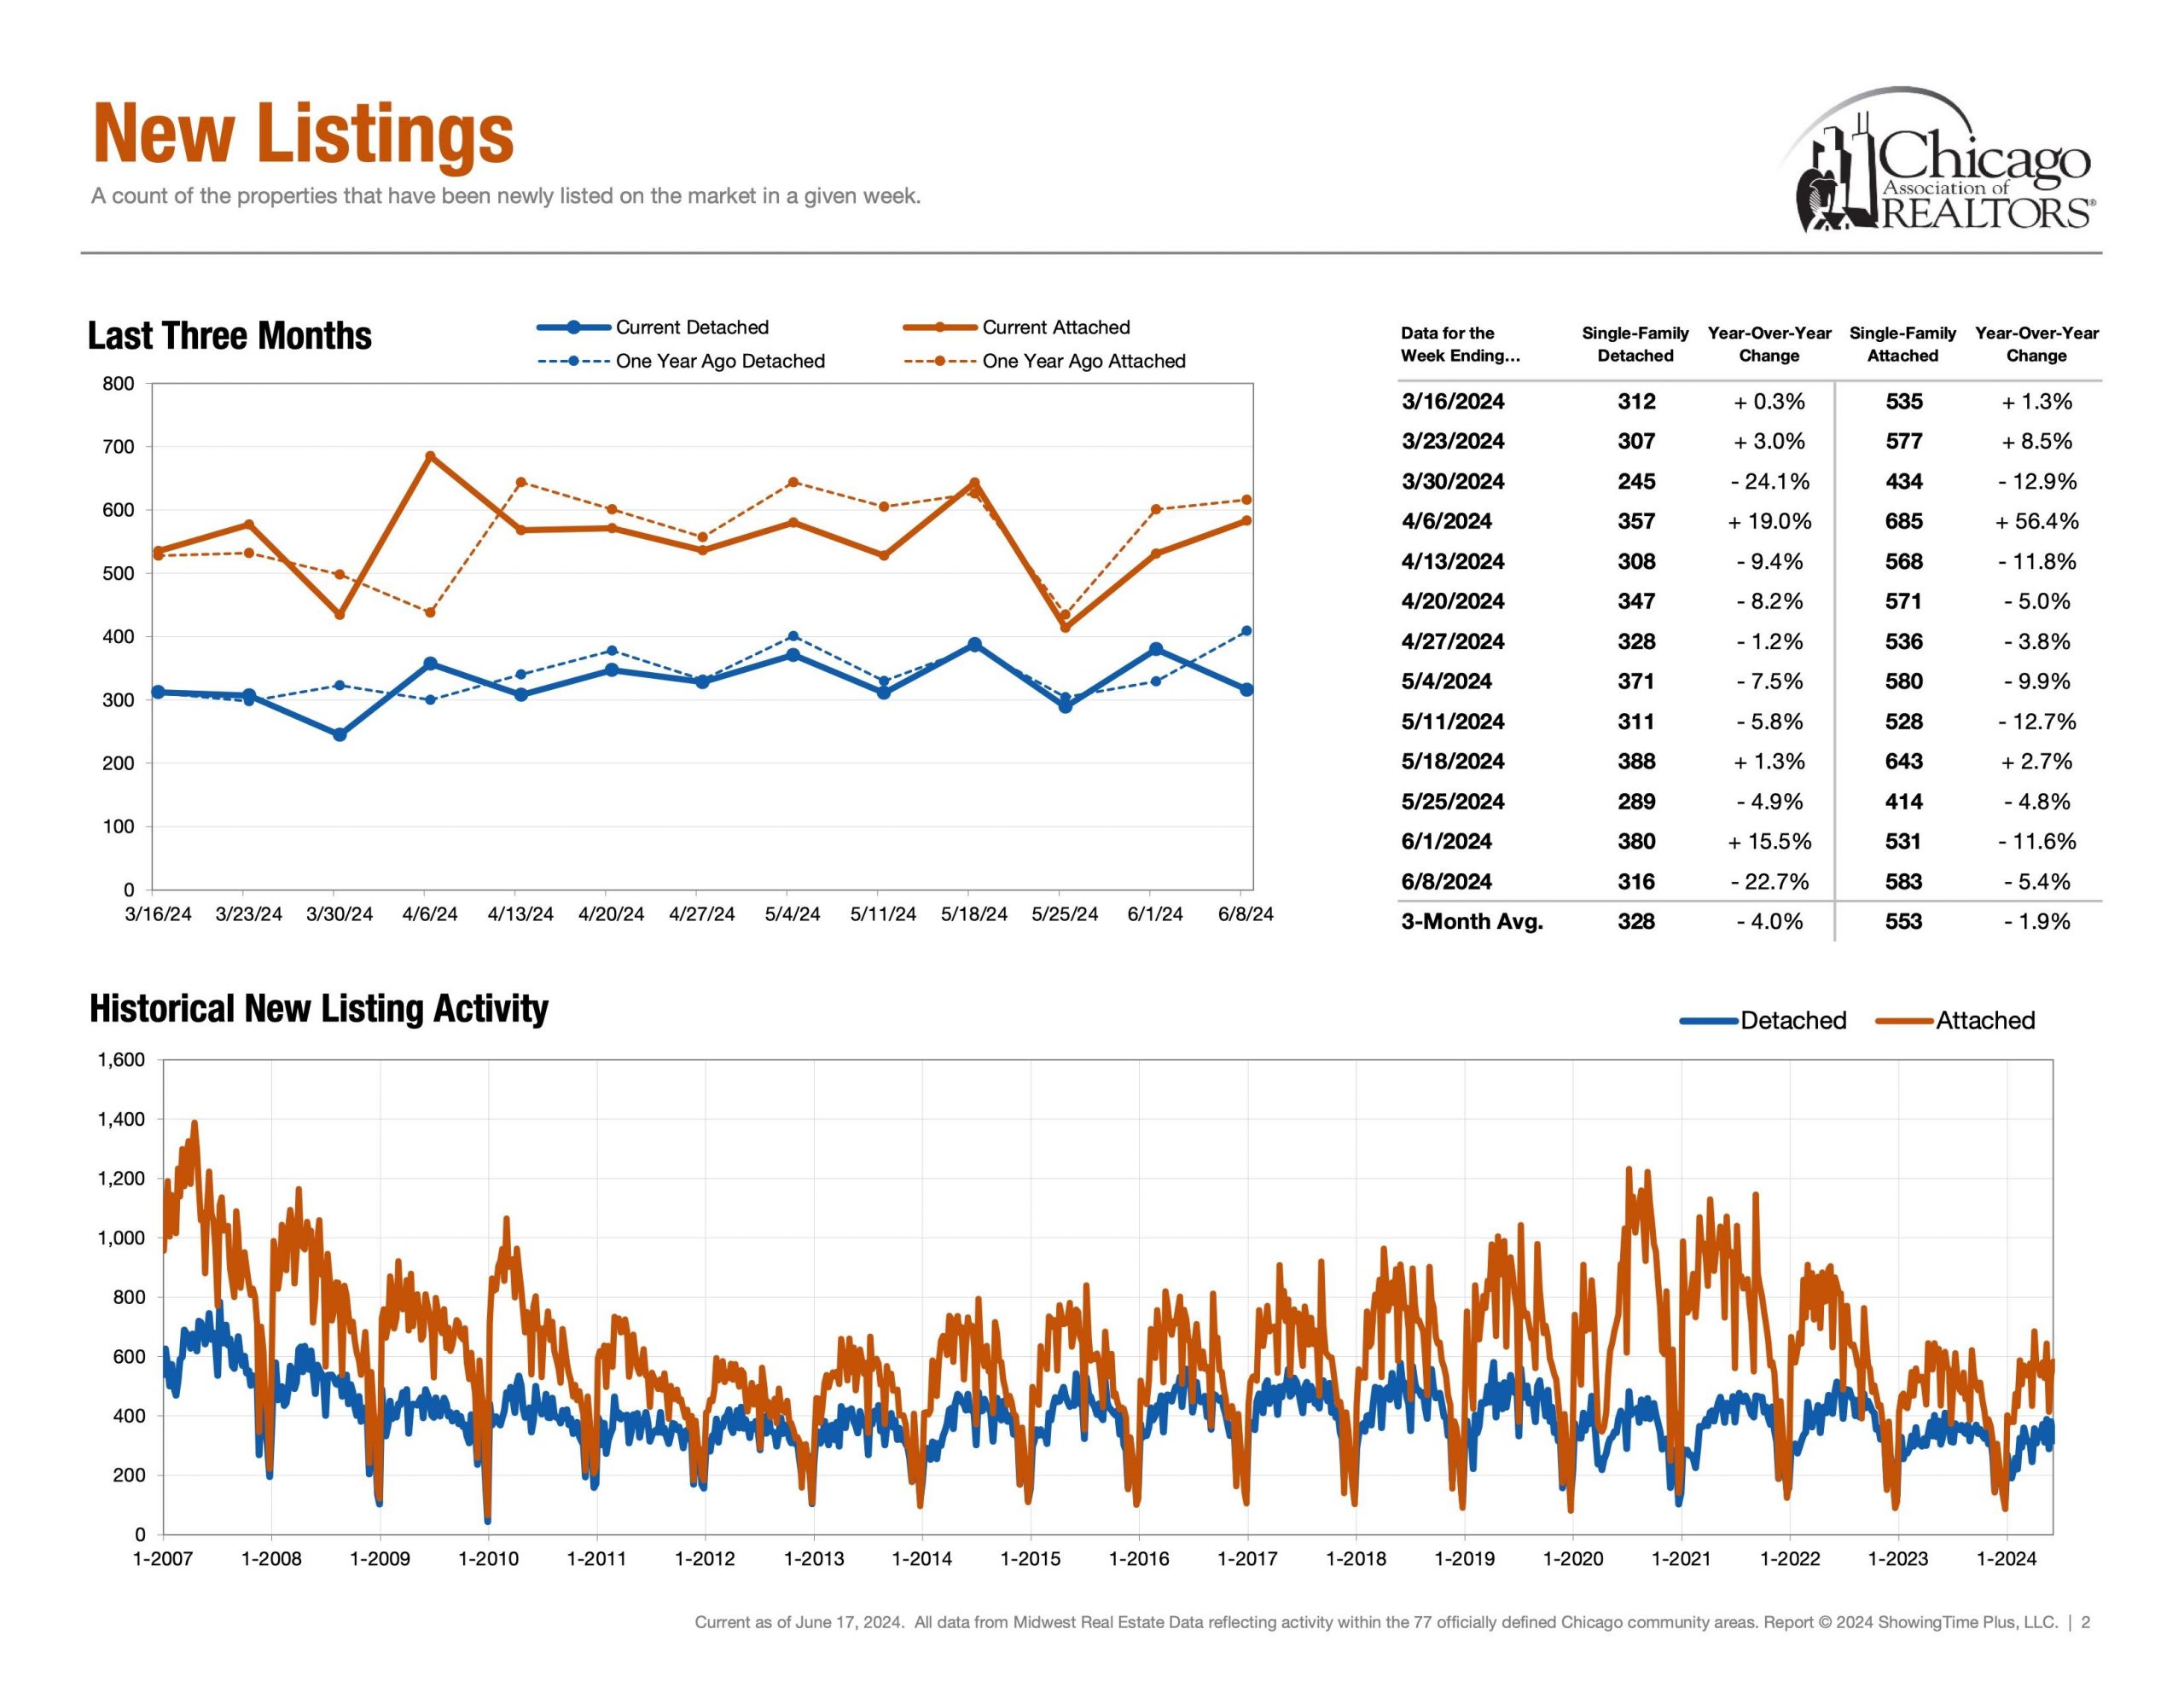
Next, supply showcases how much inventory is available for buyers and how much competition sellers are up against. Additionally, Months of Inventory, Homes for Sale, New Listings and Absorption Rate are also other key metrics in the conversation of supply.


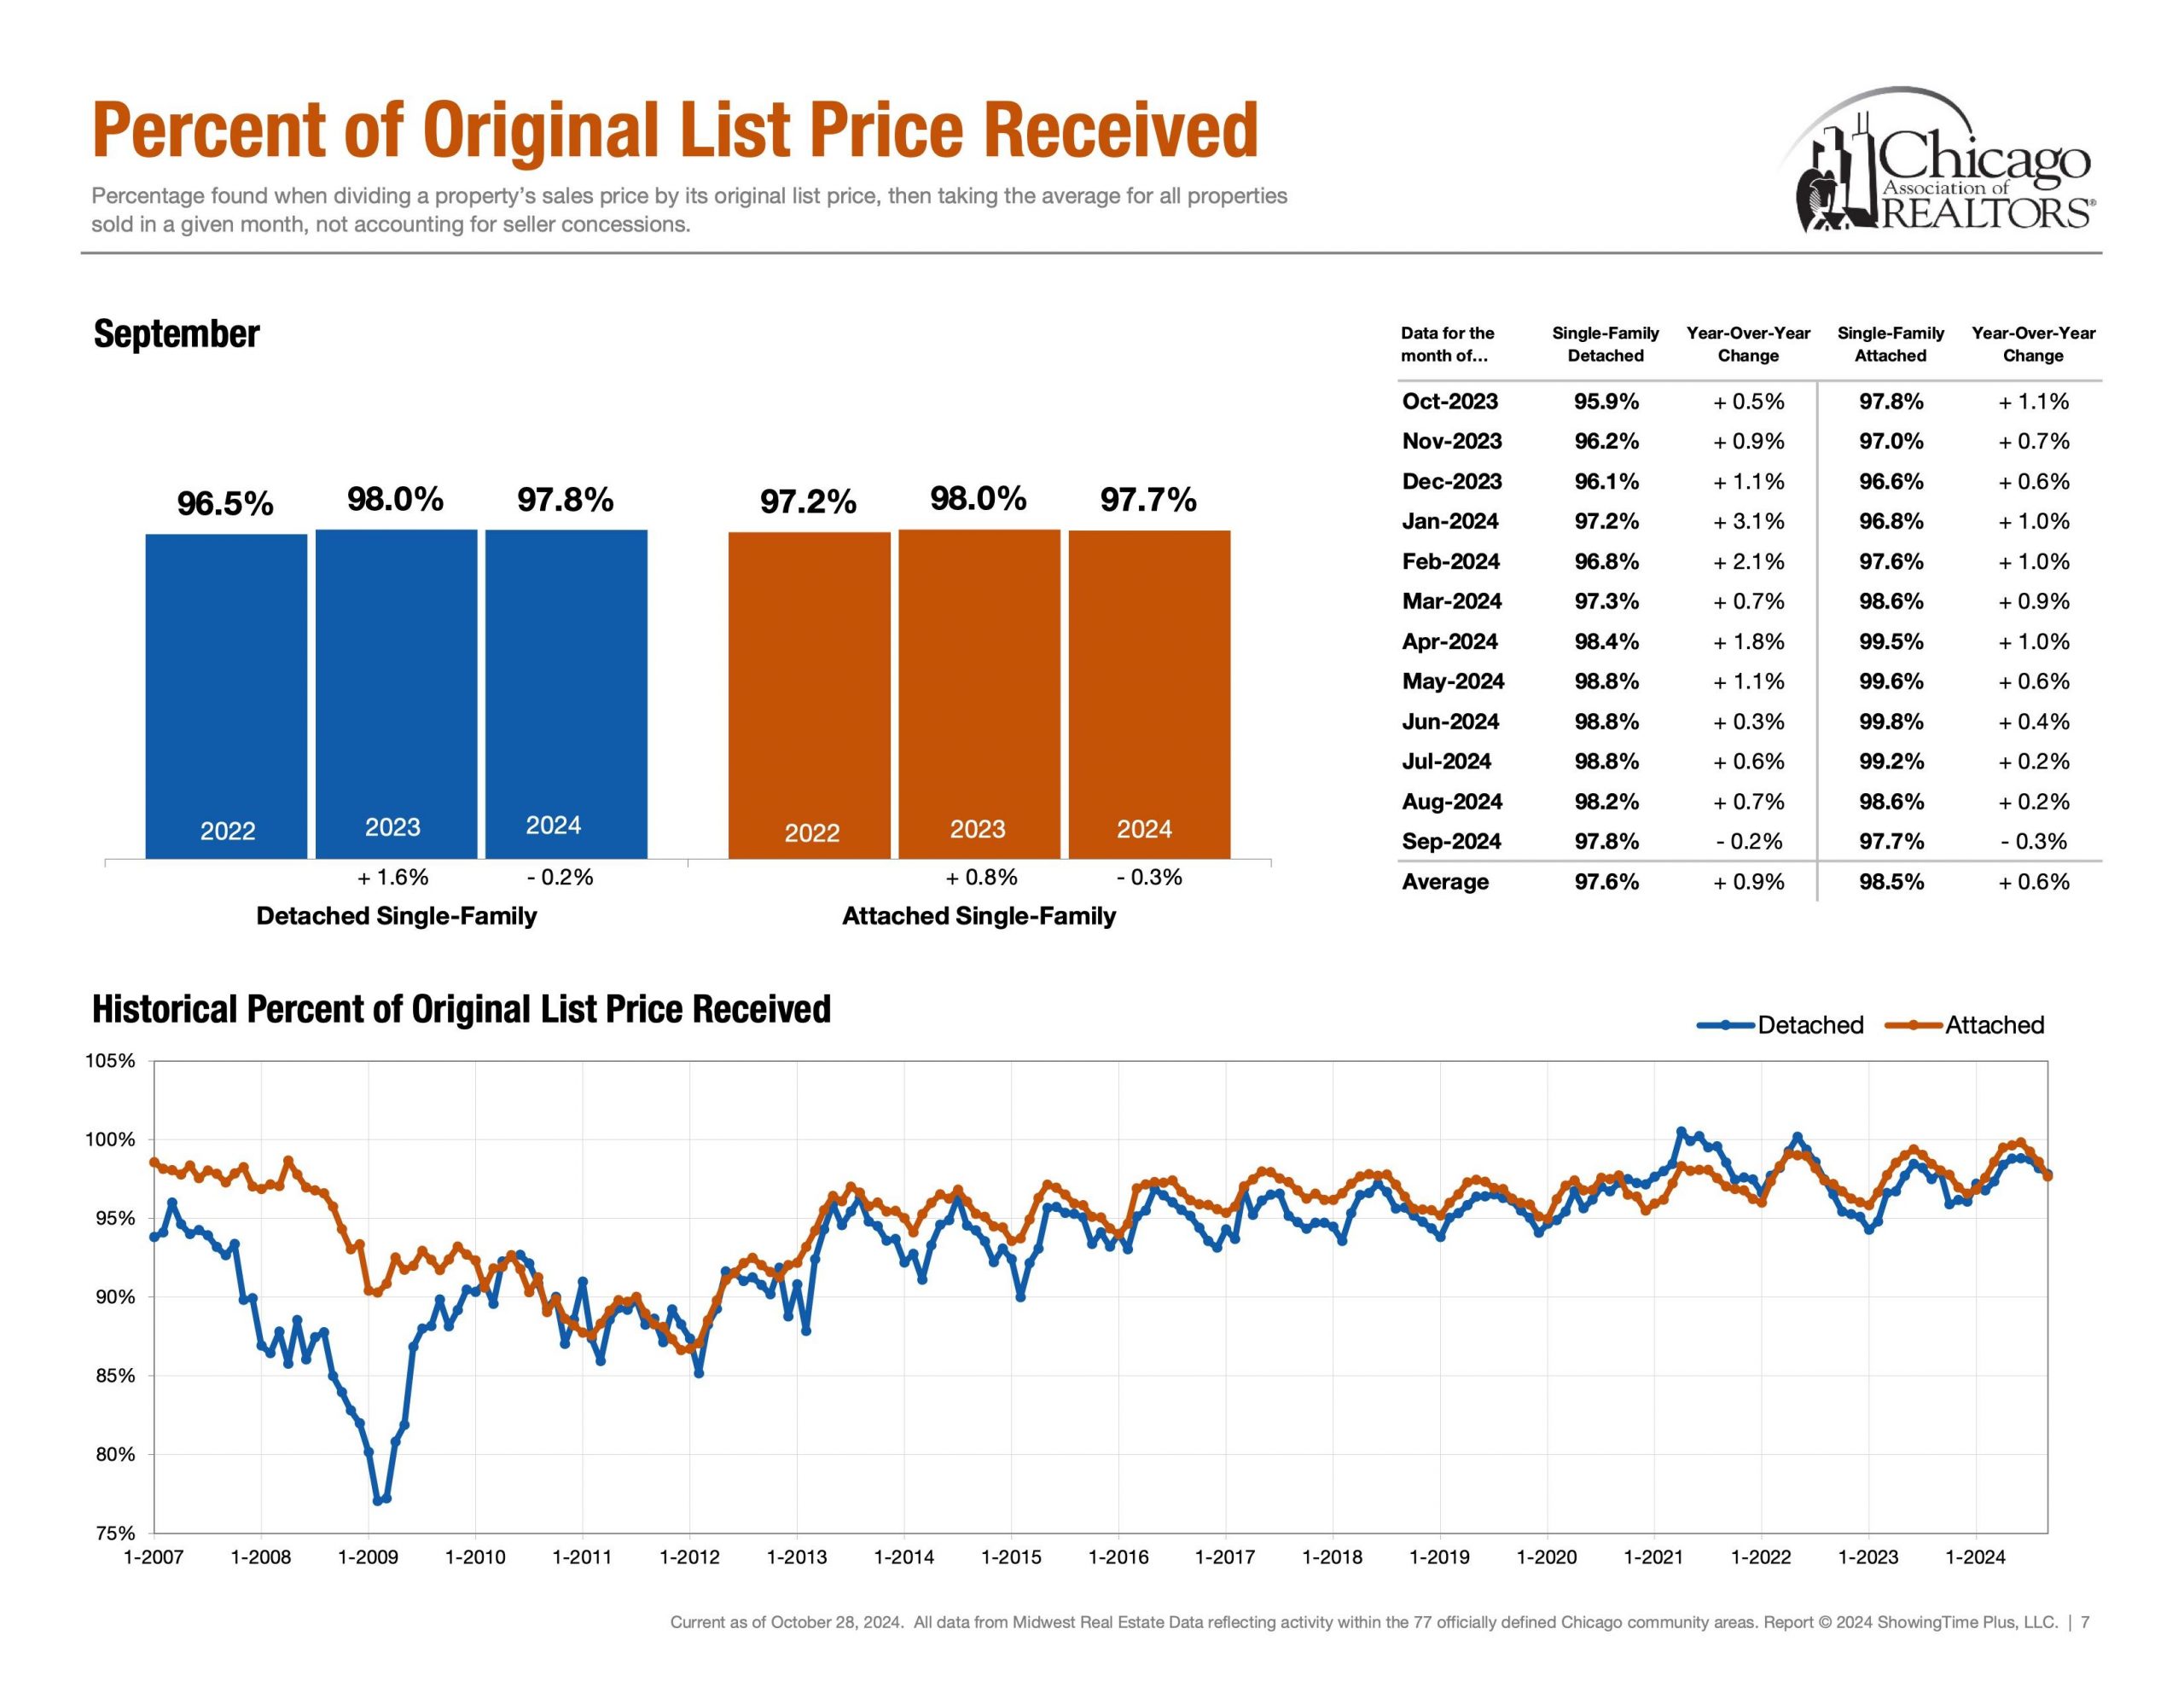
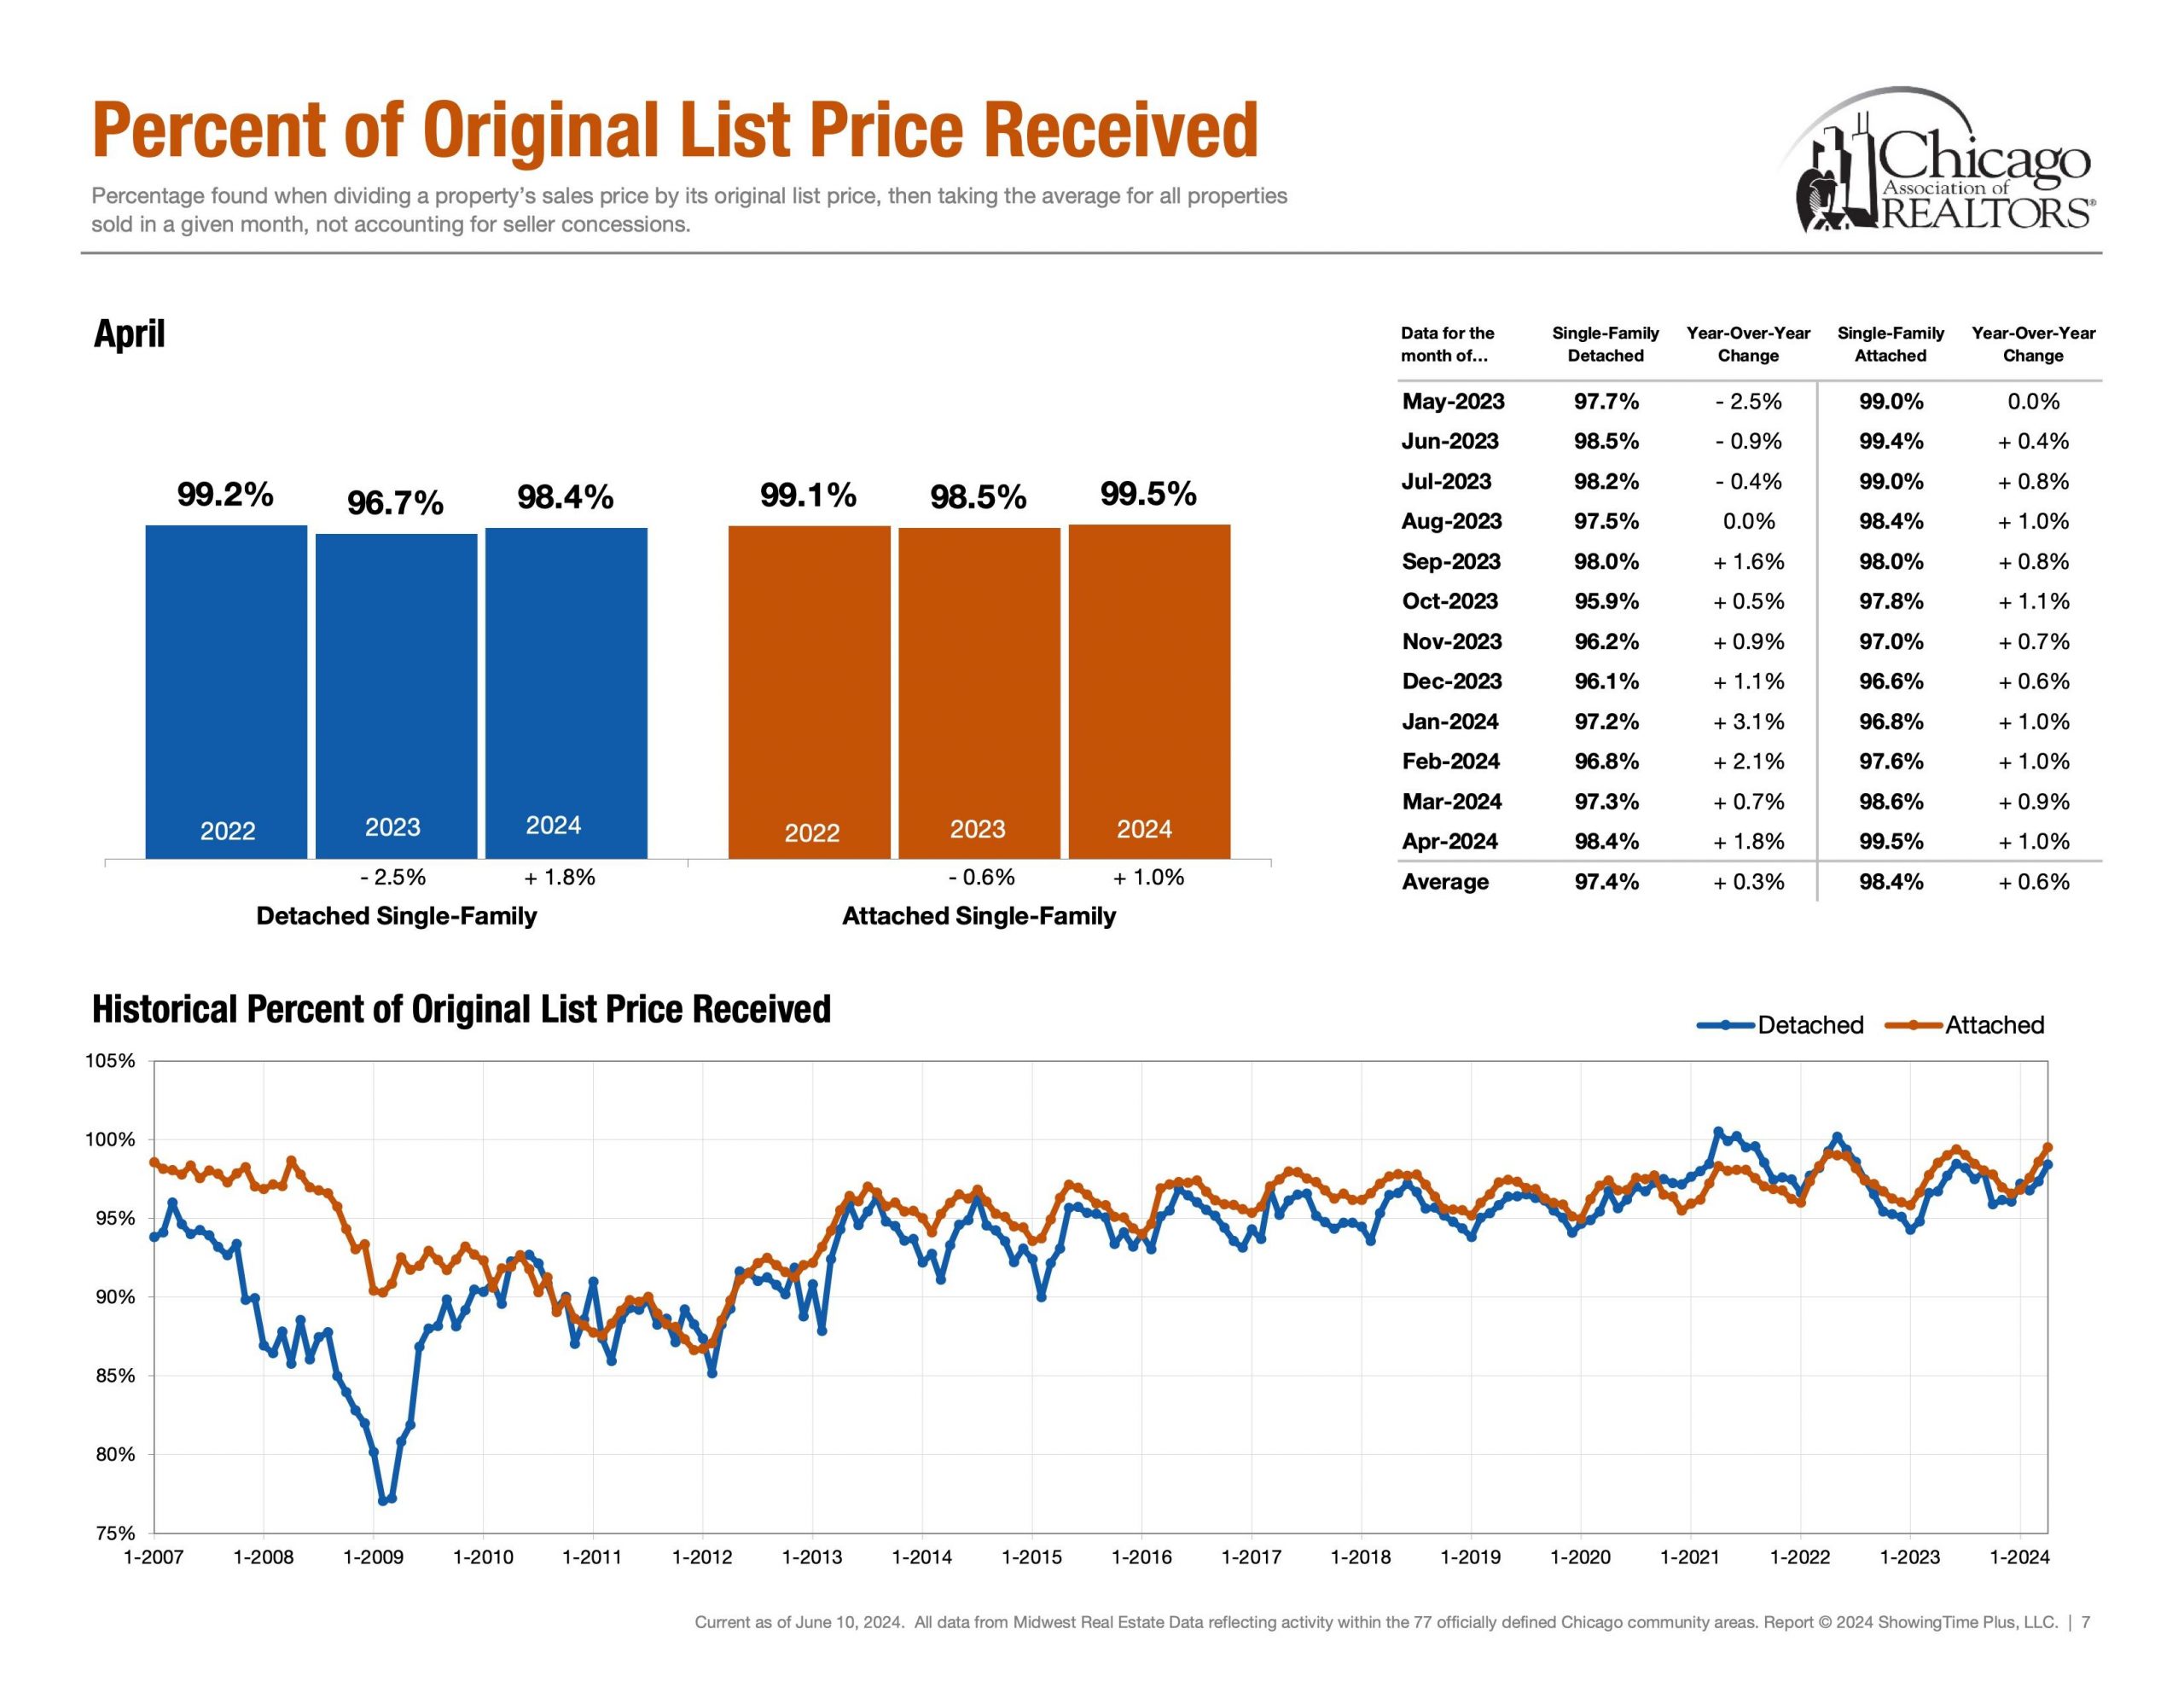
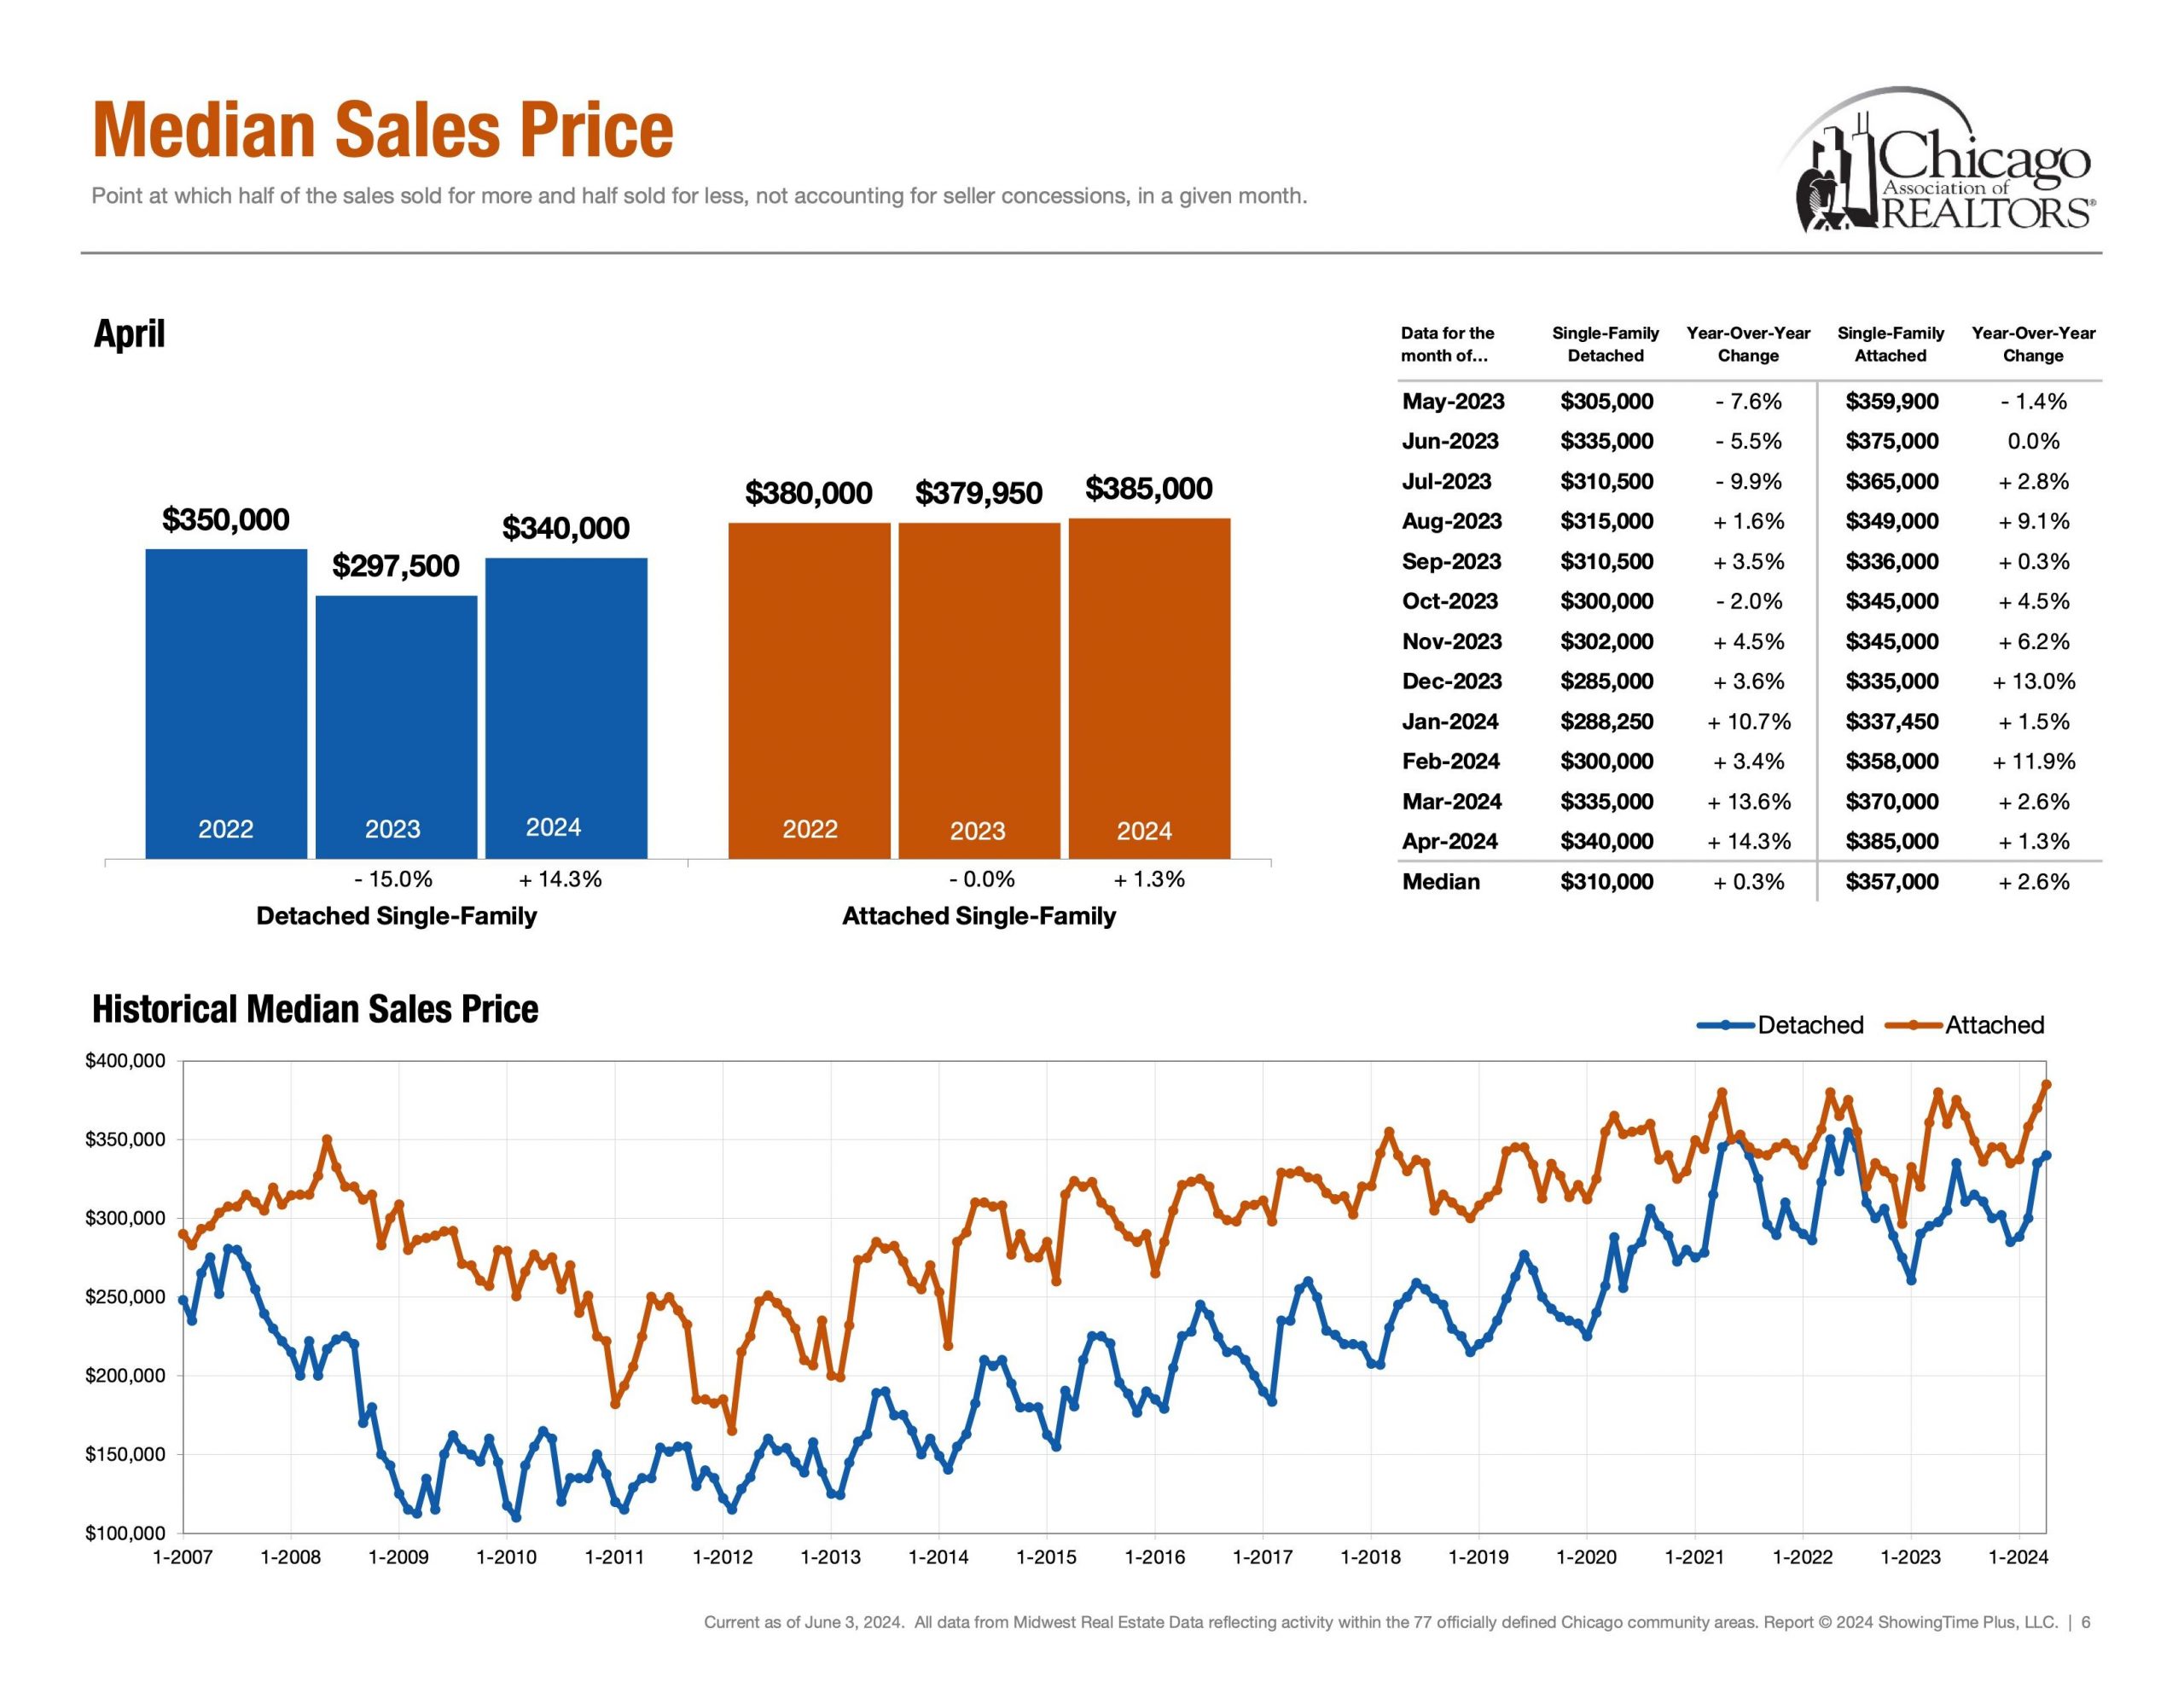
Negotiations | Percentage of Original List Price Received


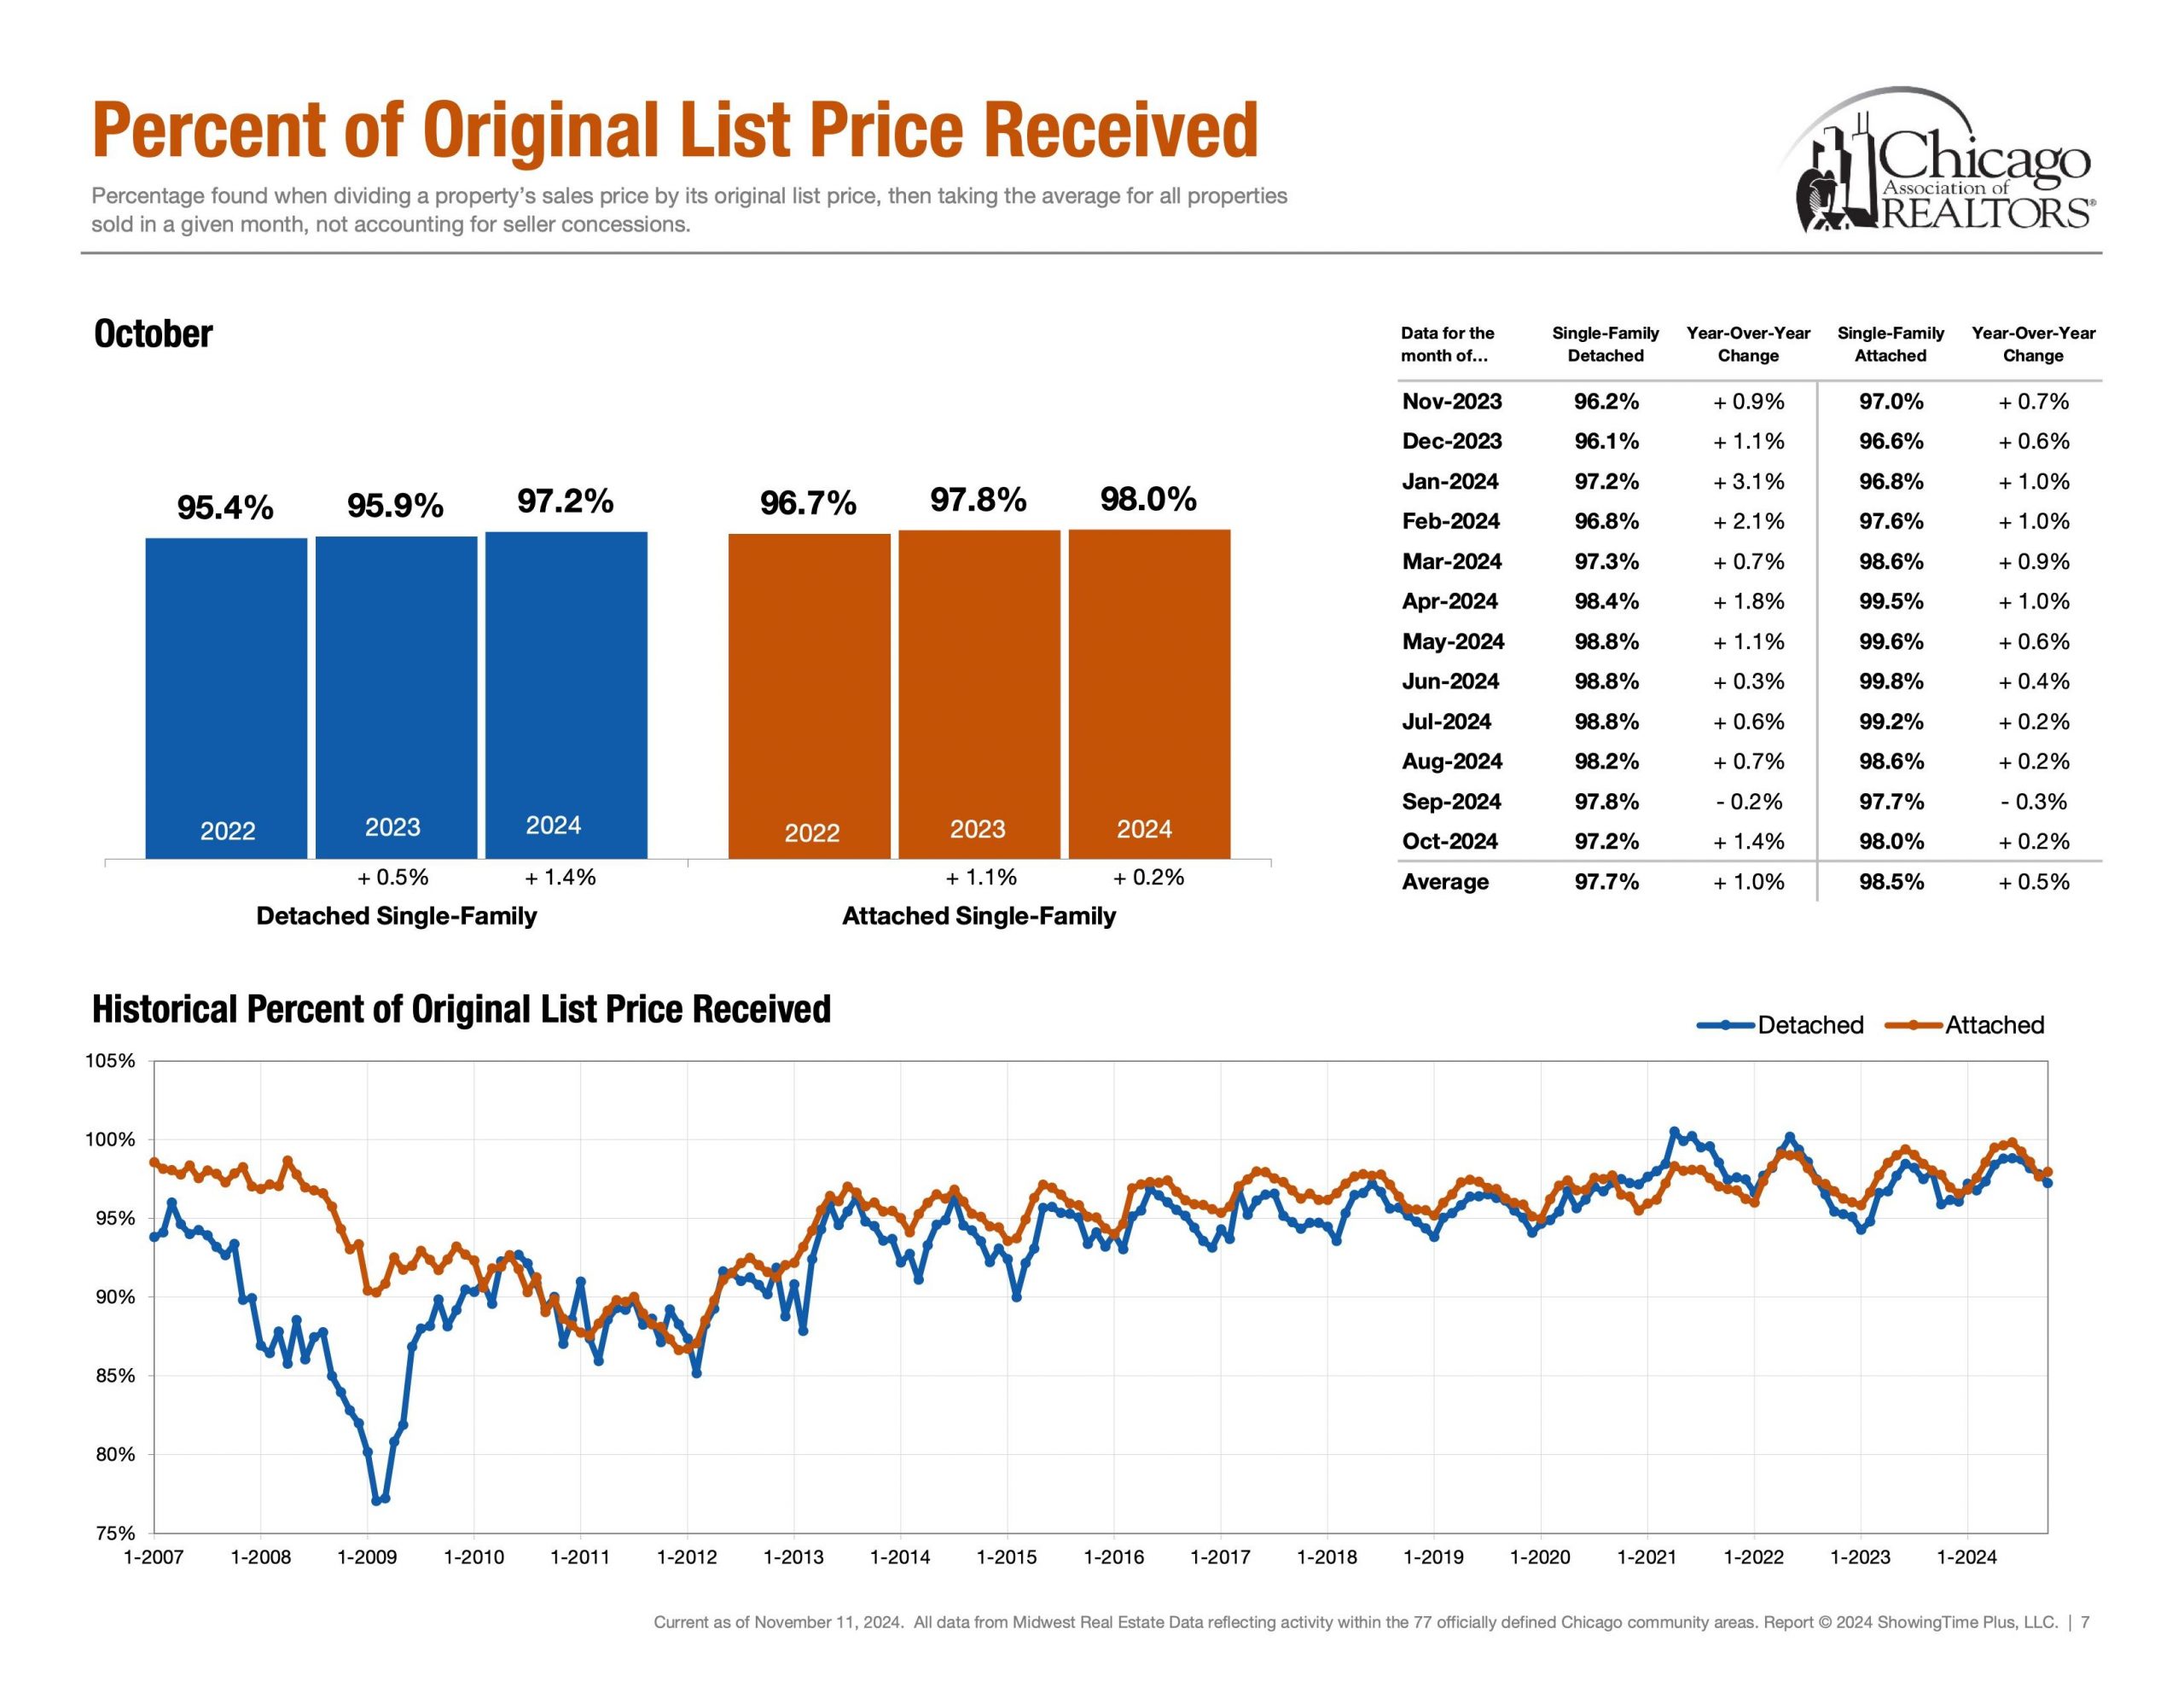
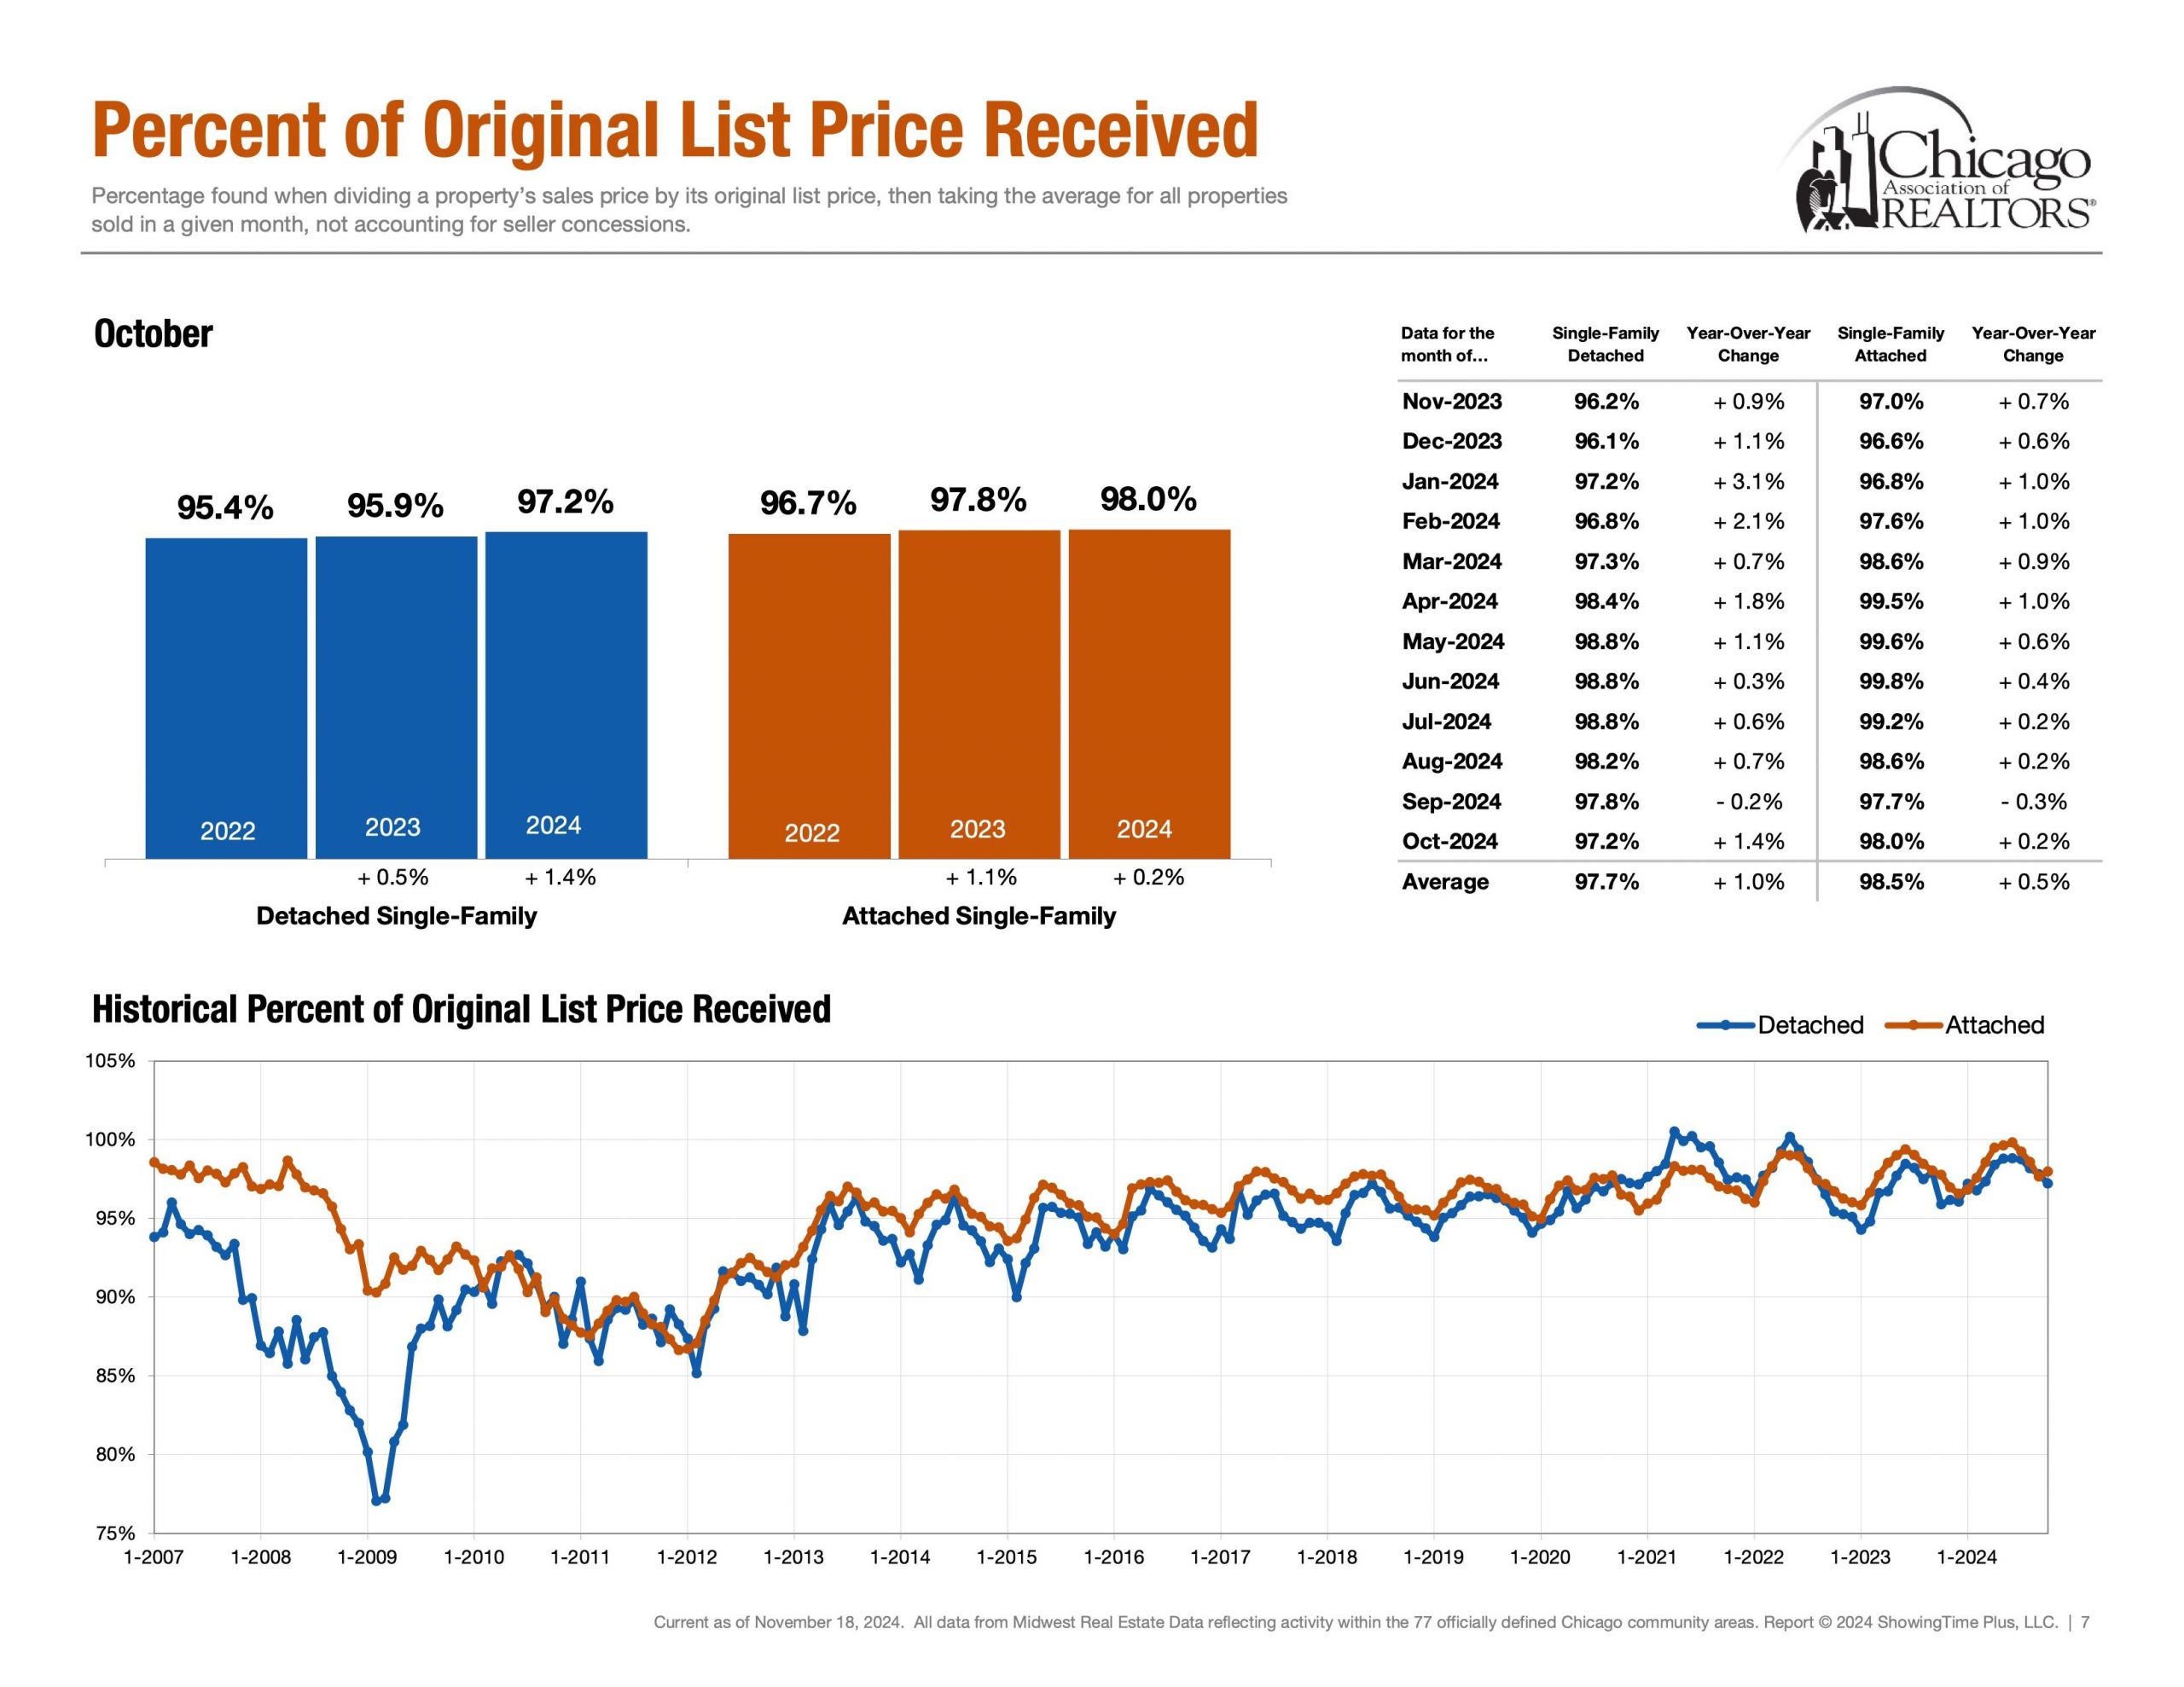
Detached Single ~ 97.7% (Rolling 12 Months Avg) & ~ 97.2% (Oct 24′)

Attached Single ~ 98.5% (Rolling 12 Months Avg) & ~ 98.0% (Oct 24′)

Lastly, Percentage of Original List Price Received to Closed Price is a metric that showcases what the average accepted purchase price is relative to the list price. How much below asking price can an offer go while still getting accepted? How much would one have to offer above ask in order to be an above average purchase price?


The End | Have A Great Day!

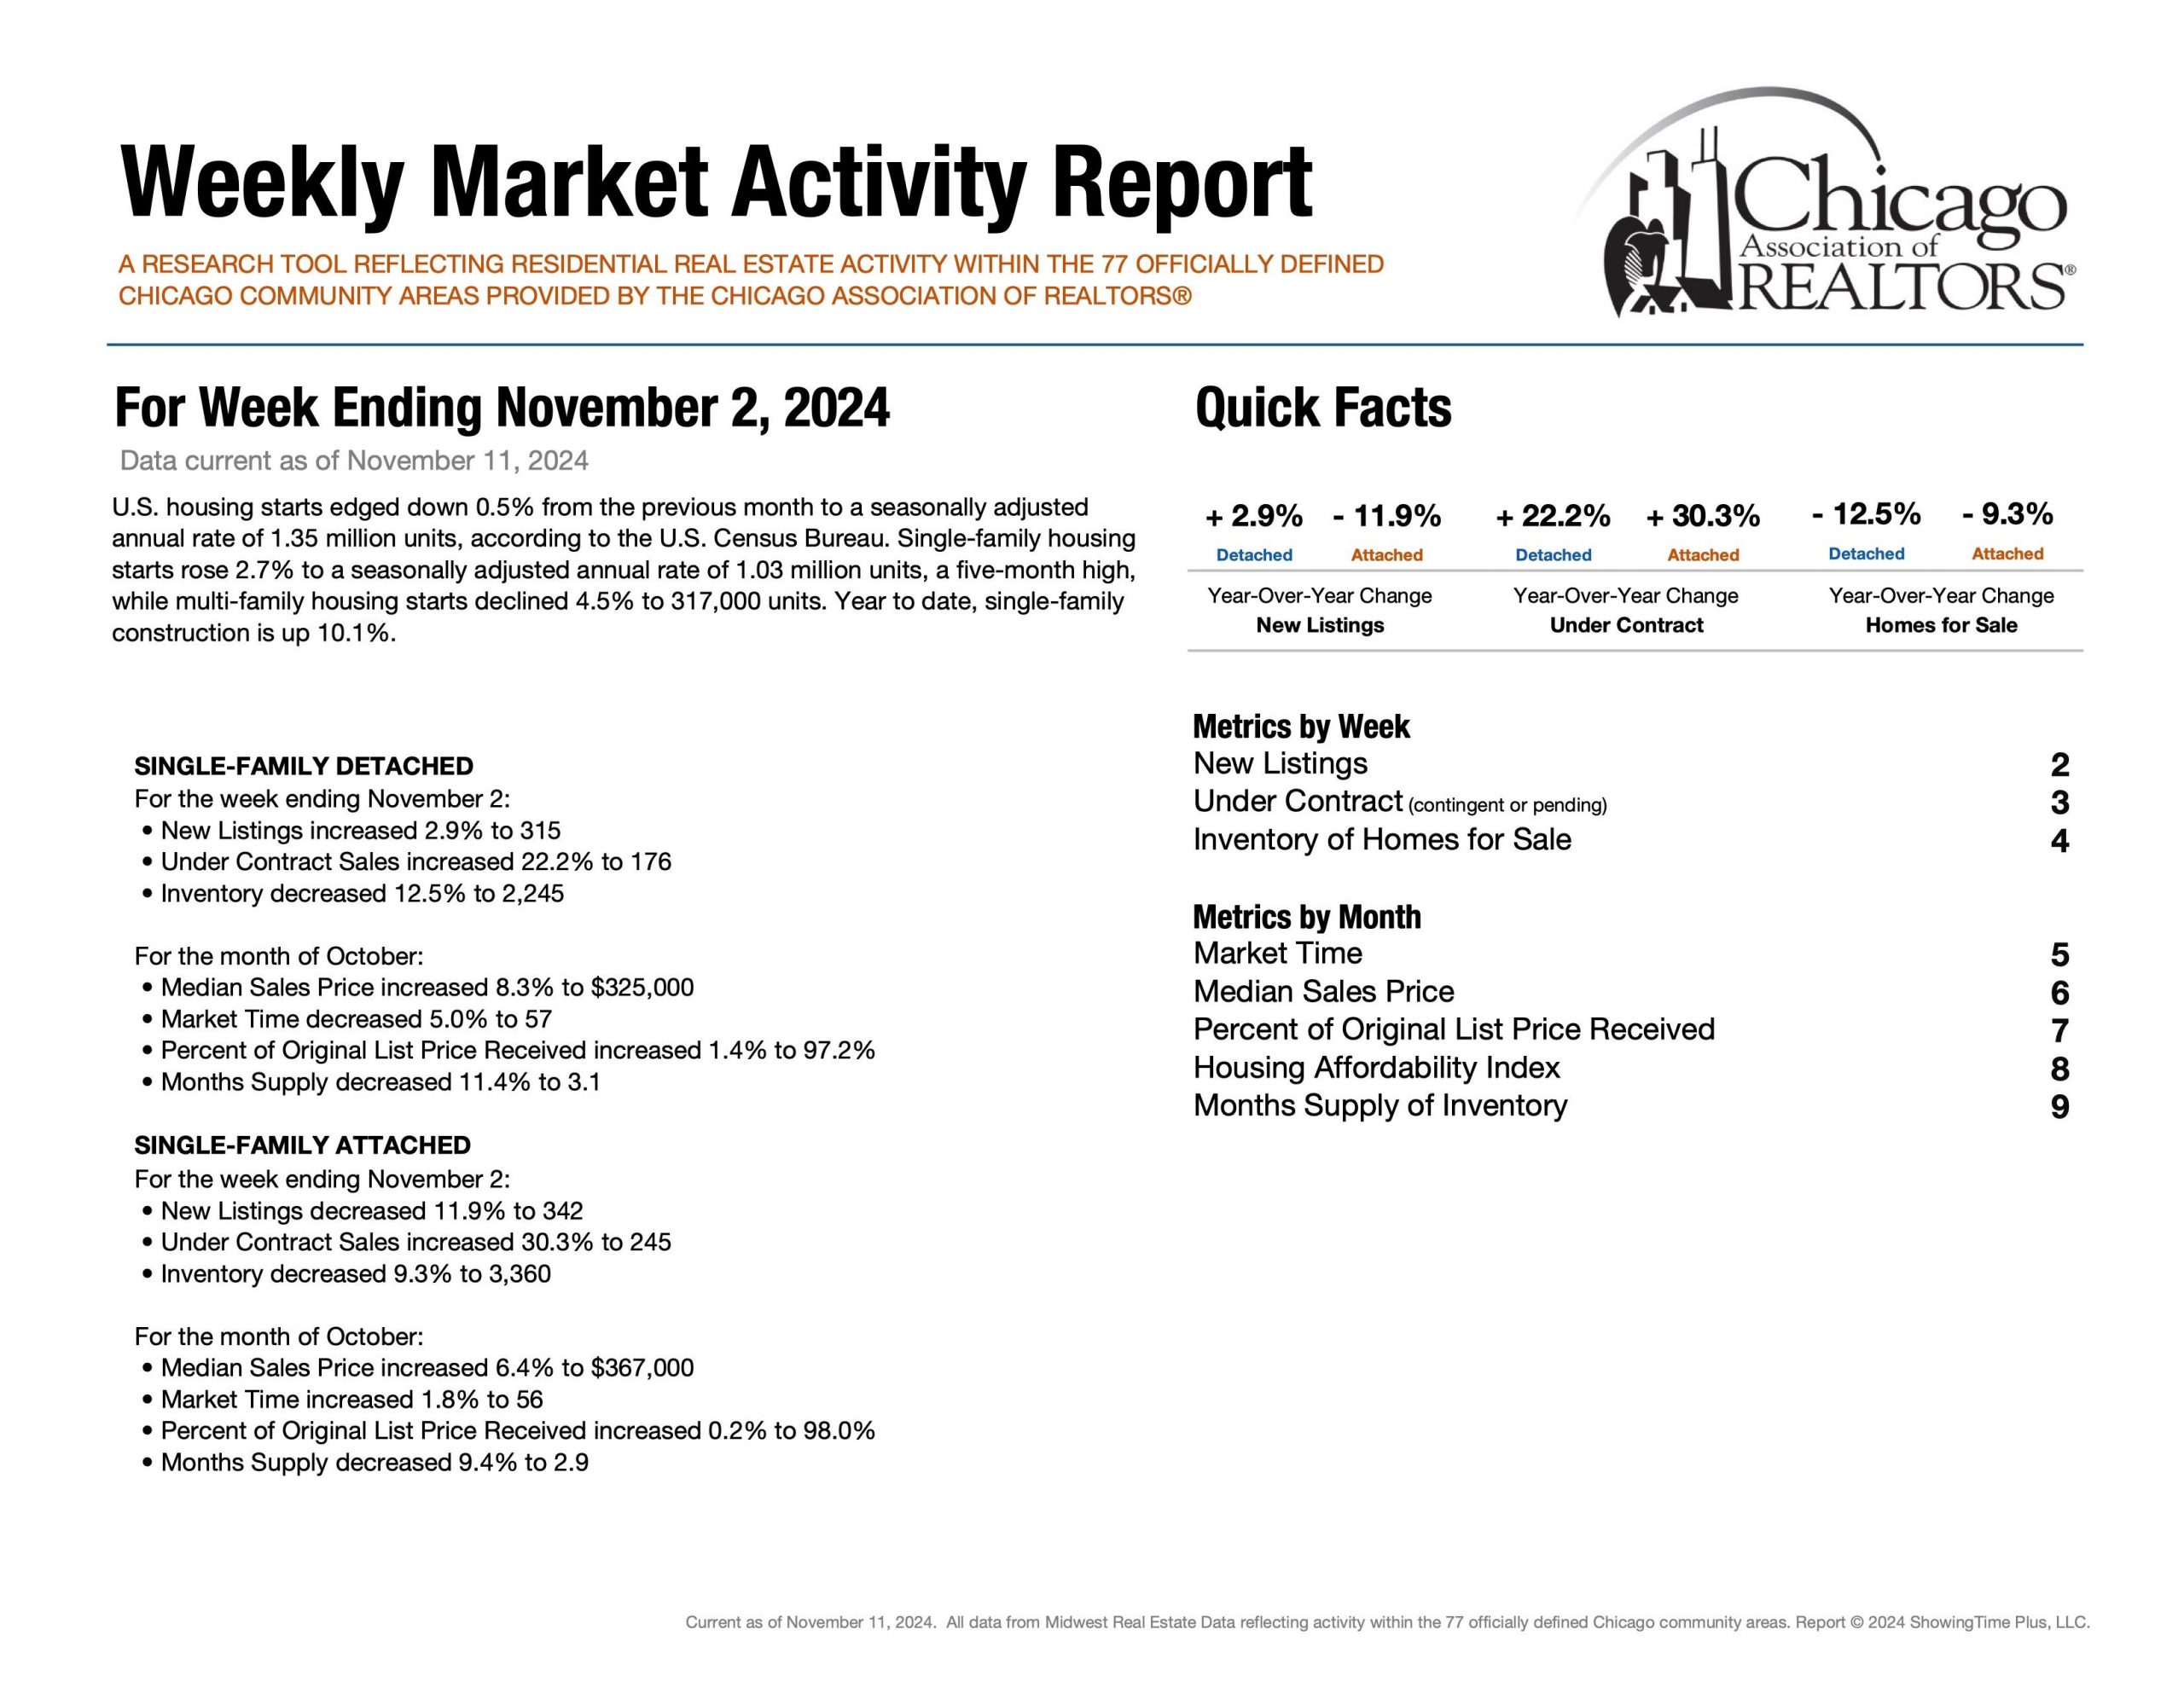
Please note all of these metrics are along a spectrum as opposed to a specific number. Below is “The Weekly Market Activity Report” which is a research tool reflecting residential real estate activity within the 77 officially defined Chicago community areas provided by the Chicago Association of Realtors®. It is essential to keep in mind that real estate markets can vary across neighborhoods and property types within a city. In conclusion, economic conditions and external factors can influence market trends. Staying updated on these metrics and trends is crucial for making informed decisions.


How Is The Chicago Real Estate Market? November 13, 2024

How Is the Chicago Real Estate Market? Week 45

November 2024 Week 45

Matthew Litzenberger a third generation Realtor with Coldwell Banker Realty helps buyers and sellers understand Chicago Real Estate Market metrics. Follow along for weekly updates on all things Chicago Real Estate by clicking here.


Introduction

Hello and welcome back to the 45th installment in our weekly series aimed to help understand current Chicago Real Estate Market Metrics. While there are many metrics to talk about in the world of real estate, today we are going to look at only four: speed, demand, supply and negotiations. Let’s get started!


Speed | Healthy Market Time Range


Detached Single ~ 57 Days (Oct 24′)

Attached Single ~ 56 Days (Oct 24′)


First, market time is metric that showcases speed and whether a listing was priced too low, priced properly or priced too high. If a listing surpasses average days on market, it is a check engine light that your listing maybe overpriced.


Demand | Under Contract


Detached Single = 176 Properties (Oct 27th – Nov 2nd)

Attached Single = 245 Properties (Oct 27th – Nov 2nd)

Secondly, under contract helps answer the question, “In our current market, how many buyers are buying?” Showcasing the heartbeat of the real estate market. Interestingly, demand metrics become more insightful when compared and contrasted with supply/inventory metrics.


Supply | Inventory of Homes for Sale


Detached Single = 2,245 Properties (Oct 27th – Nov 2nd)

Attached Single = 3,360 Properties (Oct 27th – Nov 2nd)

Next, supply showcases how much inventory is available for buyers and how much competition sellers are up against. Additionally, Months of Inventory, Homes for Sale, New Listings and Absorption Rate are also other key metrics in the conversation of supply.


Negotiations | Percentage of Original List Price Received


Detached Single ~ 97.7% (Rolling 12 Months Avg) & ~ 97.2% (Oct 24′)

Attached Single ~ 98.5% (Rolling 12 Months Avg) & ~ 98.0% (Oct 24′)

Lastly, Percentage of Original List Price Received to Closed Price is a metric that showcases what the average accepted purchase price is relative to the list price. How much below asking price can an offer go while still getting accepted? How much would one have to offer above ask in order to be an above average purchase price?


The End | Have A Great Day!

Please note all of these metrics are along a spectrum as opposed to a specific number. Below is “The Weekly Market Activity Report” which is a research tool reflecting residential real estate activity within the 77 officially defined Chicago community areas provided by the Chicago Association of Realtors®. It is essential to keep in mind that real estate markets can vary across neighborhoods and property types within a city. In conclusion, economic conditions and external factors can influence market trends. Staying updated on these metrics and trends is crucial for making informed decisions.
Lender Mediated November 4, 2024

How is the Chicago Real Estate Market? Lender Mediated Report

Lender-Mediated Report

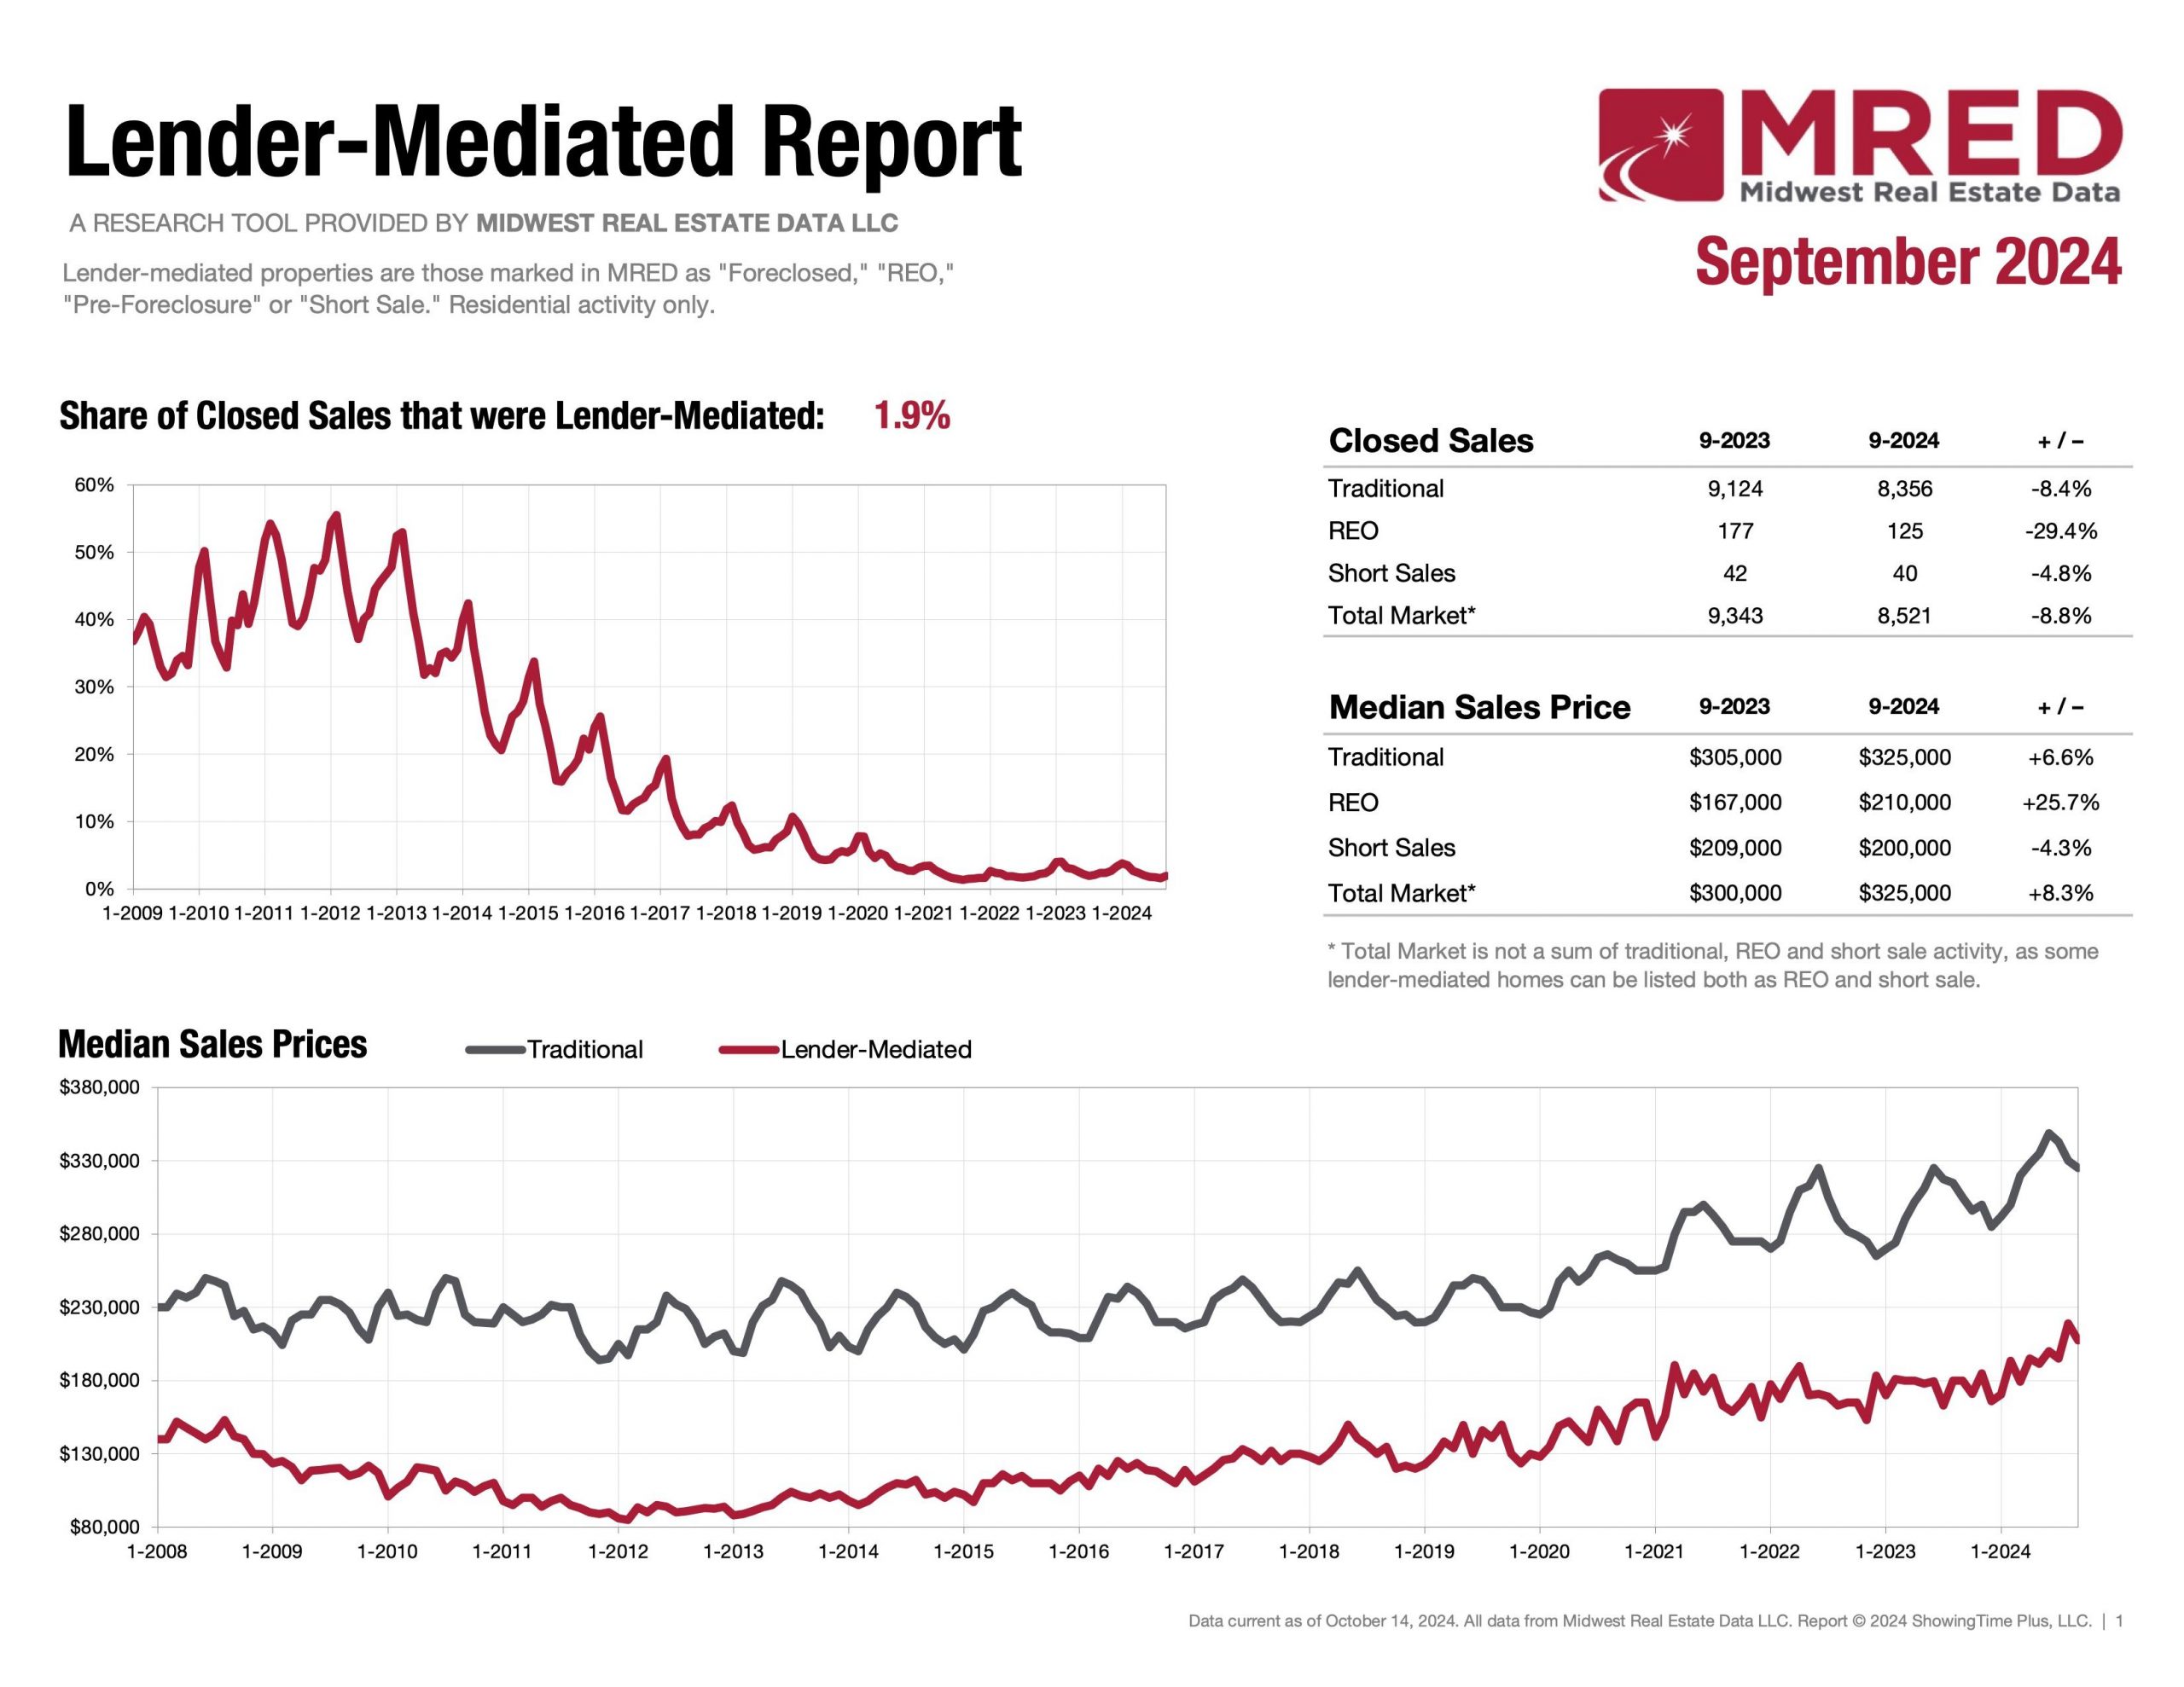
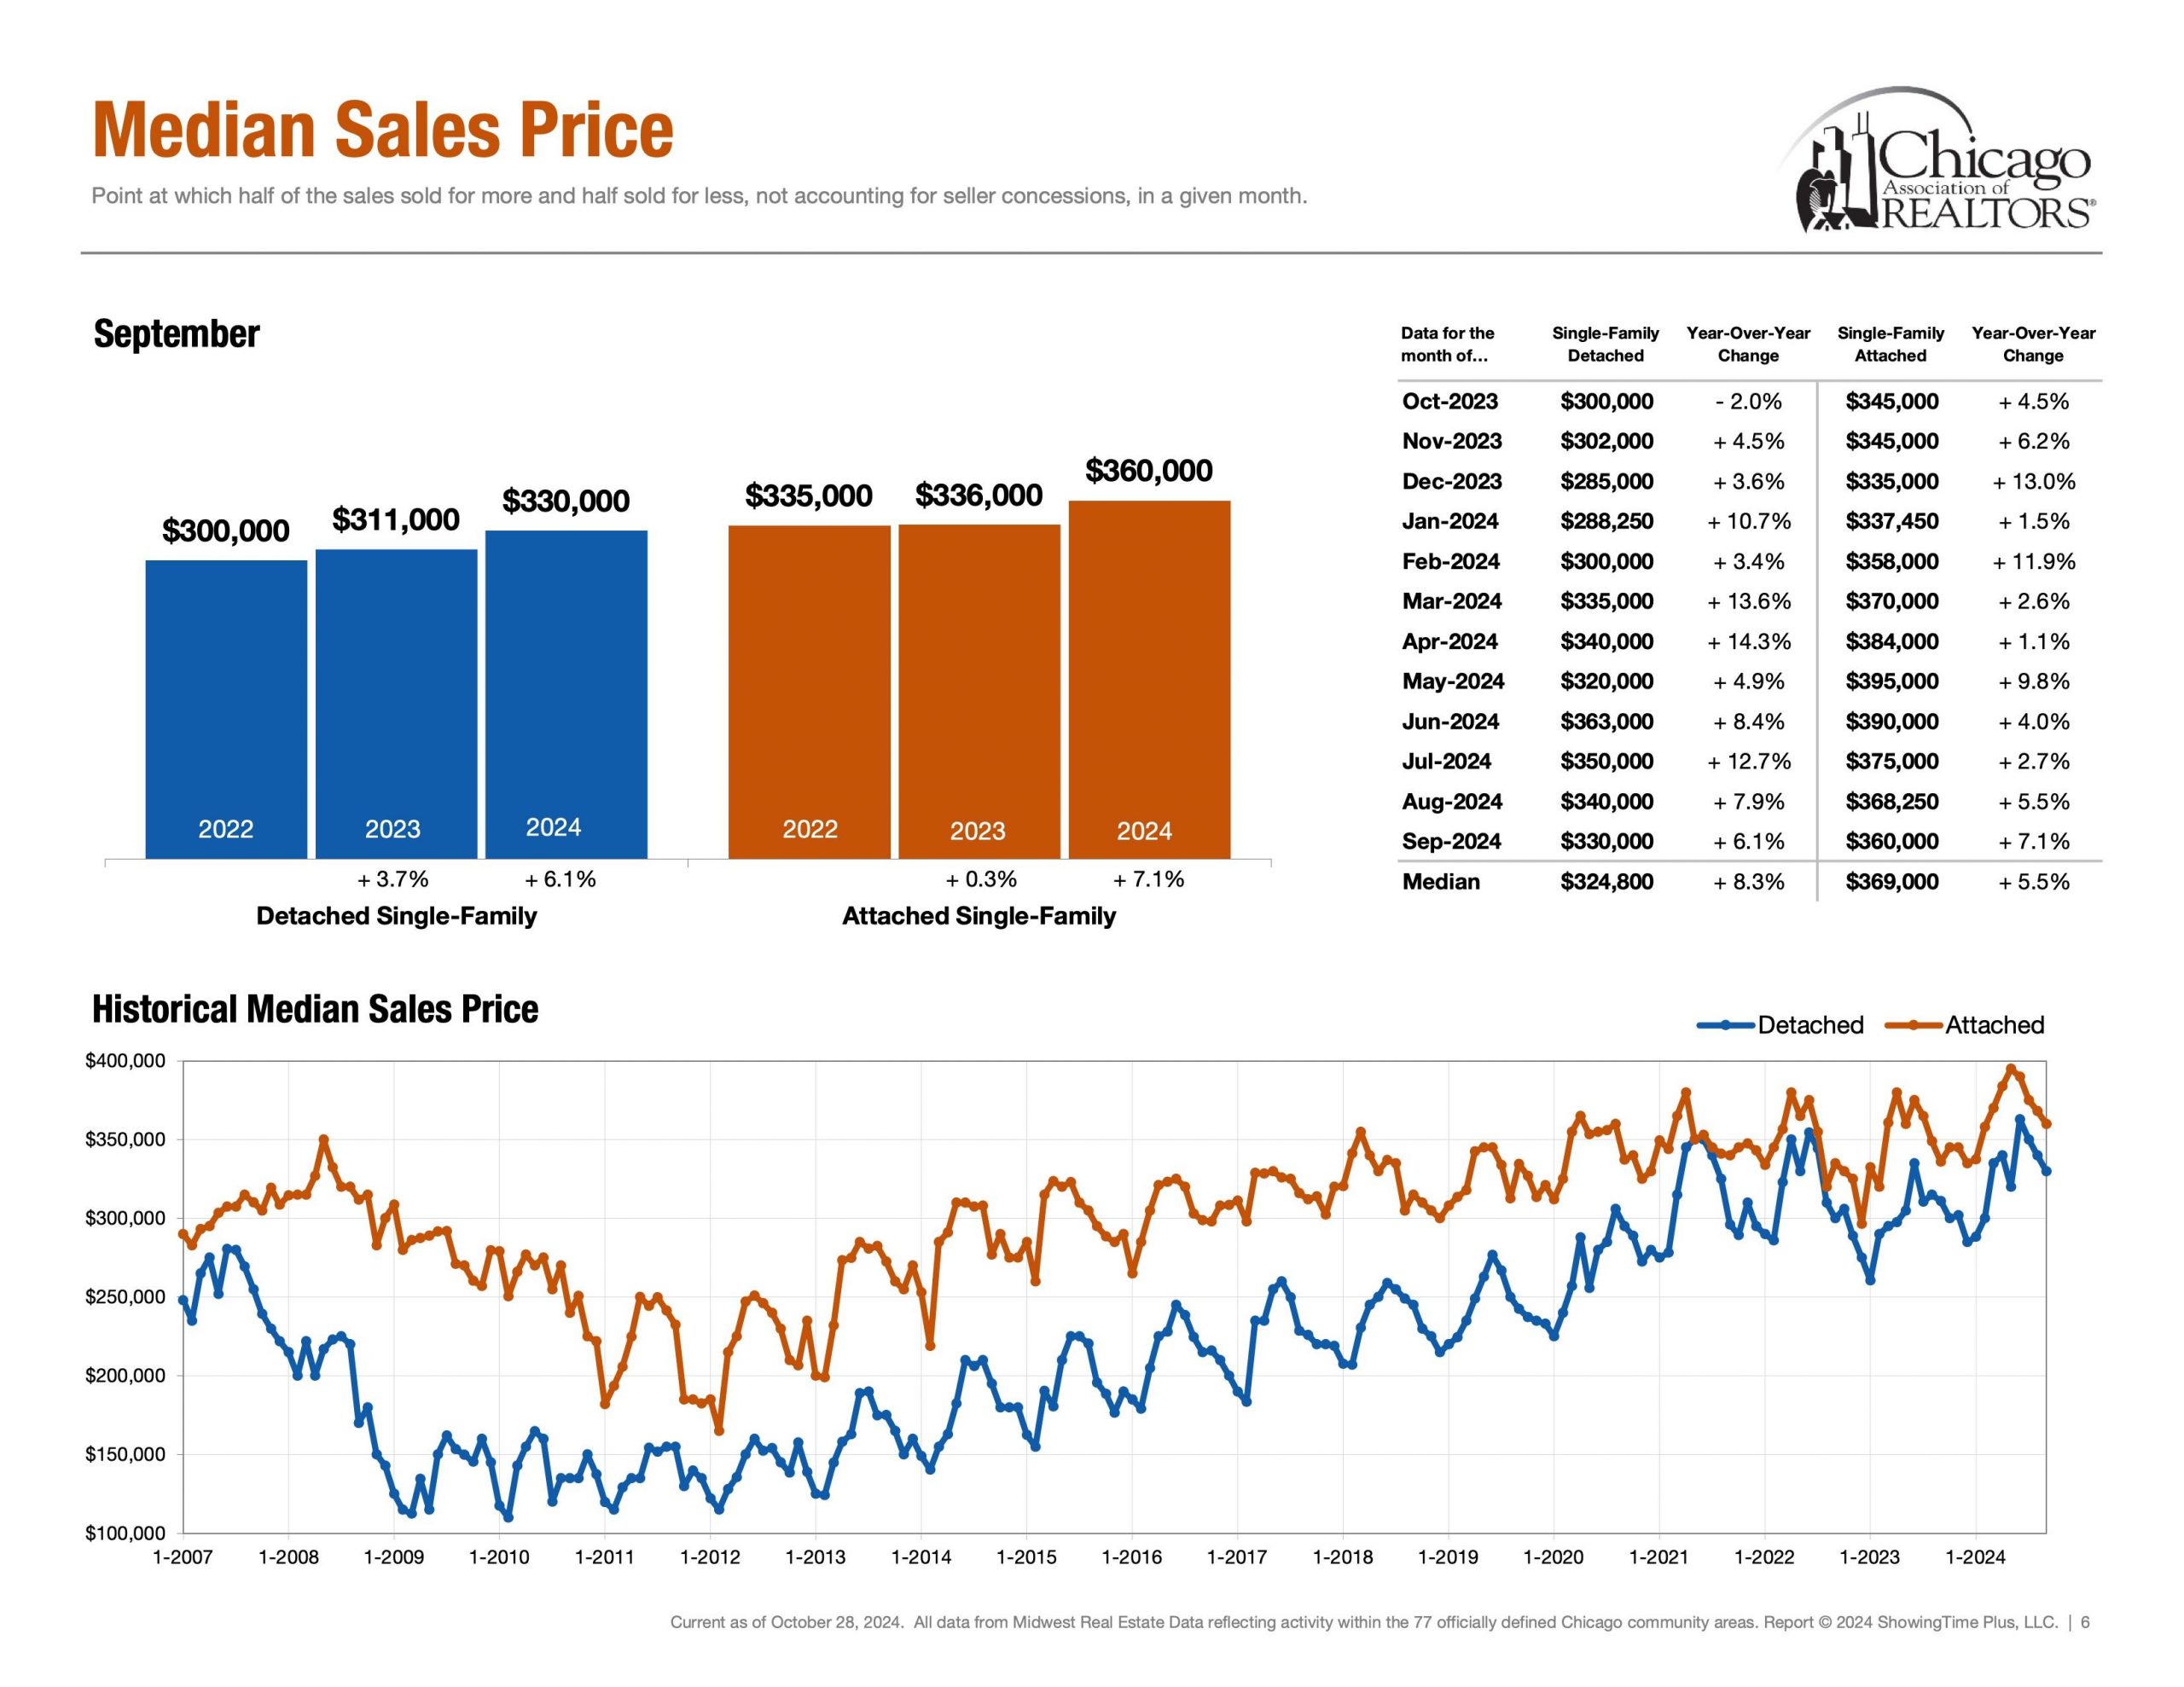
This Lender-Mediated Report provides insight into properties that are REO-Bank Owned, Pre-Foreclosure, or Short Sales. Focusing on “Share of Closed Sales that were Lender-Mediated” for September 2024. The insight is 1.9% of properties were lender mediated. Which equates to 8,521 sales in September 2024, a -8.8% decrease compared to September 2023 (9,343 Sales). When compared to the housing crisis and the following years of ” housing market recovery”.

Numerous real estate forecasts for 2024 made predictions on lender mediated properties increasing or even returning to housing crisis levels. The goal in providing this information is to provide information backed by data. I am not able to predict the future anymore then the next person can, nor do I support for unfounded predictions. I can tell you where the market was and is. We can ask the magic 8 ball where it will go. Also, time will tell. Lastly, if you would like a lender-mediated report tailored more towards you and your use case. Reach out. Talk soon.


How Is The Chicago Real Estate Market? October 19, 2024

How Is the Chicago Real Estate Market? Week 42

October 2024 Week 42

Matthew Litzenberger a third generation Realtor with Coldwell Banker Realty helps buyers and sellers understand Chicago Real Estate Market metrics. Follow along for weekly updates on all things Chicago Real Estate by clicking here.


Introduction

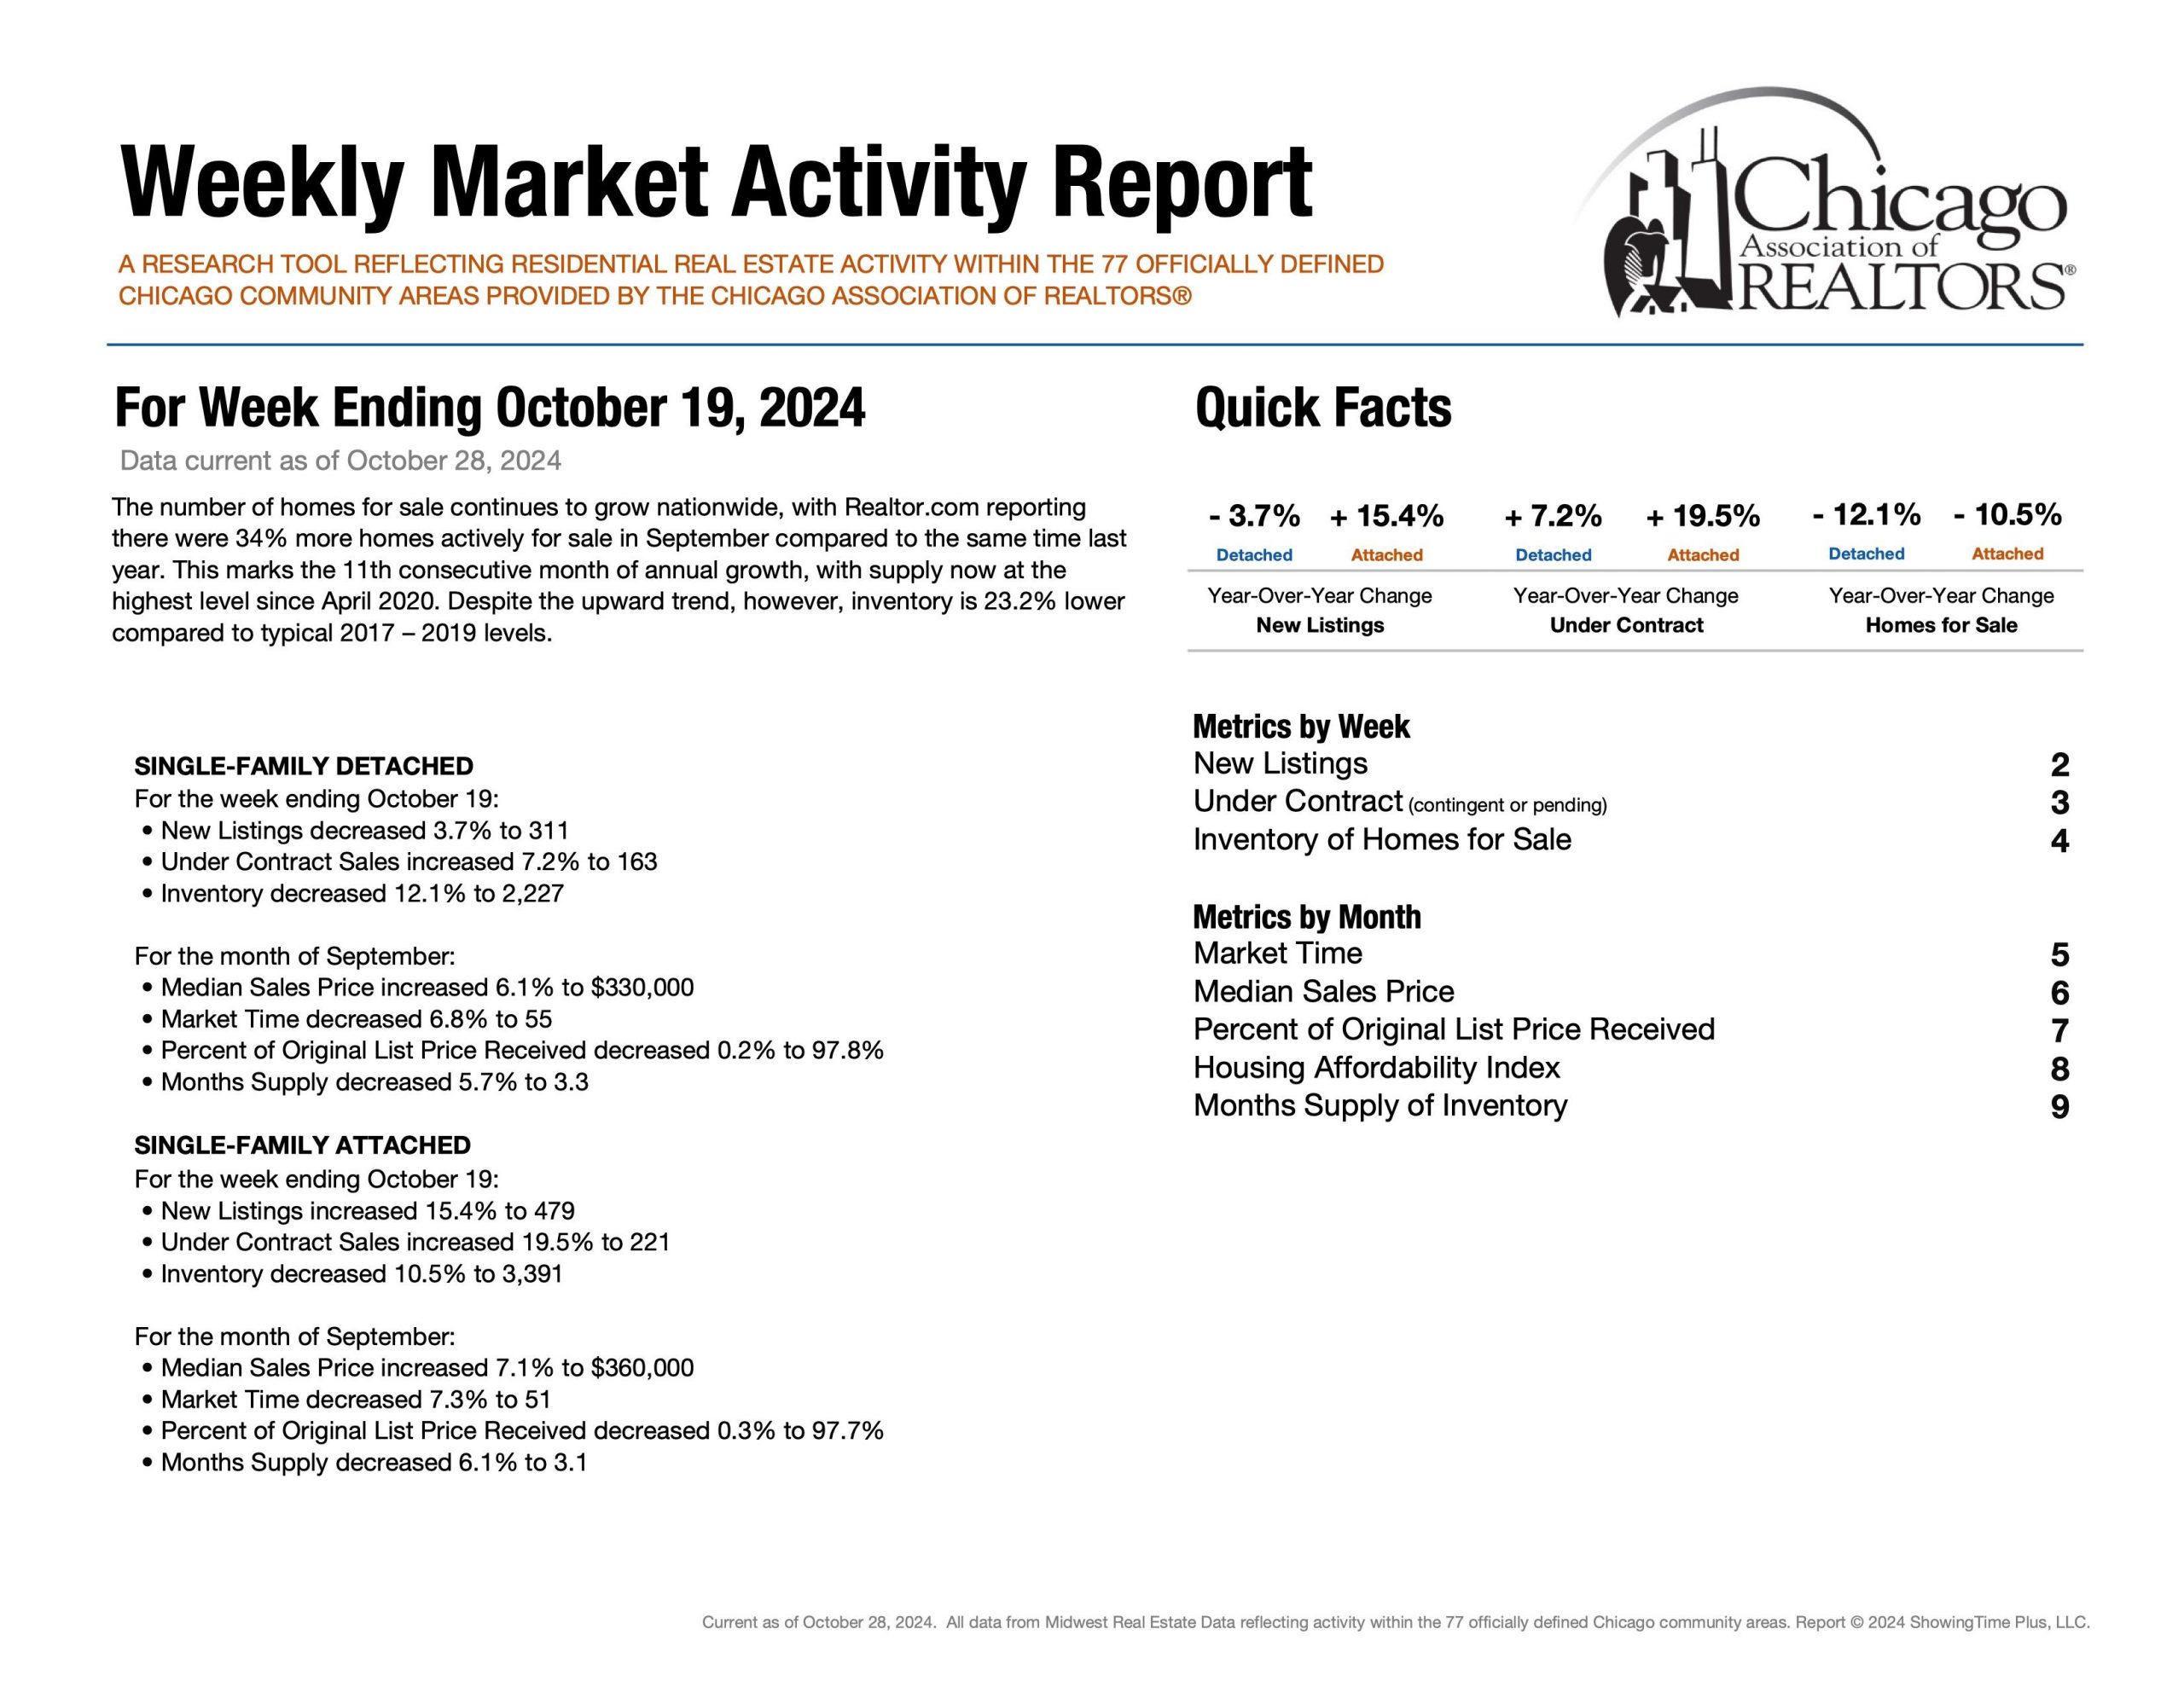
Hello and welcome back to the 42nd installment in our weekly series aimed to help understand current Chicago Real Estate Market Metrics. While there are many metrics to talk about in the world of real estate, today we are going to look at only four: speed, demand, supply and negotiations. Let’s get started!


Speed | Healthy Market Time Range


Detached Single ~ 55 Days (Sep 24′)

Attached Single ~ 51 Days (Sep 24′)


First, market time is metric that showcases speed and whether a listing was priced too low, priced properly or priced too high. If a listing surpasses average days on market, it is a check engine light that your listing maybe overpriced.


Demand | Under Contract


Detached Single = 163 Properties (Oct 13th – Oct 19th)

Attached Single = 221 Properties (Oct 13th – Oct 19th)

Secondly, under contract helps answer the question, “In our current market, how many buyers are buying?” Showcasing the heartbeat of the real estate market. Interestingly, demand metrics become more insightful when compared and contrasted with supply/inventory metrics.


Supply | Inventory of Homes for Sale


Detached Single = 2,227 Properties (Oct 13th – Oct 19th)

Attached Single = 3,391 Properties (Oct 13th – Oct 19th)

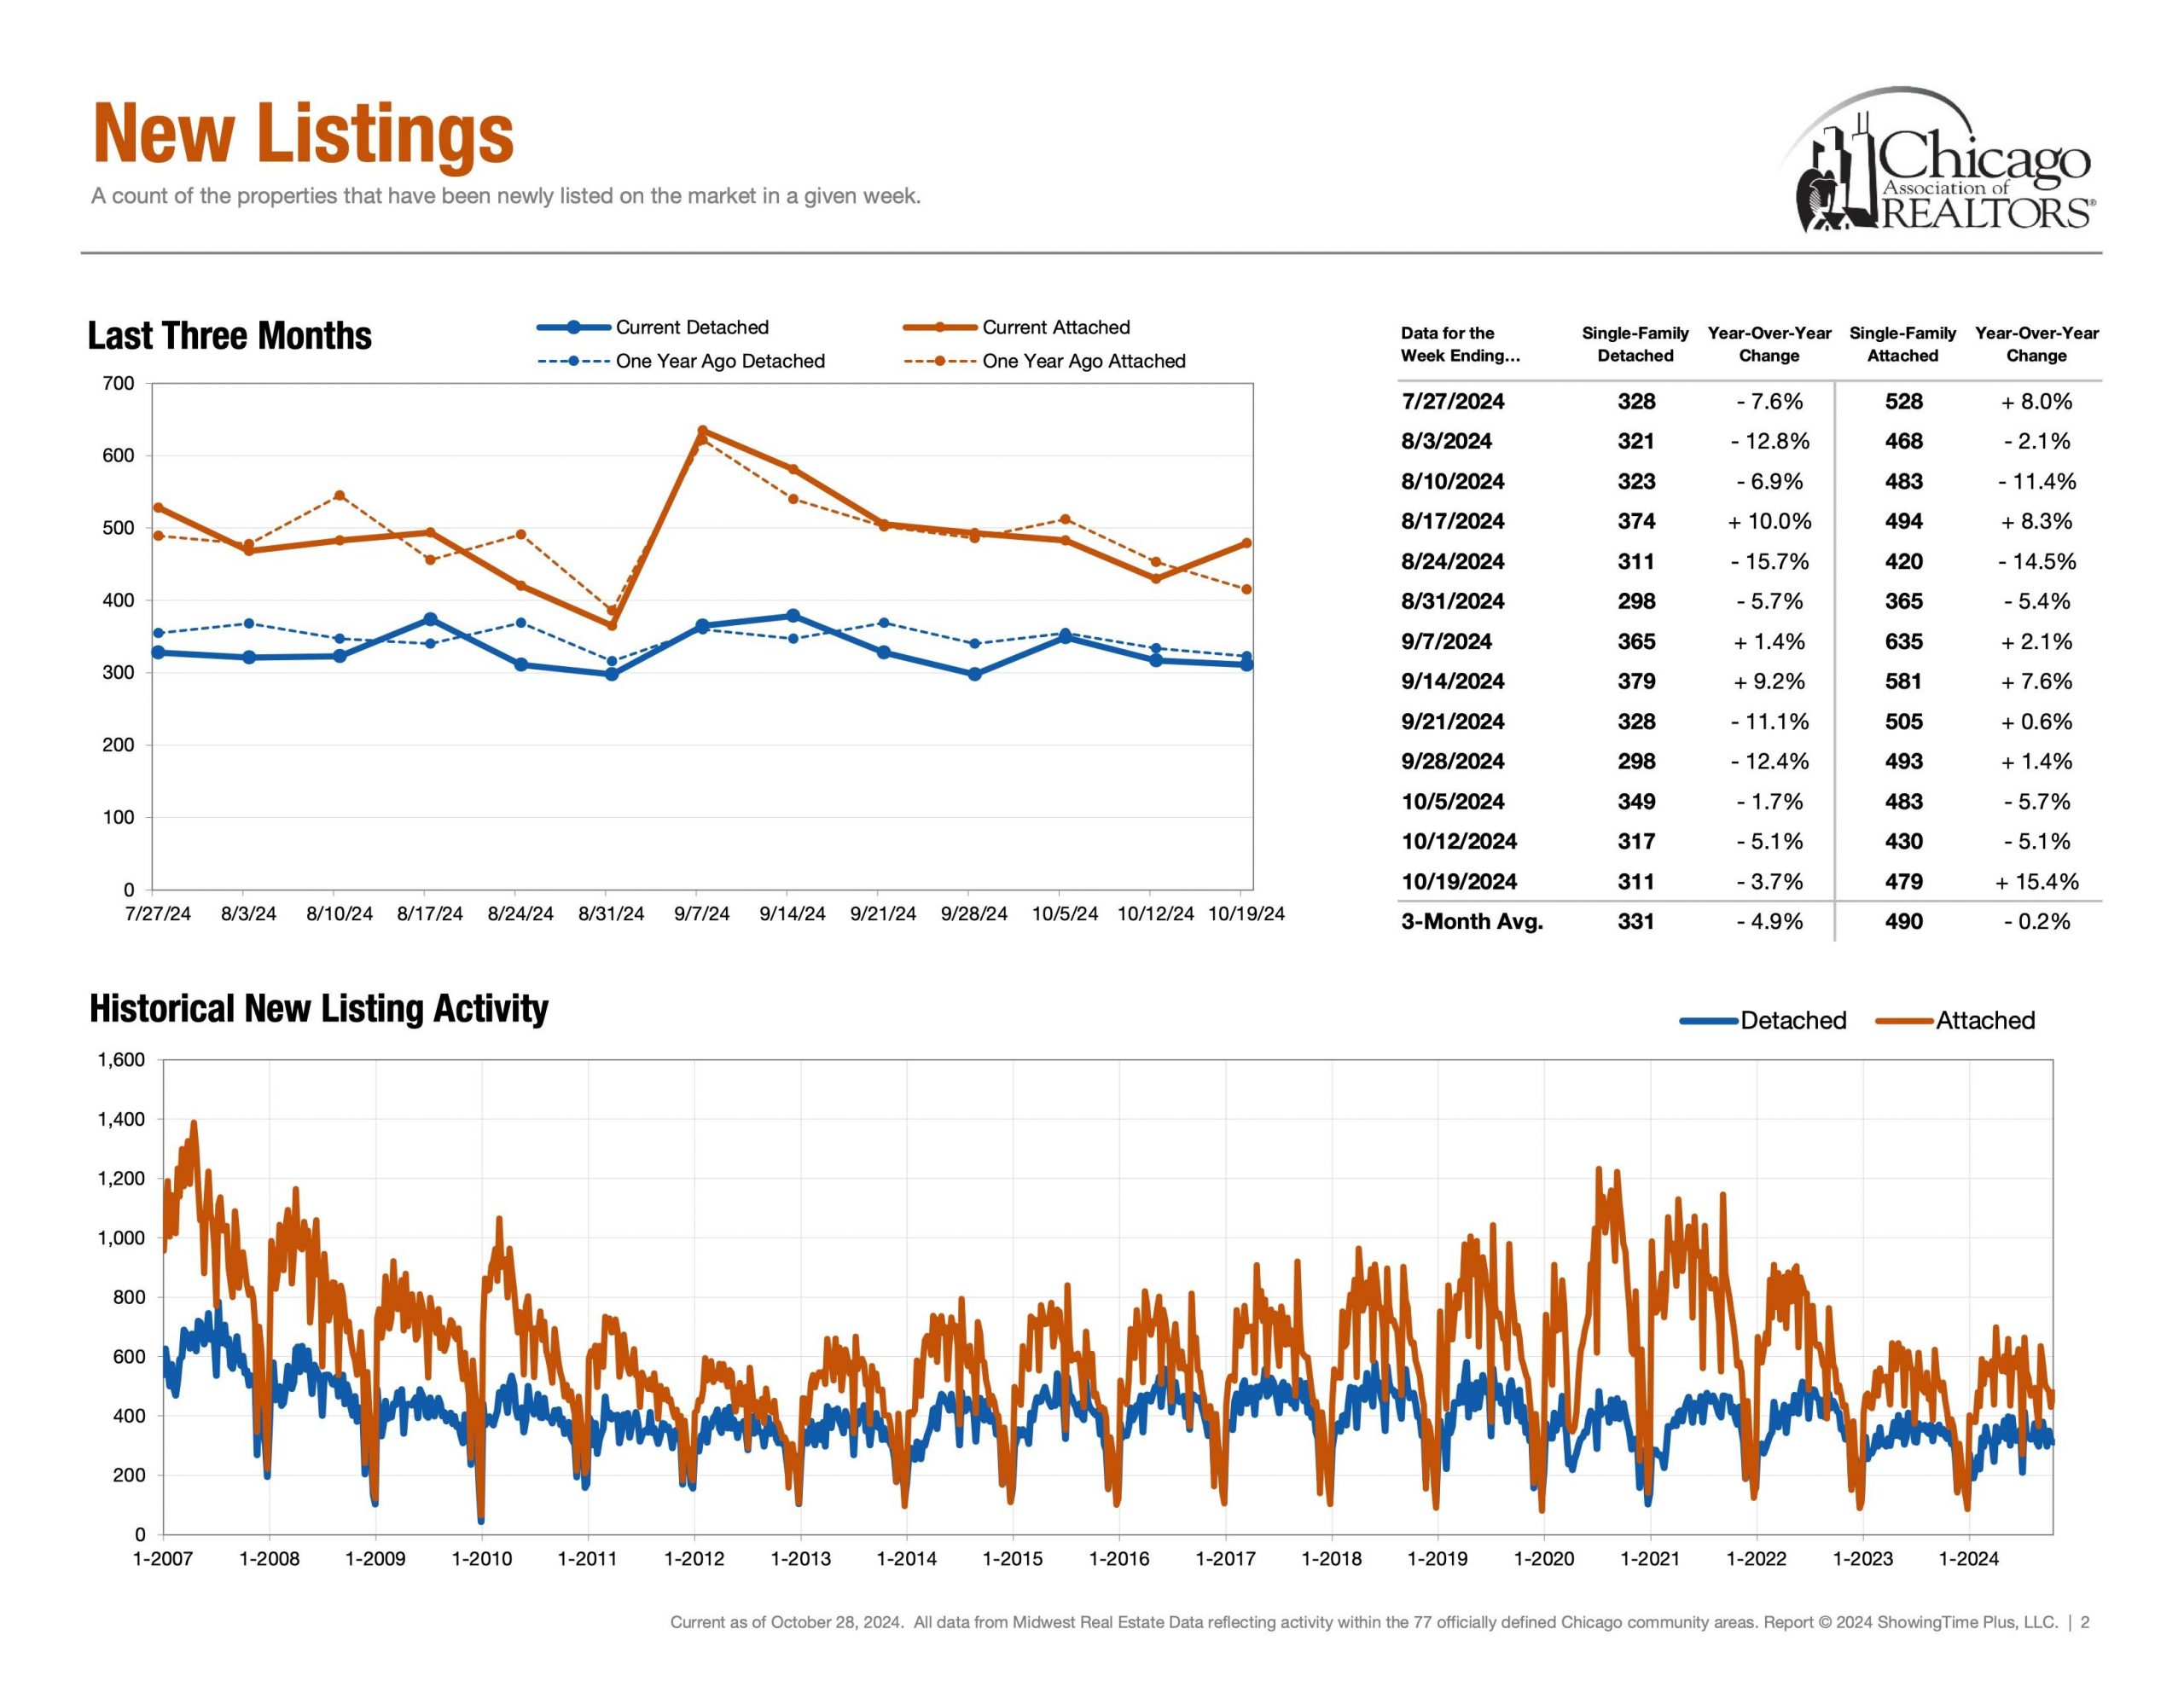
Next, supply showcases how much inventory is available for buyers and how much competition sellers are up against. Additionally, Months of Inventory, Homes for Sale, New Listings and Absorption Rate are also other key metrics in the conversation of supply.


Negotiations | Percentage of Original List Price Received


Detached Single ~ 97.6% (Rolling 12 Months Avg) & ~ 97.8% (Oct 24′)

Attached Single ~ 98.5% (Rolling 12 Months Avg) & ~ 97.7% (Oct 24′)

Lastly, Percentage of Original List Price Received to Closed Price is a metric that showcases what the average accepted purchase price is relative to the list price. How much below asking price can an offer go while still getting accepted? How much would one have to offer above ask in order to be an above average purchase price?


The End | Have A Great Day!

Please note all of these metrics are along a spectrum as opposed to a specific number. Below is “The Weekly Market Activity Report” which is a research tool reflecting residential real estate activity within the 77 officially defined Chicago community areas provided by the Chicago Association of Realtors®. It is essential to keep in mind that real estate markets can vary across neighborhoods and property types within a city. In conclusion, economic conditions and external factors can influence market trends. Staying updated on these metrics and trends is crucial for making informed decisions.
 

How Is The Chicago Real Estate Market? June 22, 2024

How Is the Chicago Real Estate Market? Week 25

June 2024 Week 25

Matthew Litzenberger a third generation Realtor with Coldwell Banker Realty helps buyers and sellers understand Chicago Real Estate Market metrics. Follow along for weekly updates on all things Chicago Real Estate by clicking here.


Introduction

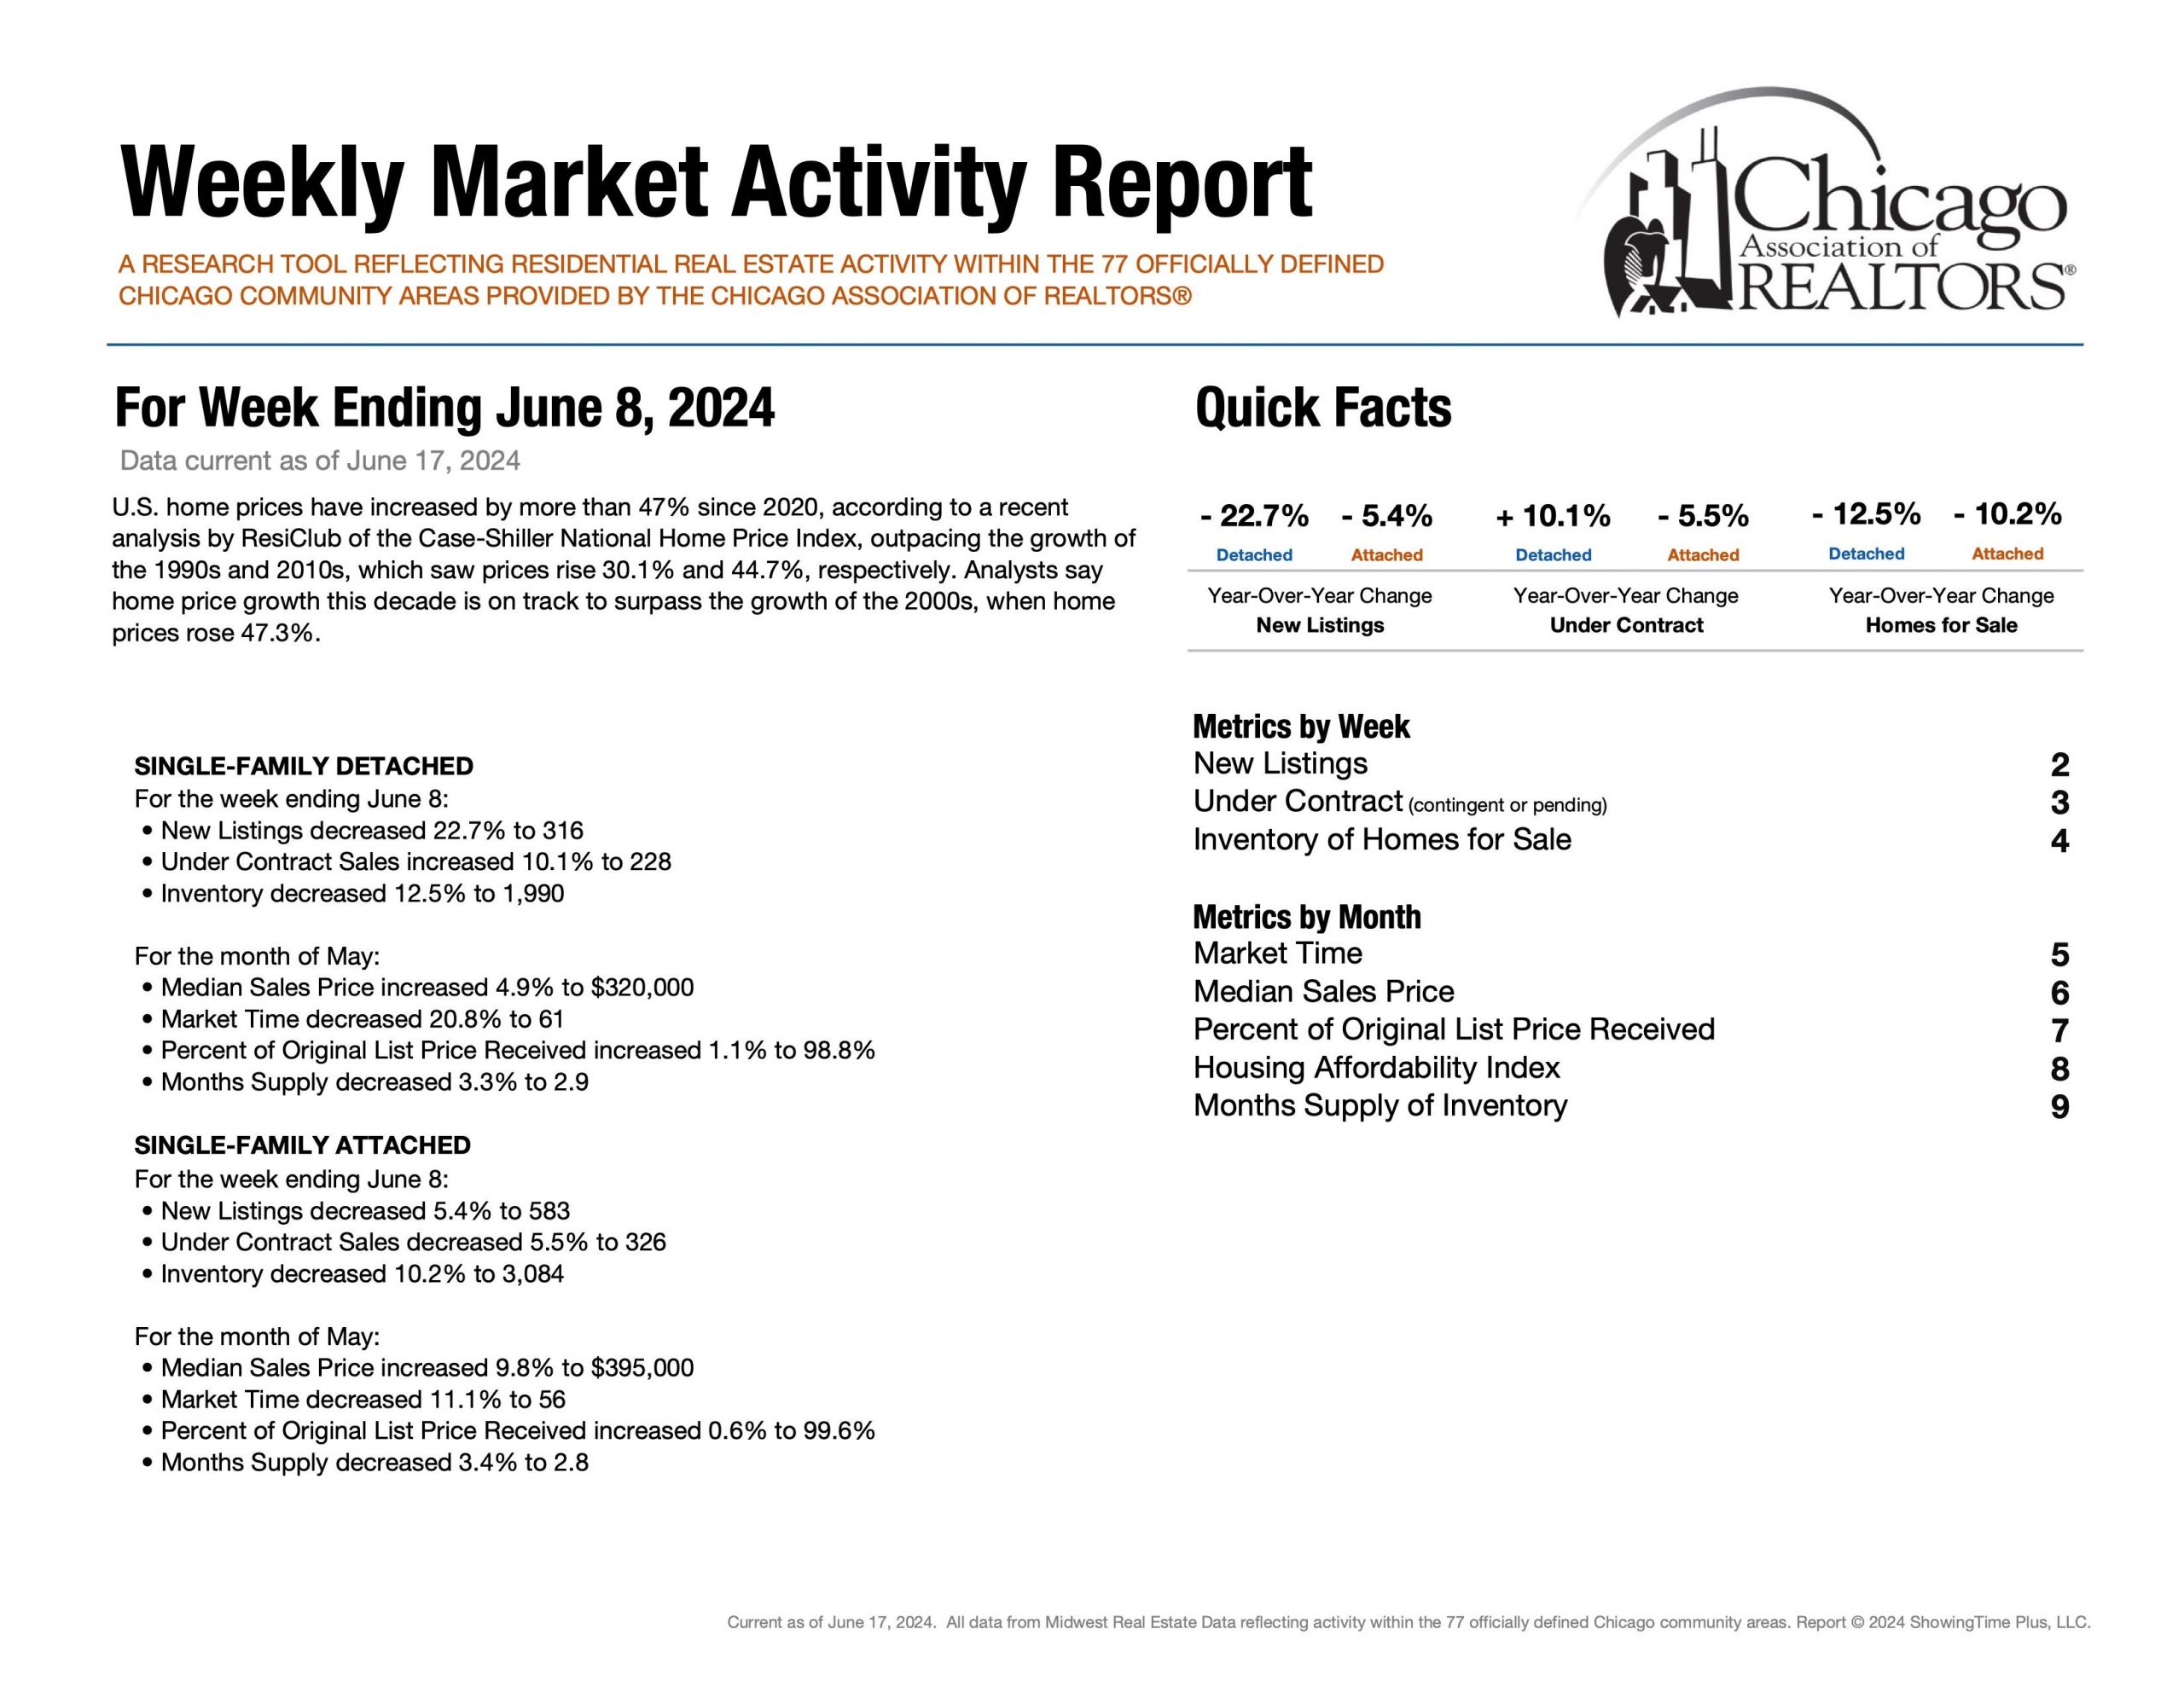
Hello and welcome back to the 25th installment in our weekly series aimed to help understand current Chicago Real Estate Market Metrics. While there are many metrics to talk about in the world of real estate, today we are going to look at only four: speed, demand, supply and negotiations. Let’s get started!


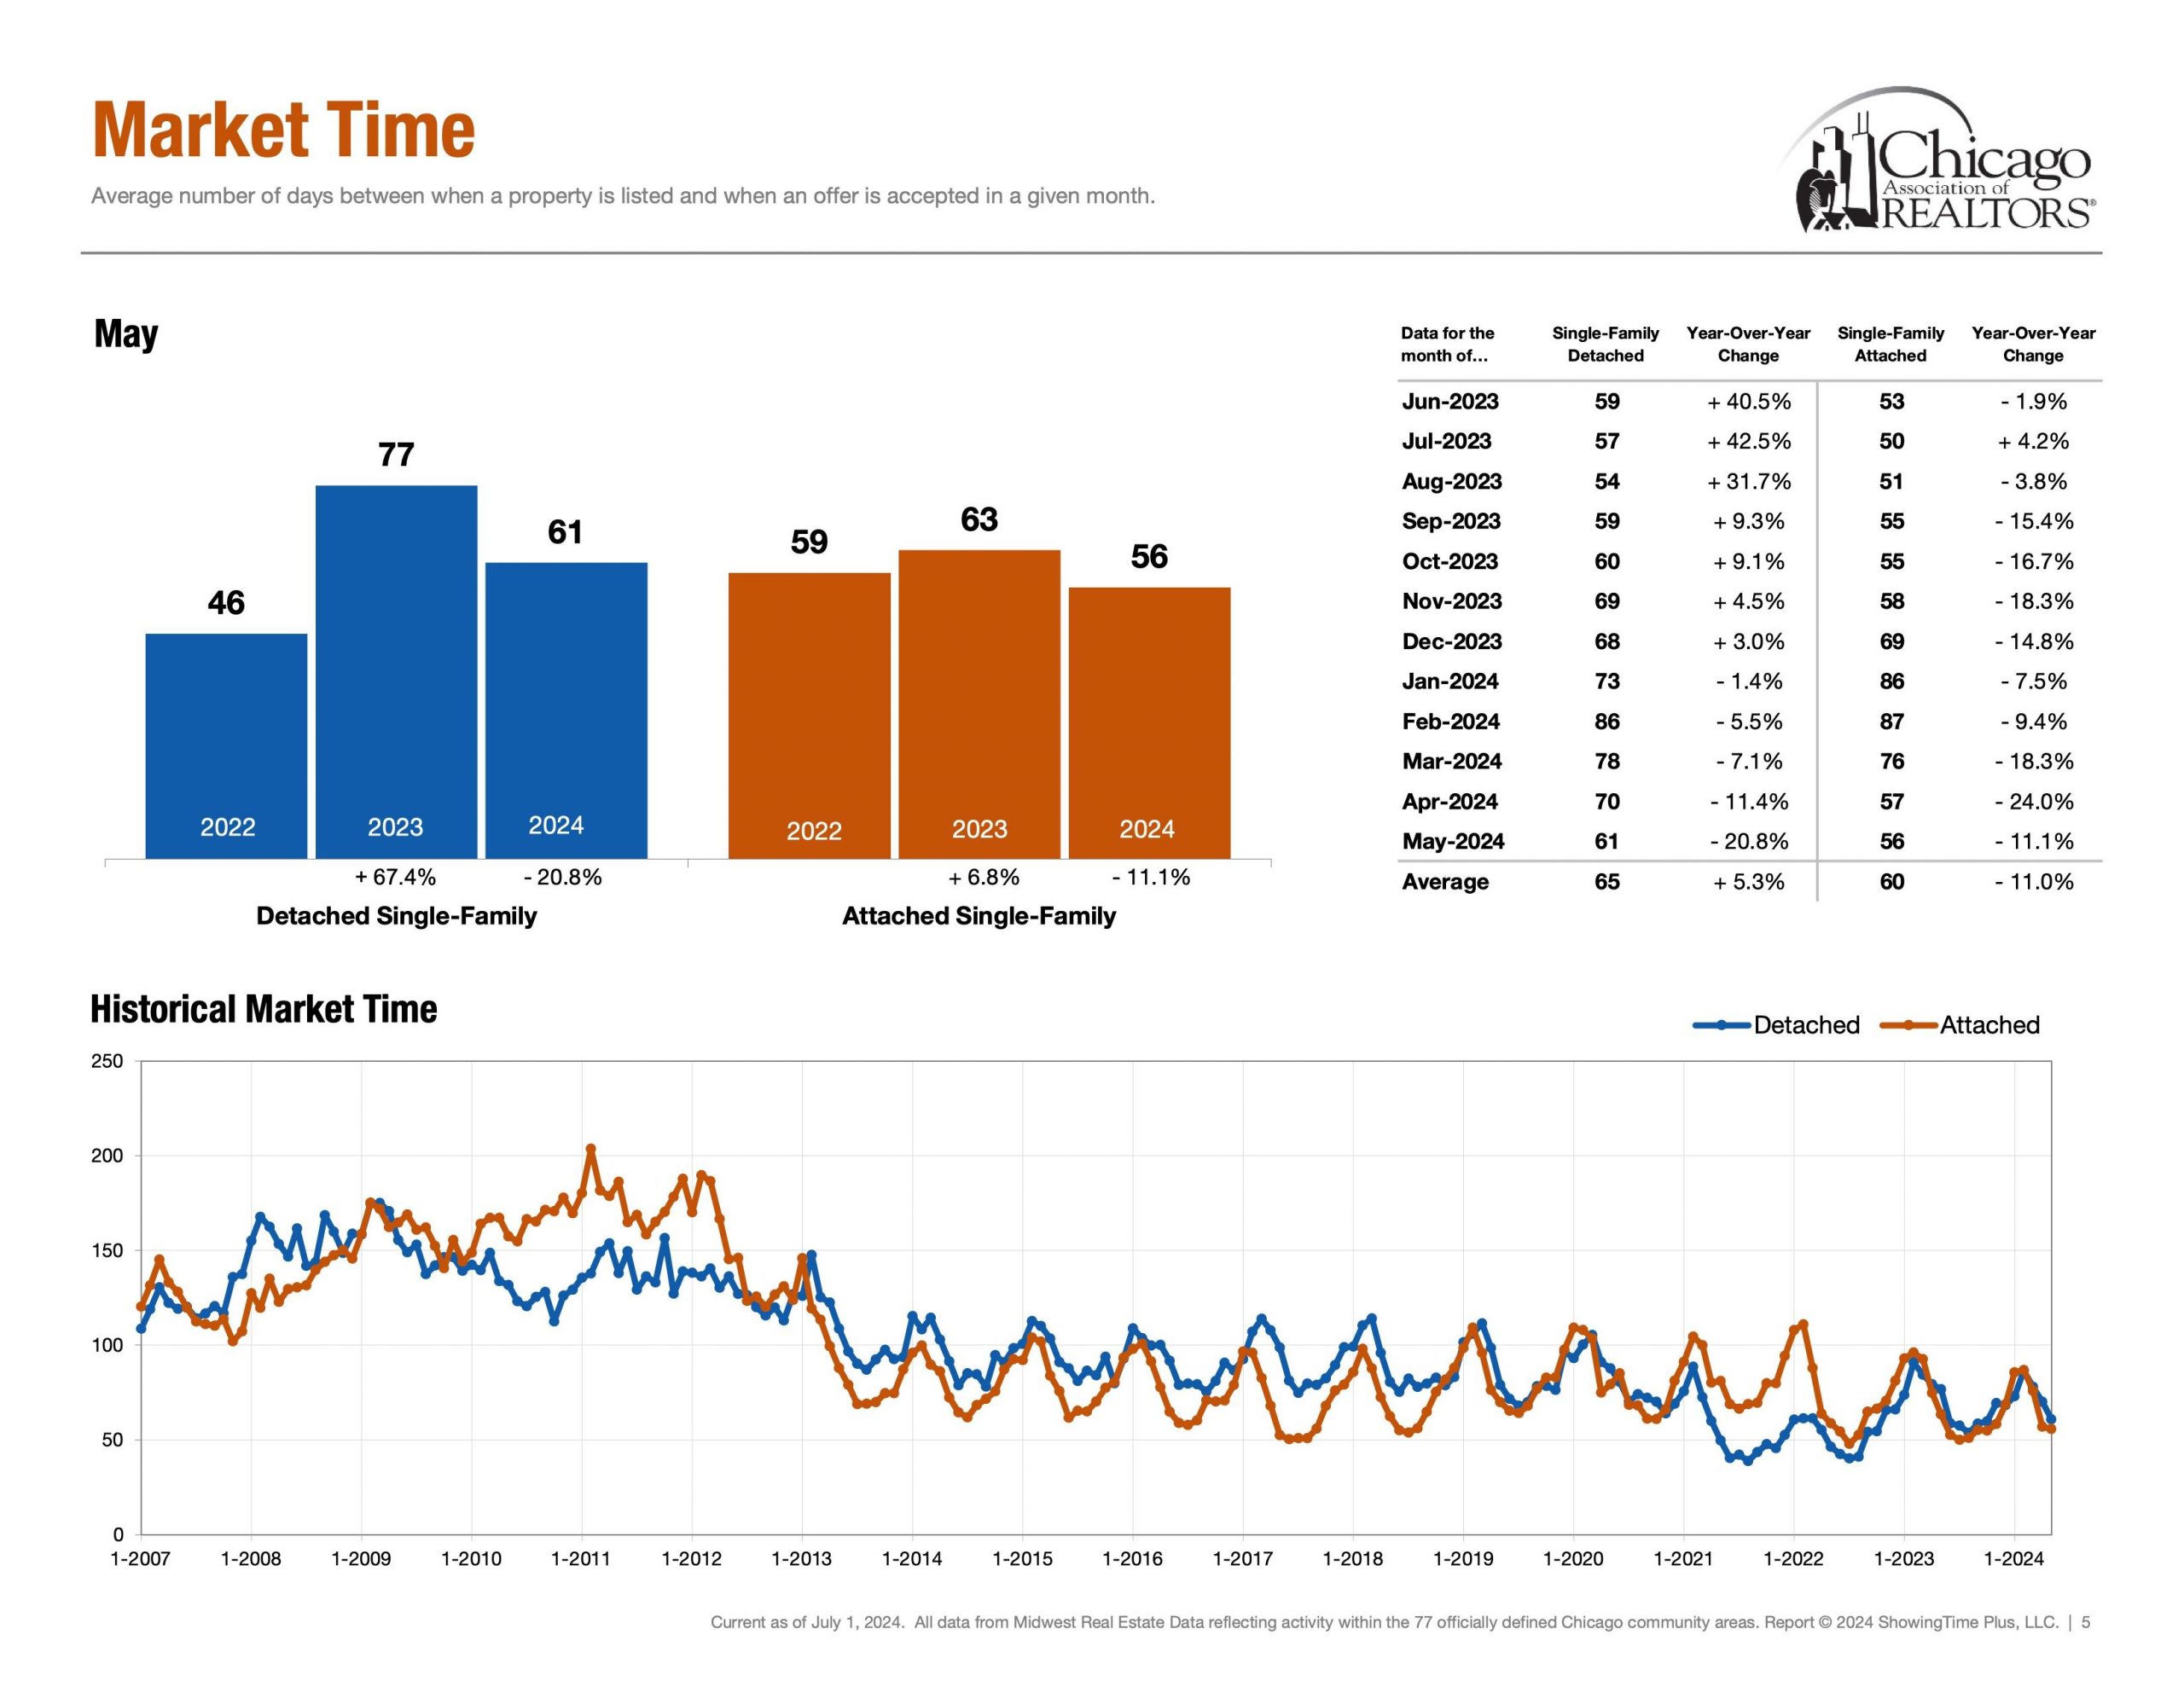
Speed | Healthy Market Time Range


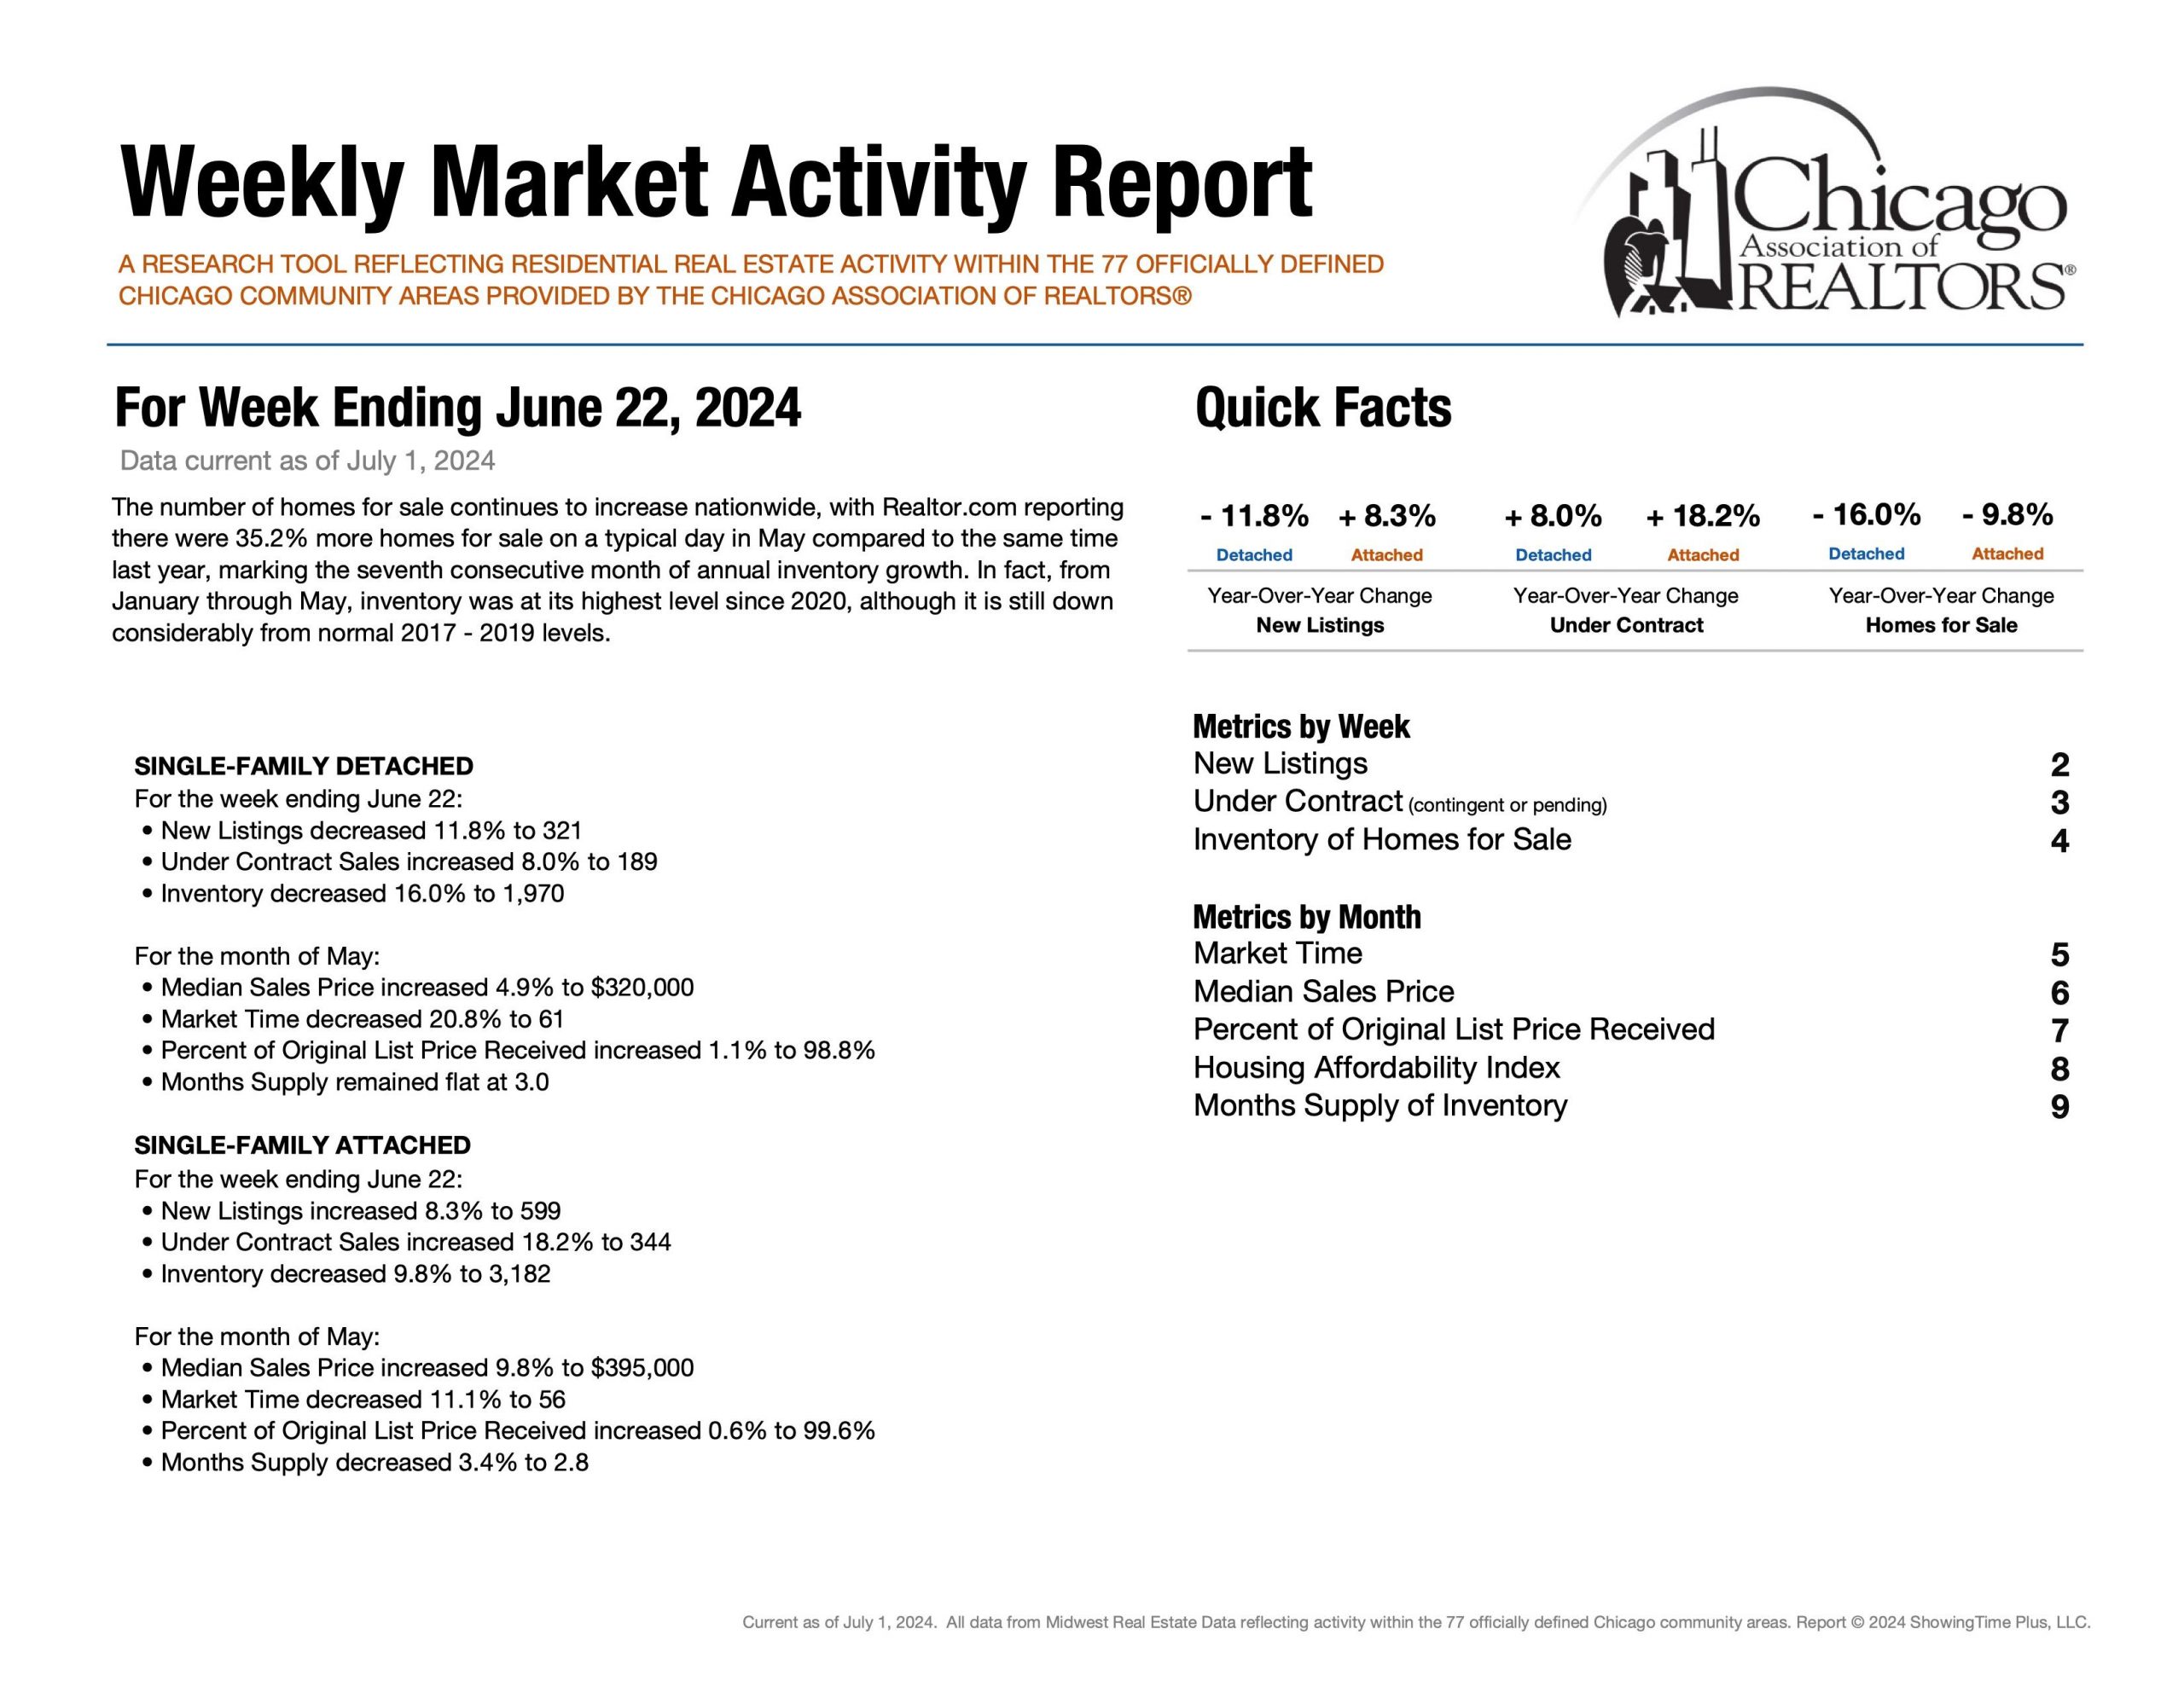
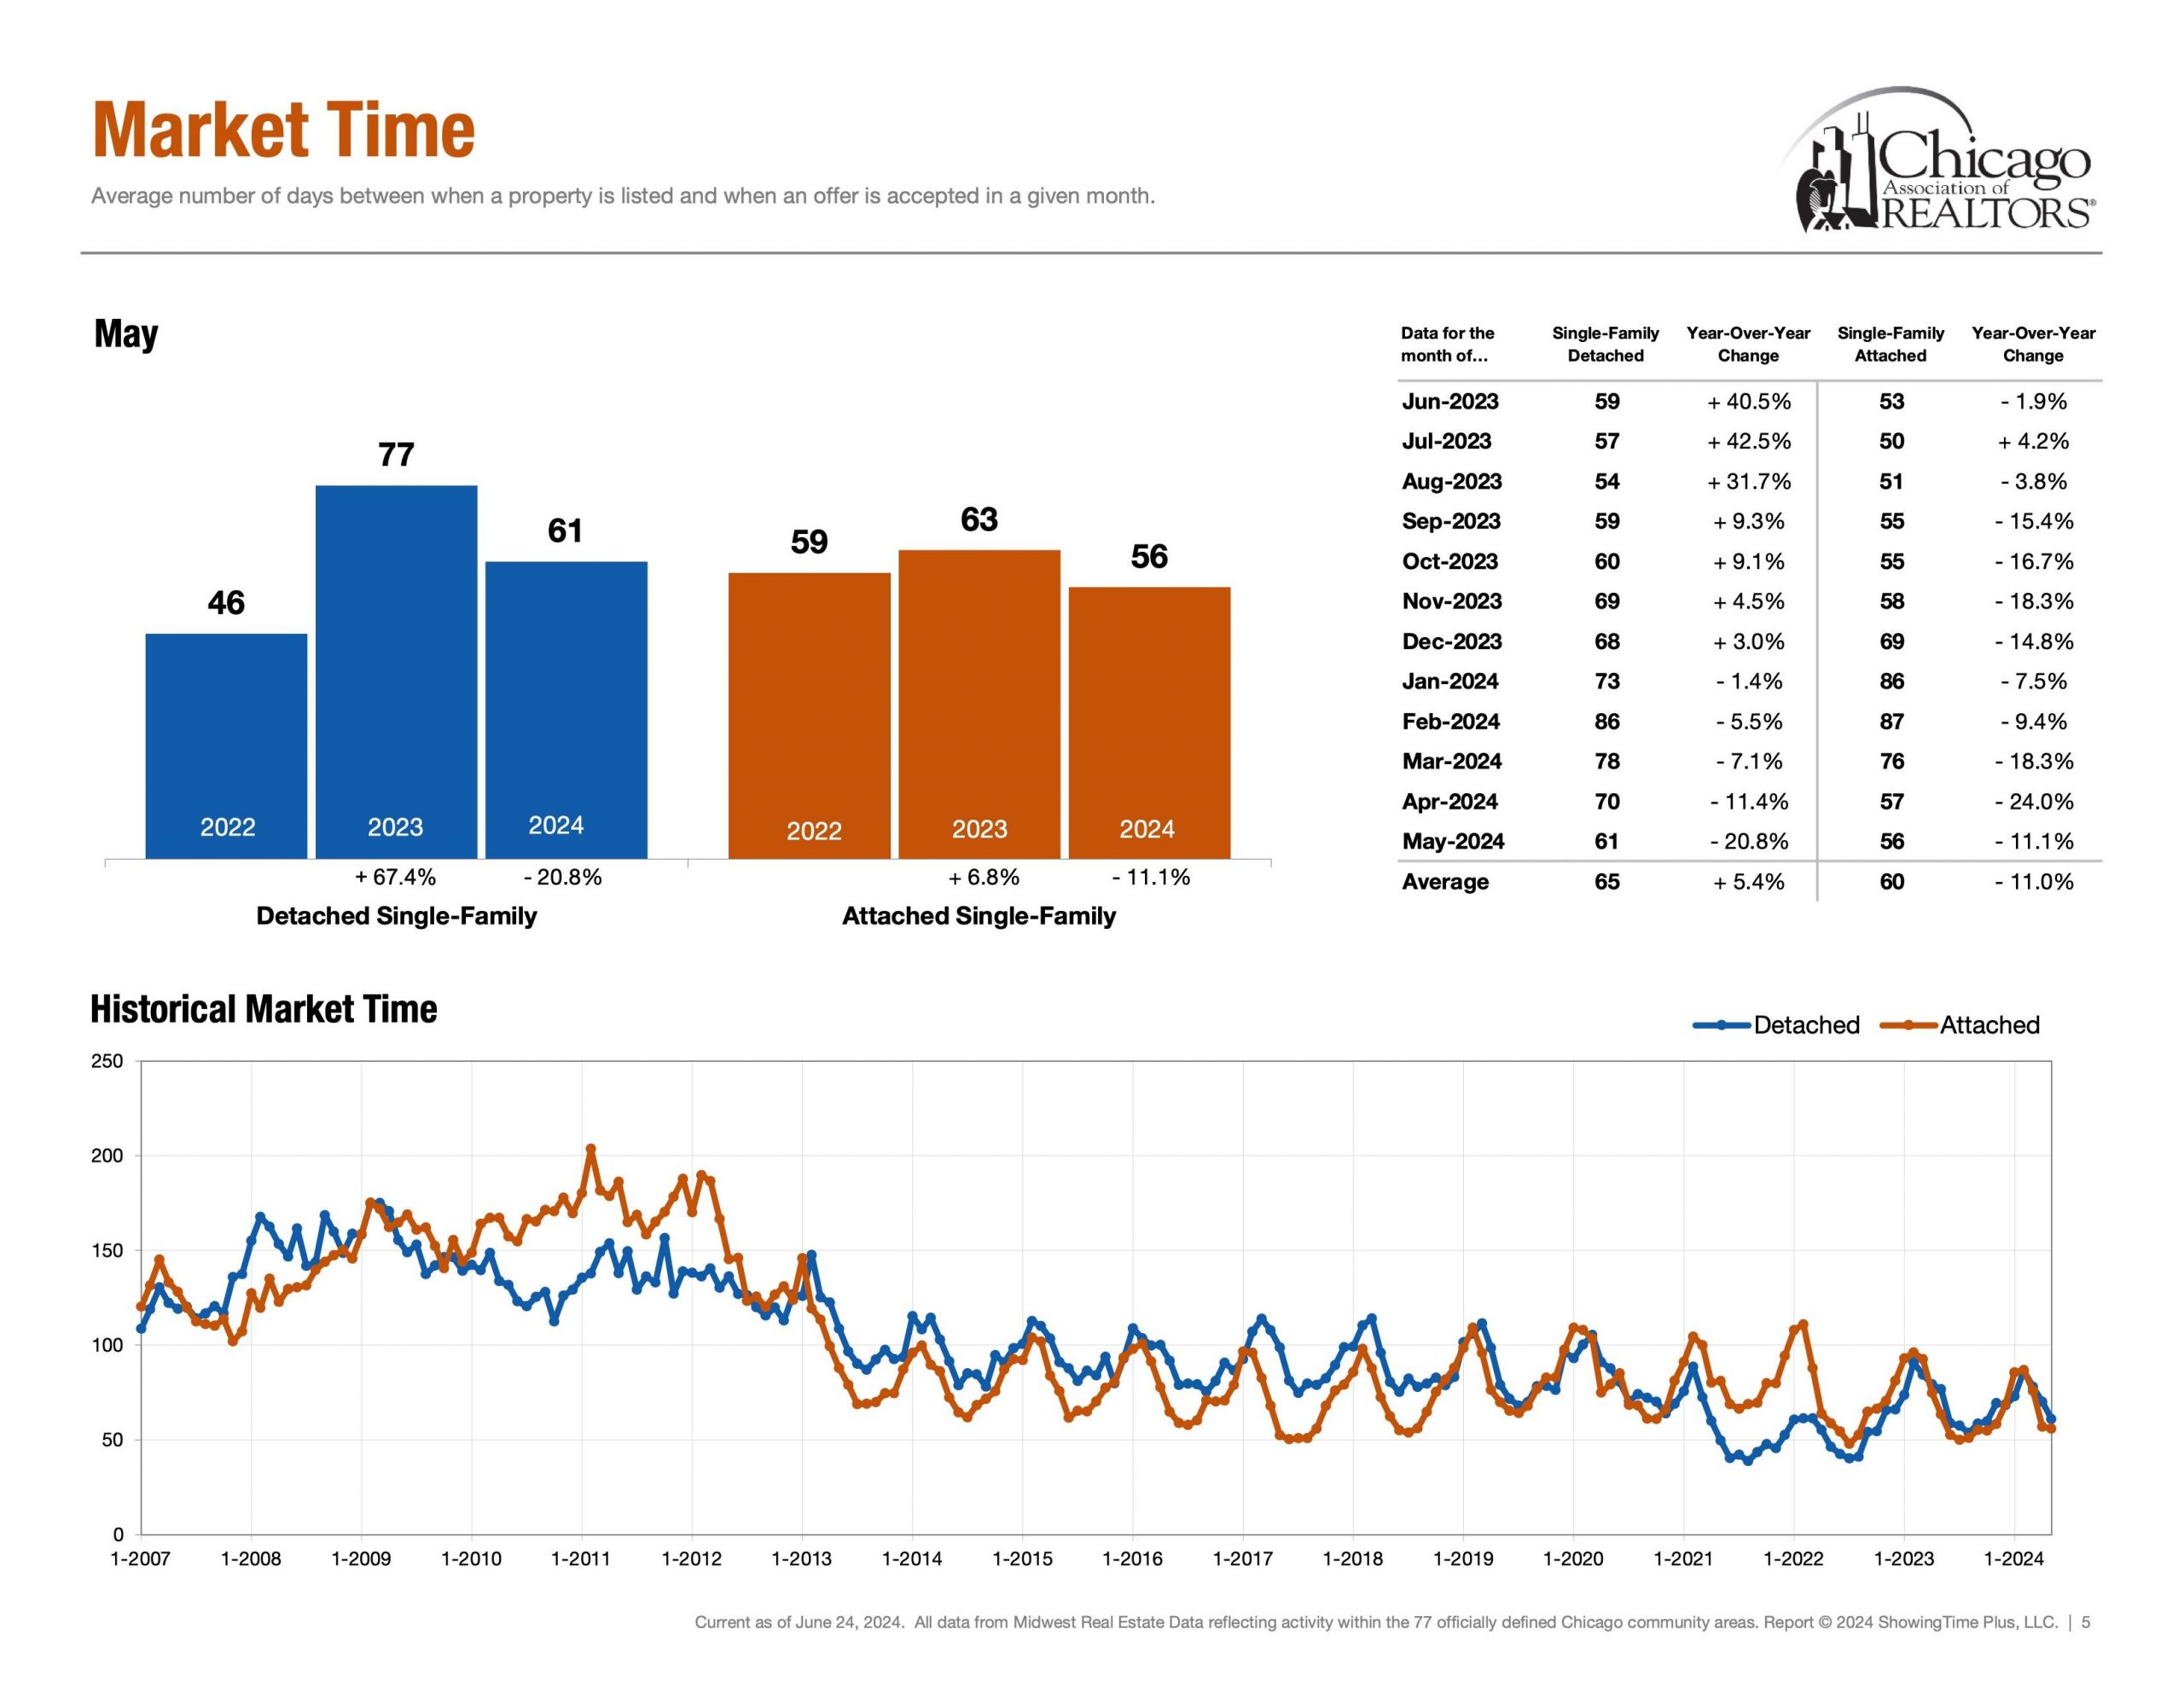
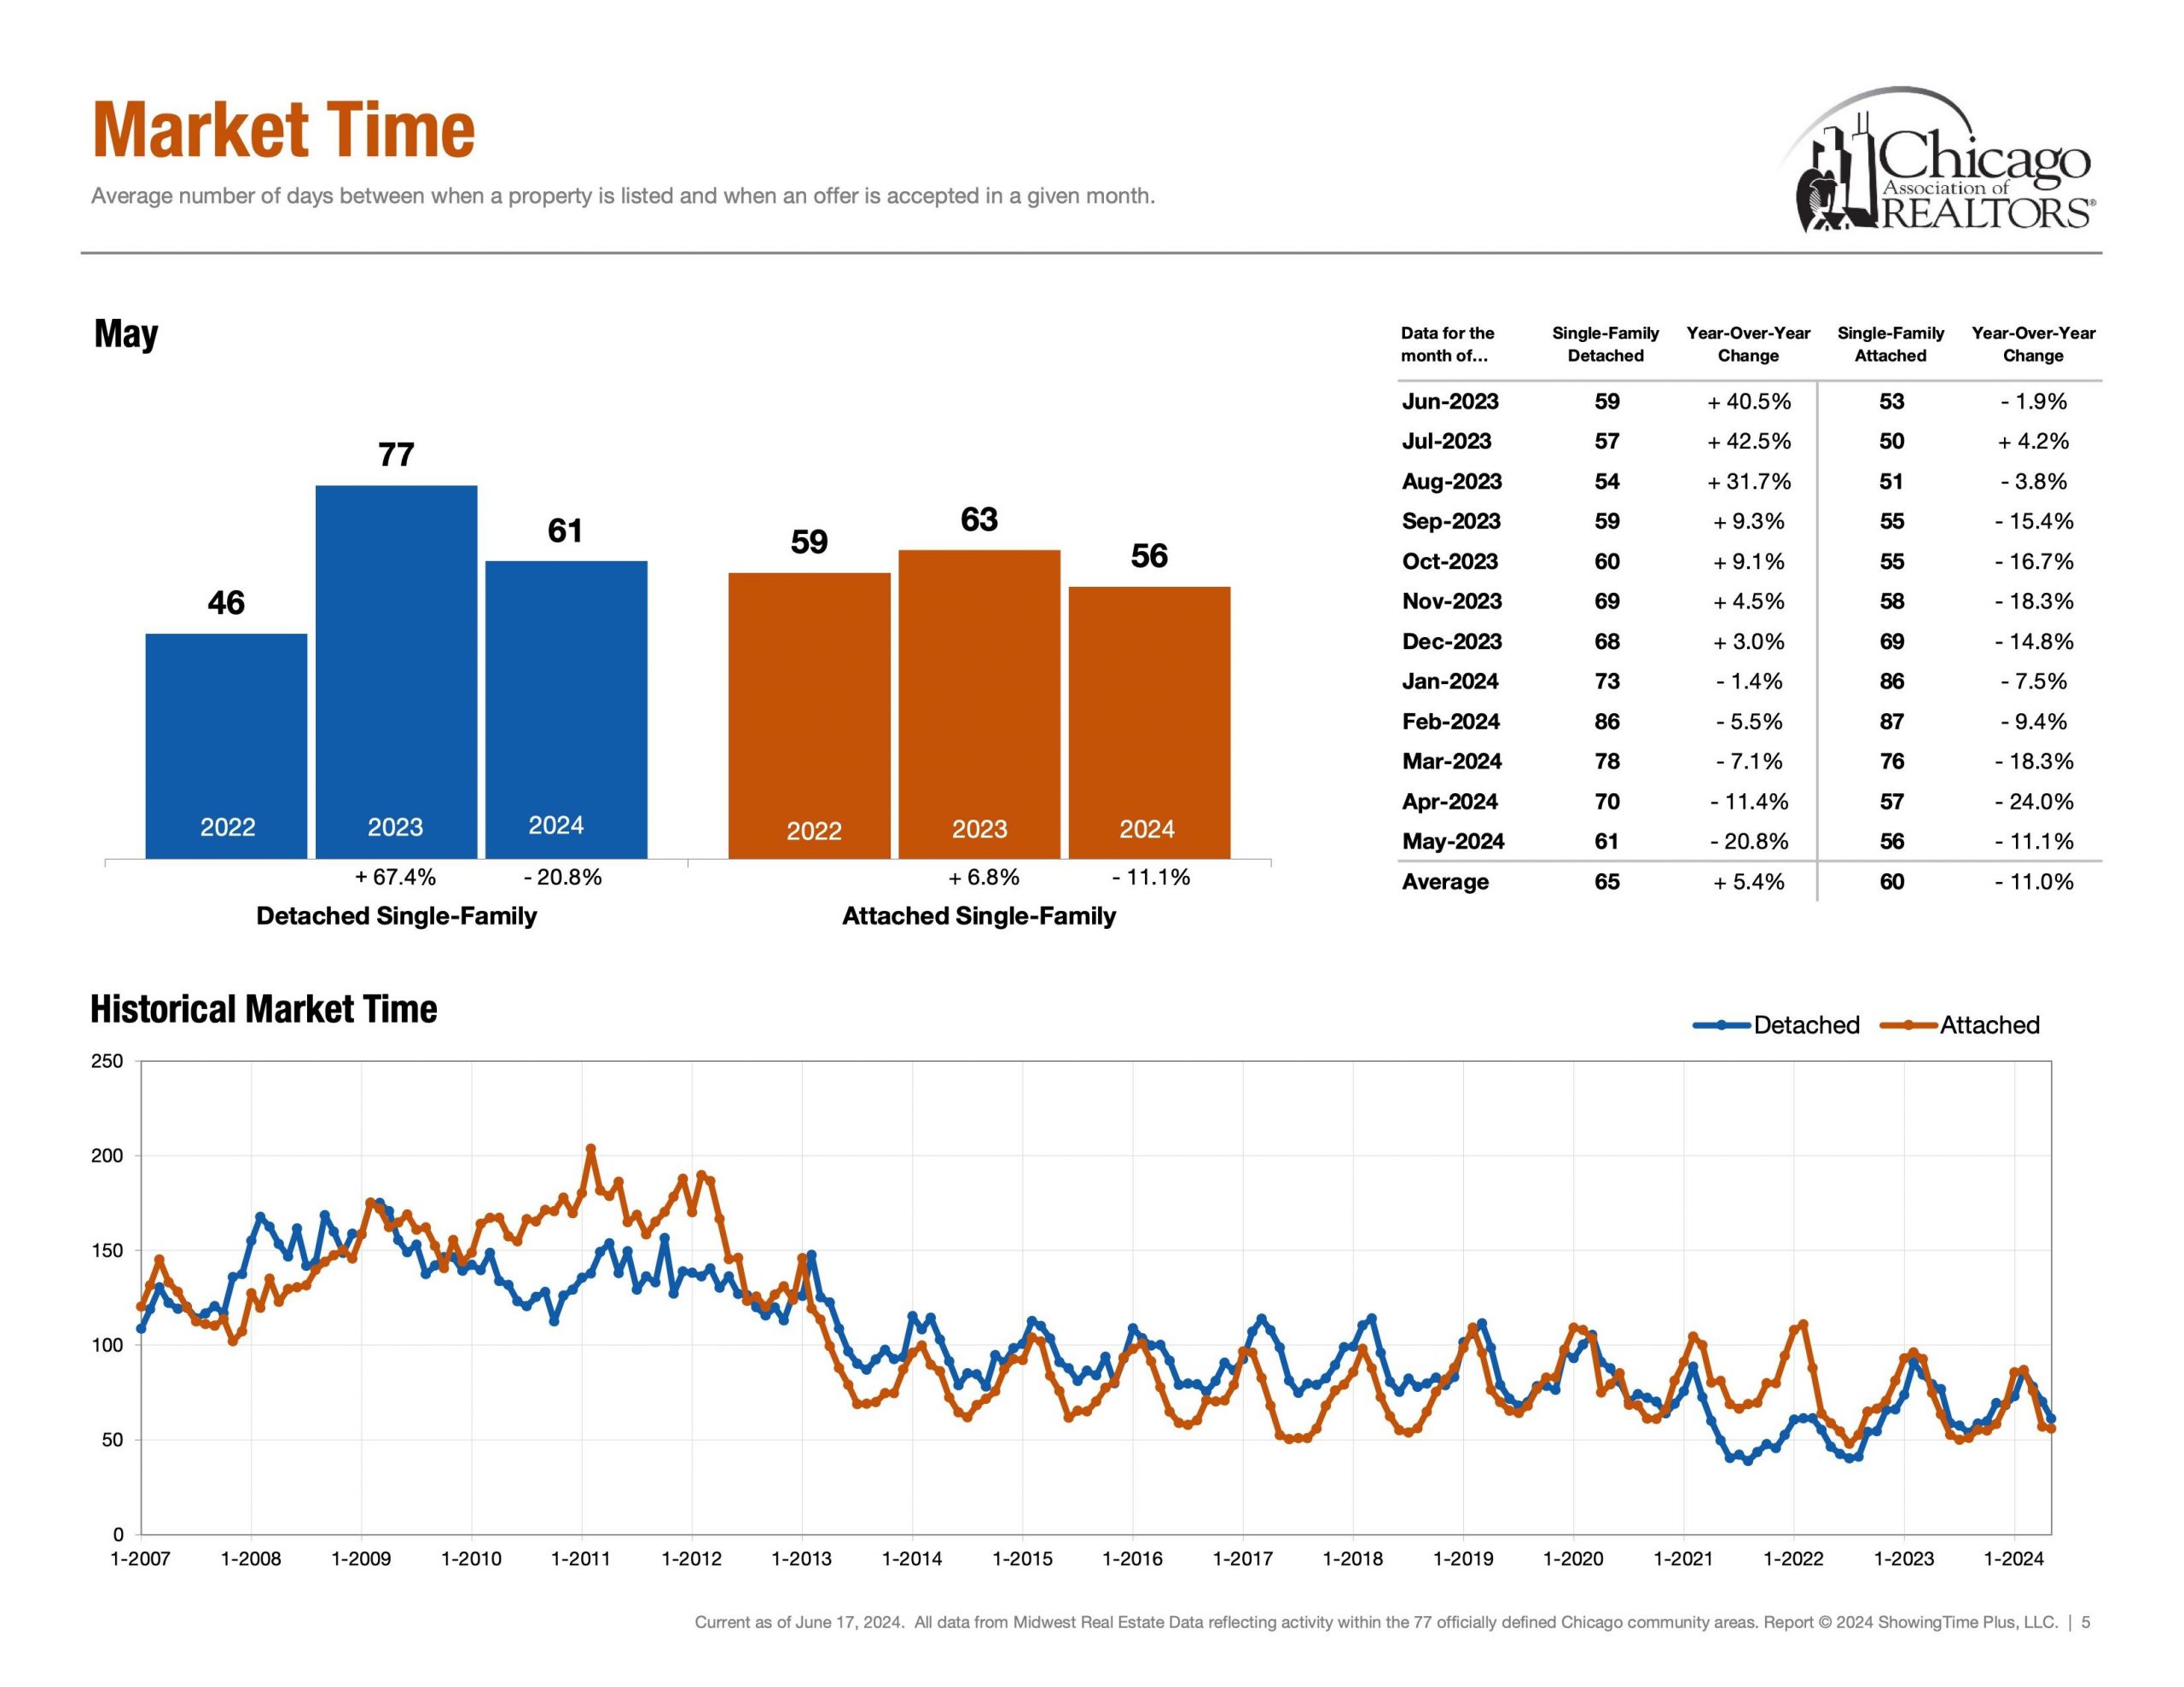
Detached Single ~ 61 Days (May 24′)

Attached Single ~ 56 Days (May 24′)


First, market time is metric that showcases speed and whether a listing was priced too low, priced properly or priced too high. If a listing surpasses average days on market, it is a check engine light that your listing maybe overpriced.


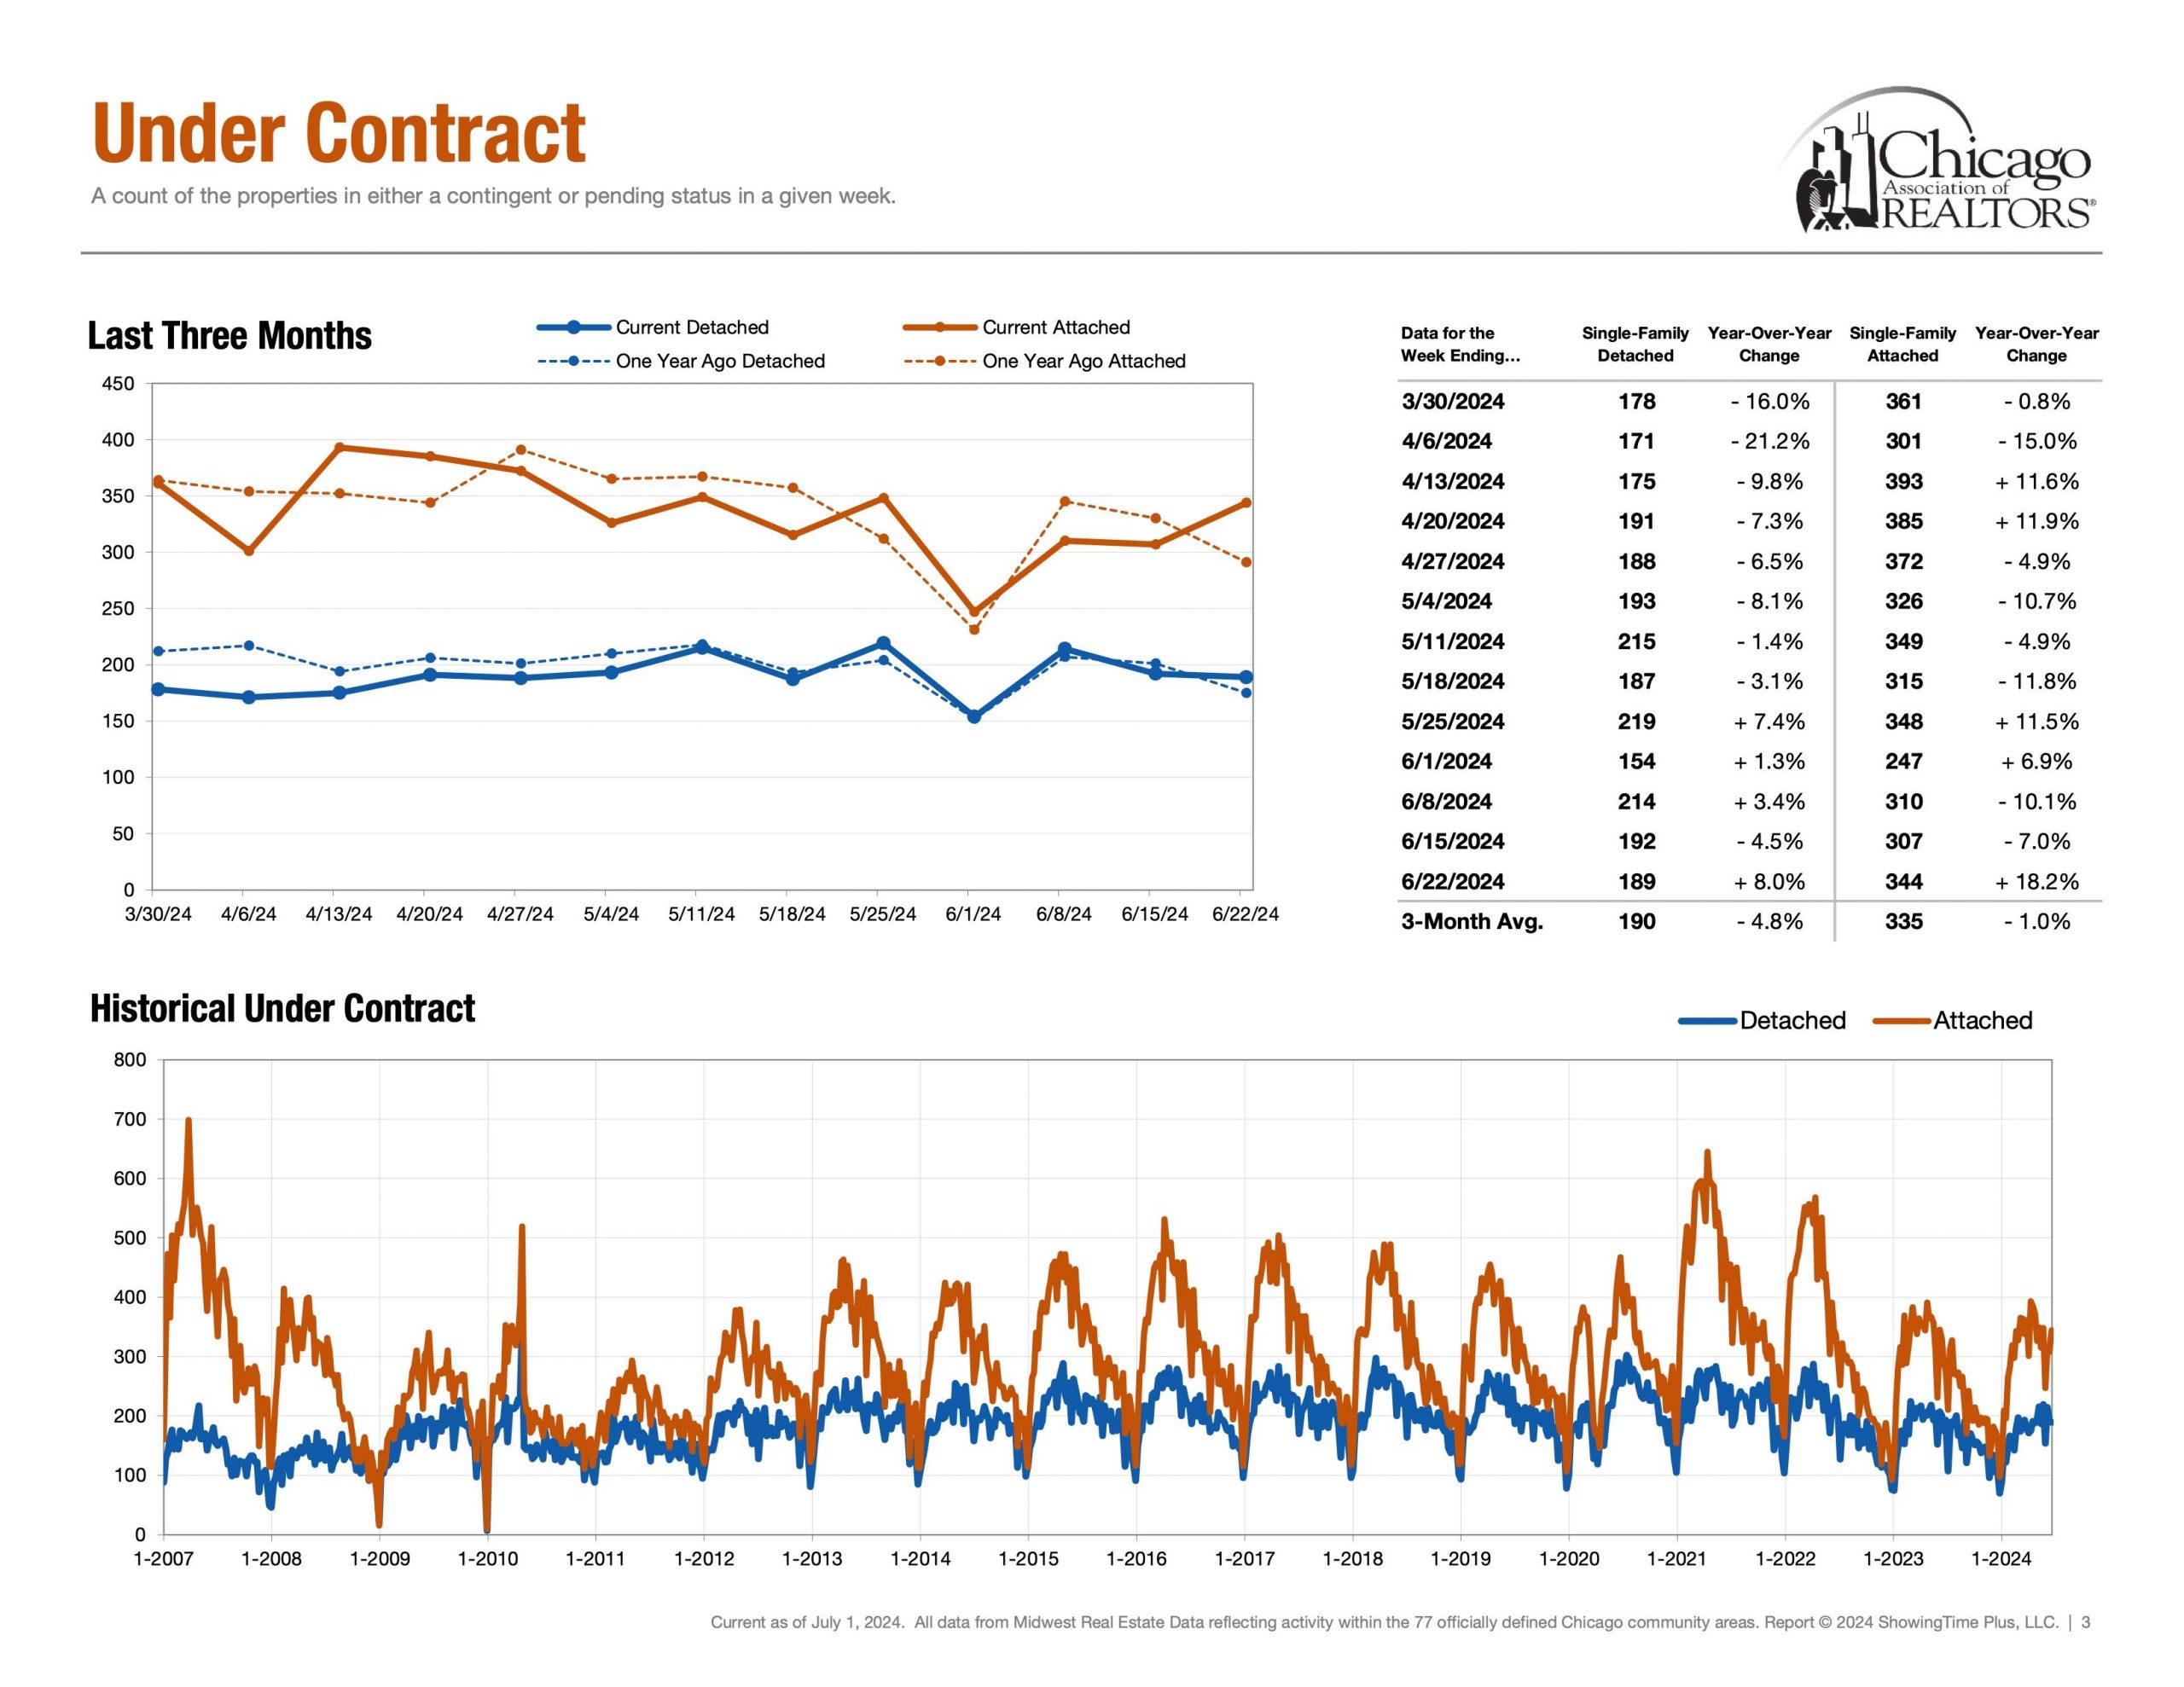
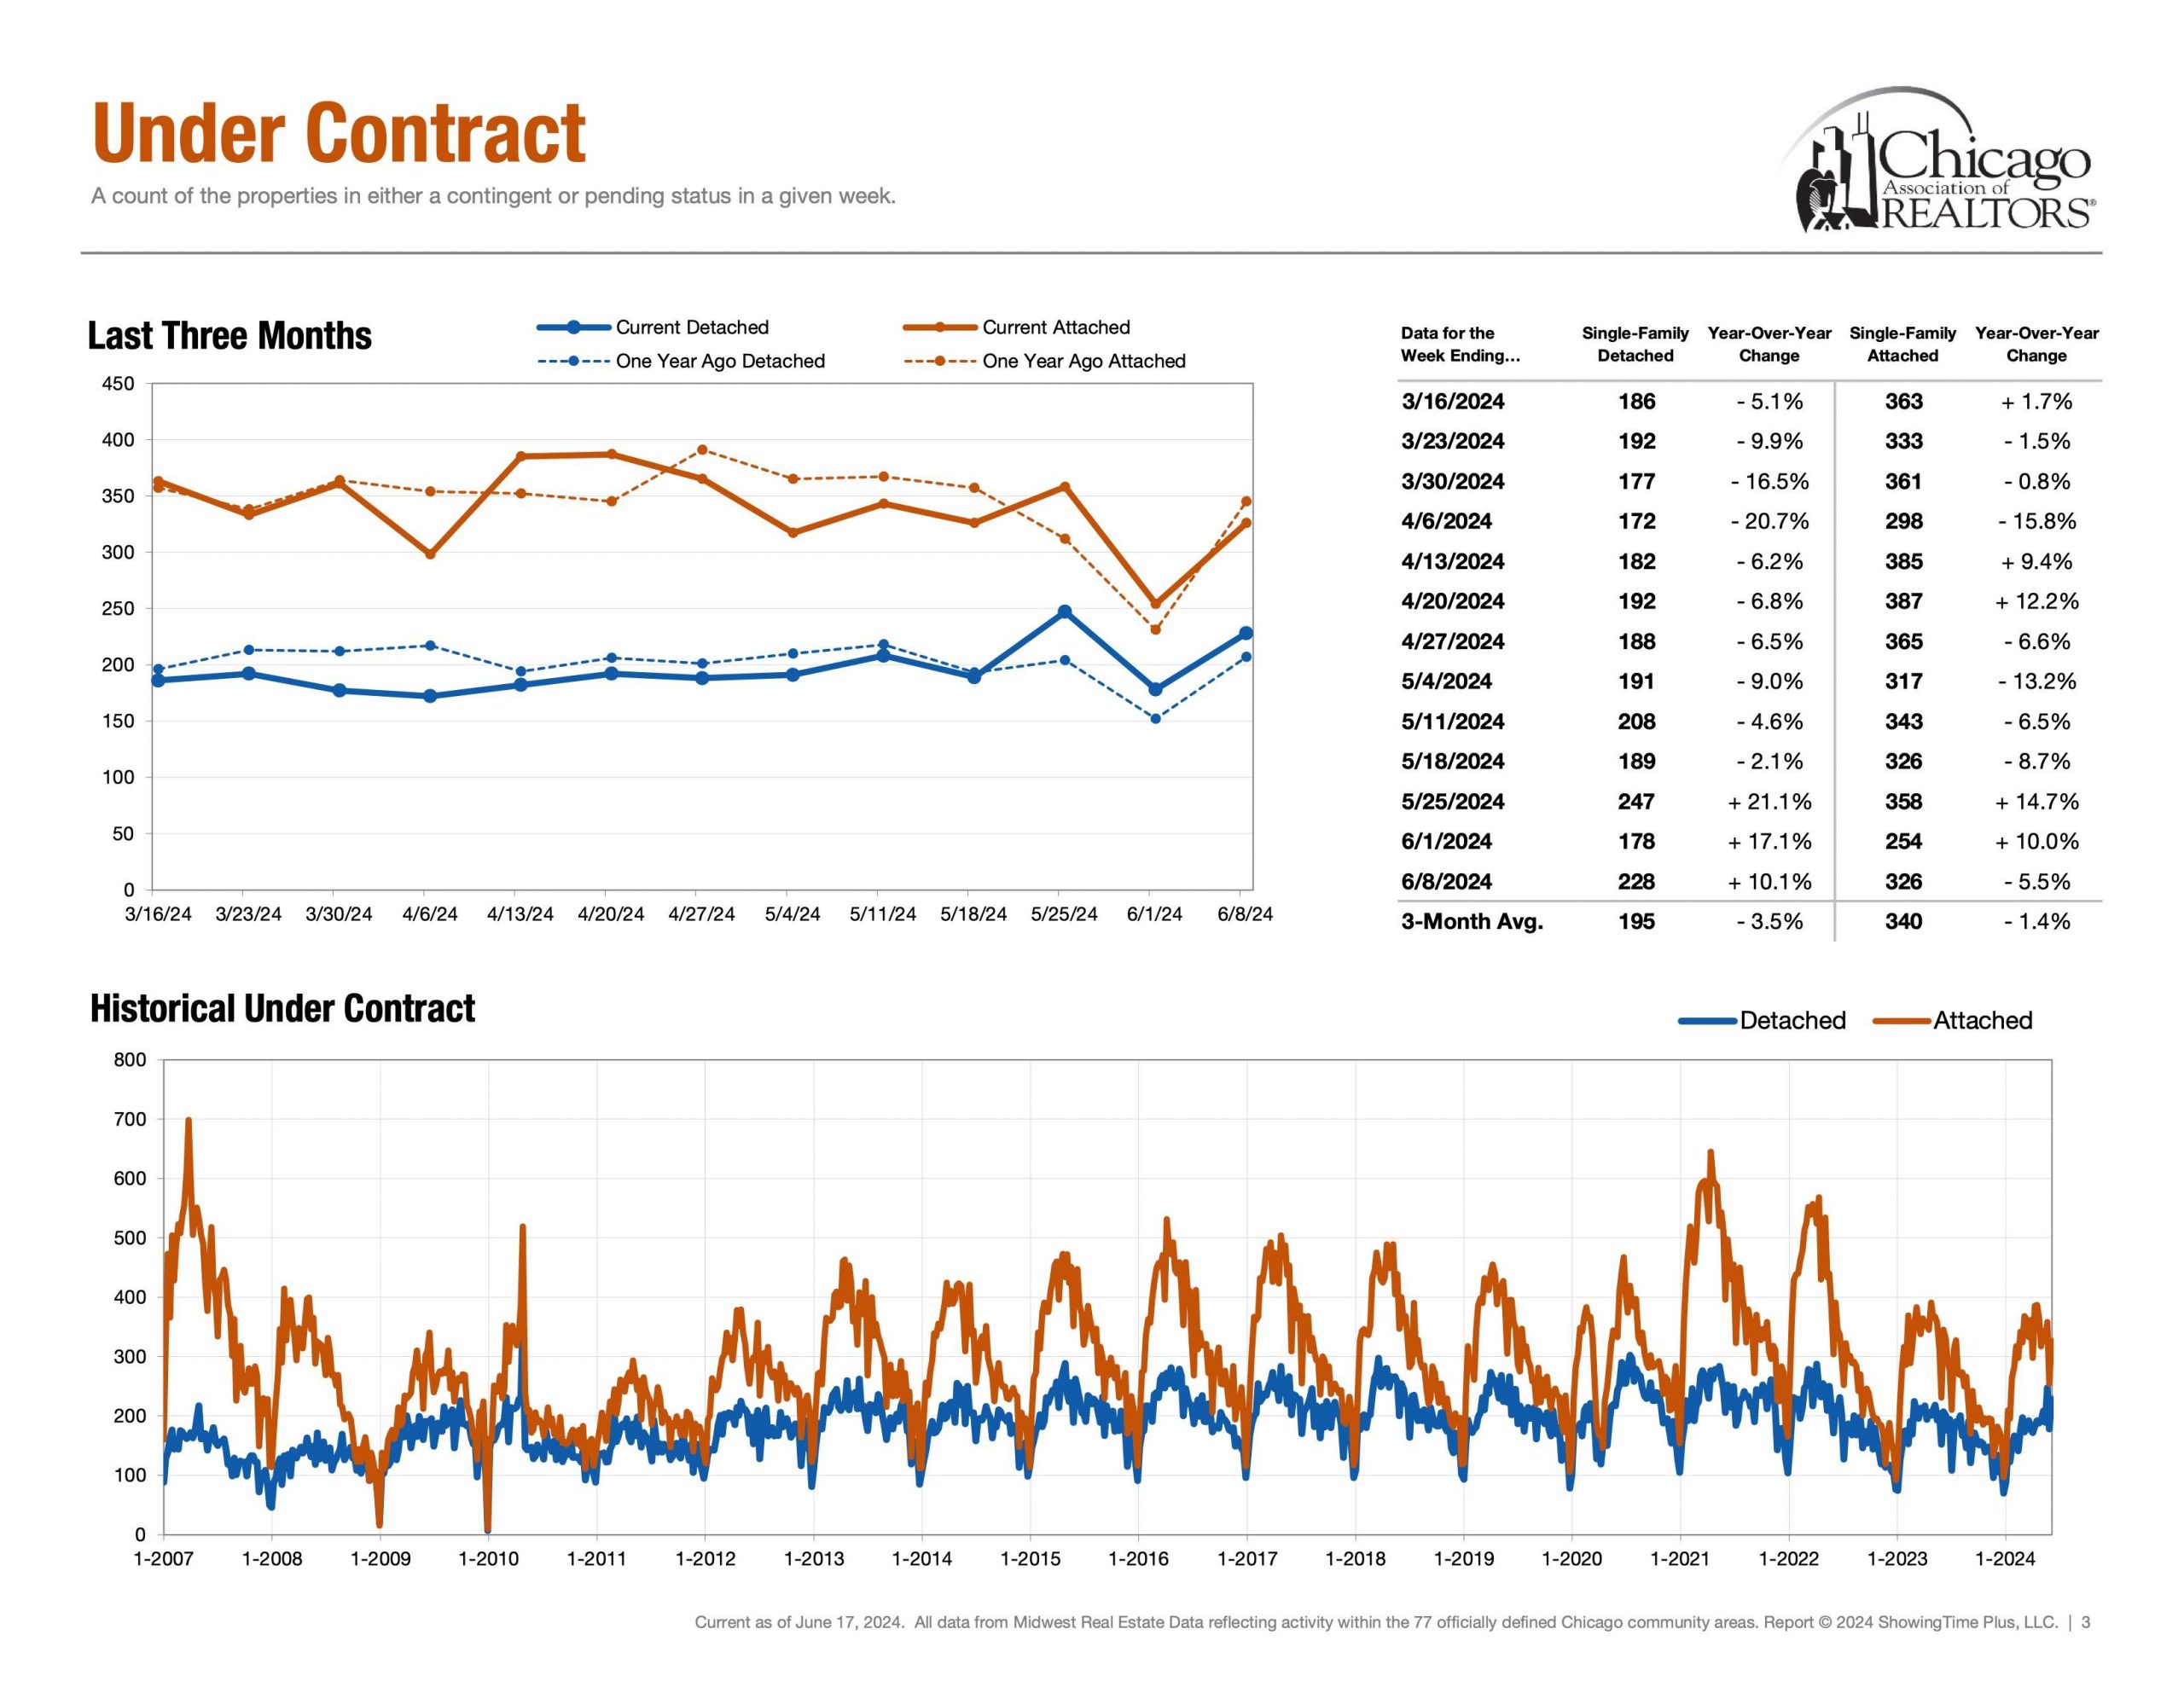
Demand | Under Contract


Detached Single = 189 Properties (June 16th – June 22nd)

Attached Single = 344 Properties (June 16th – June 22nd)

Secondly, under contract helps answer the question, “In our current market, how many buyers are buying?” Showcasing the heartbeat of the real estate market. Interestingly, demand metrics become more insightful when compared and contrasted with supply/inventory metrics.


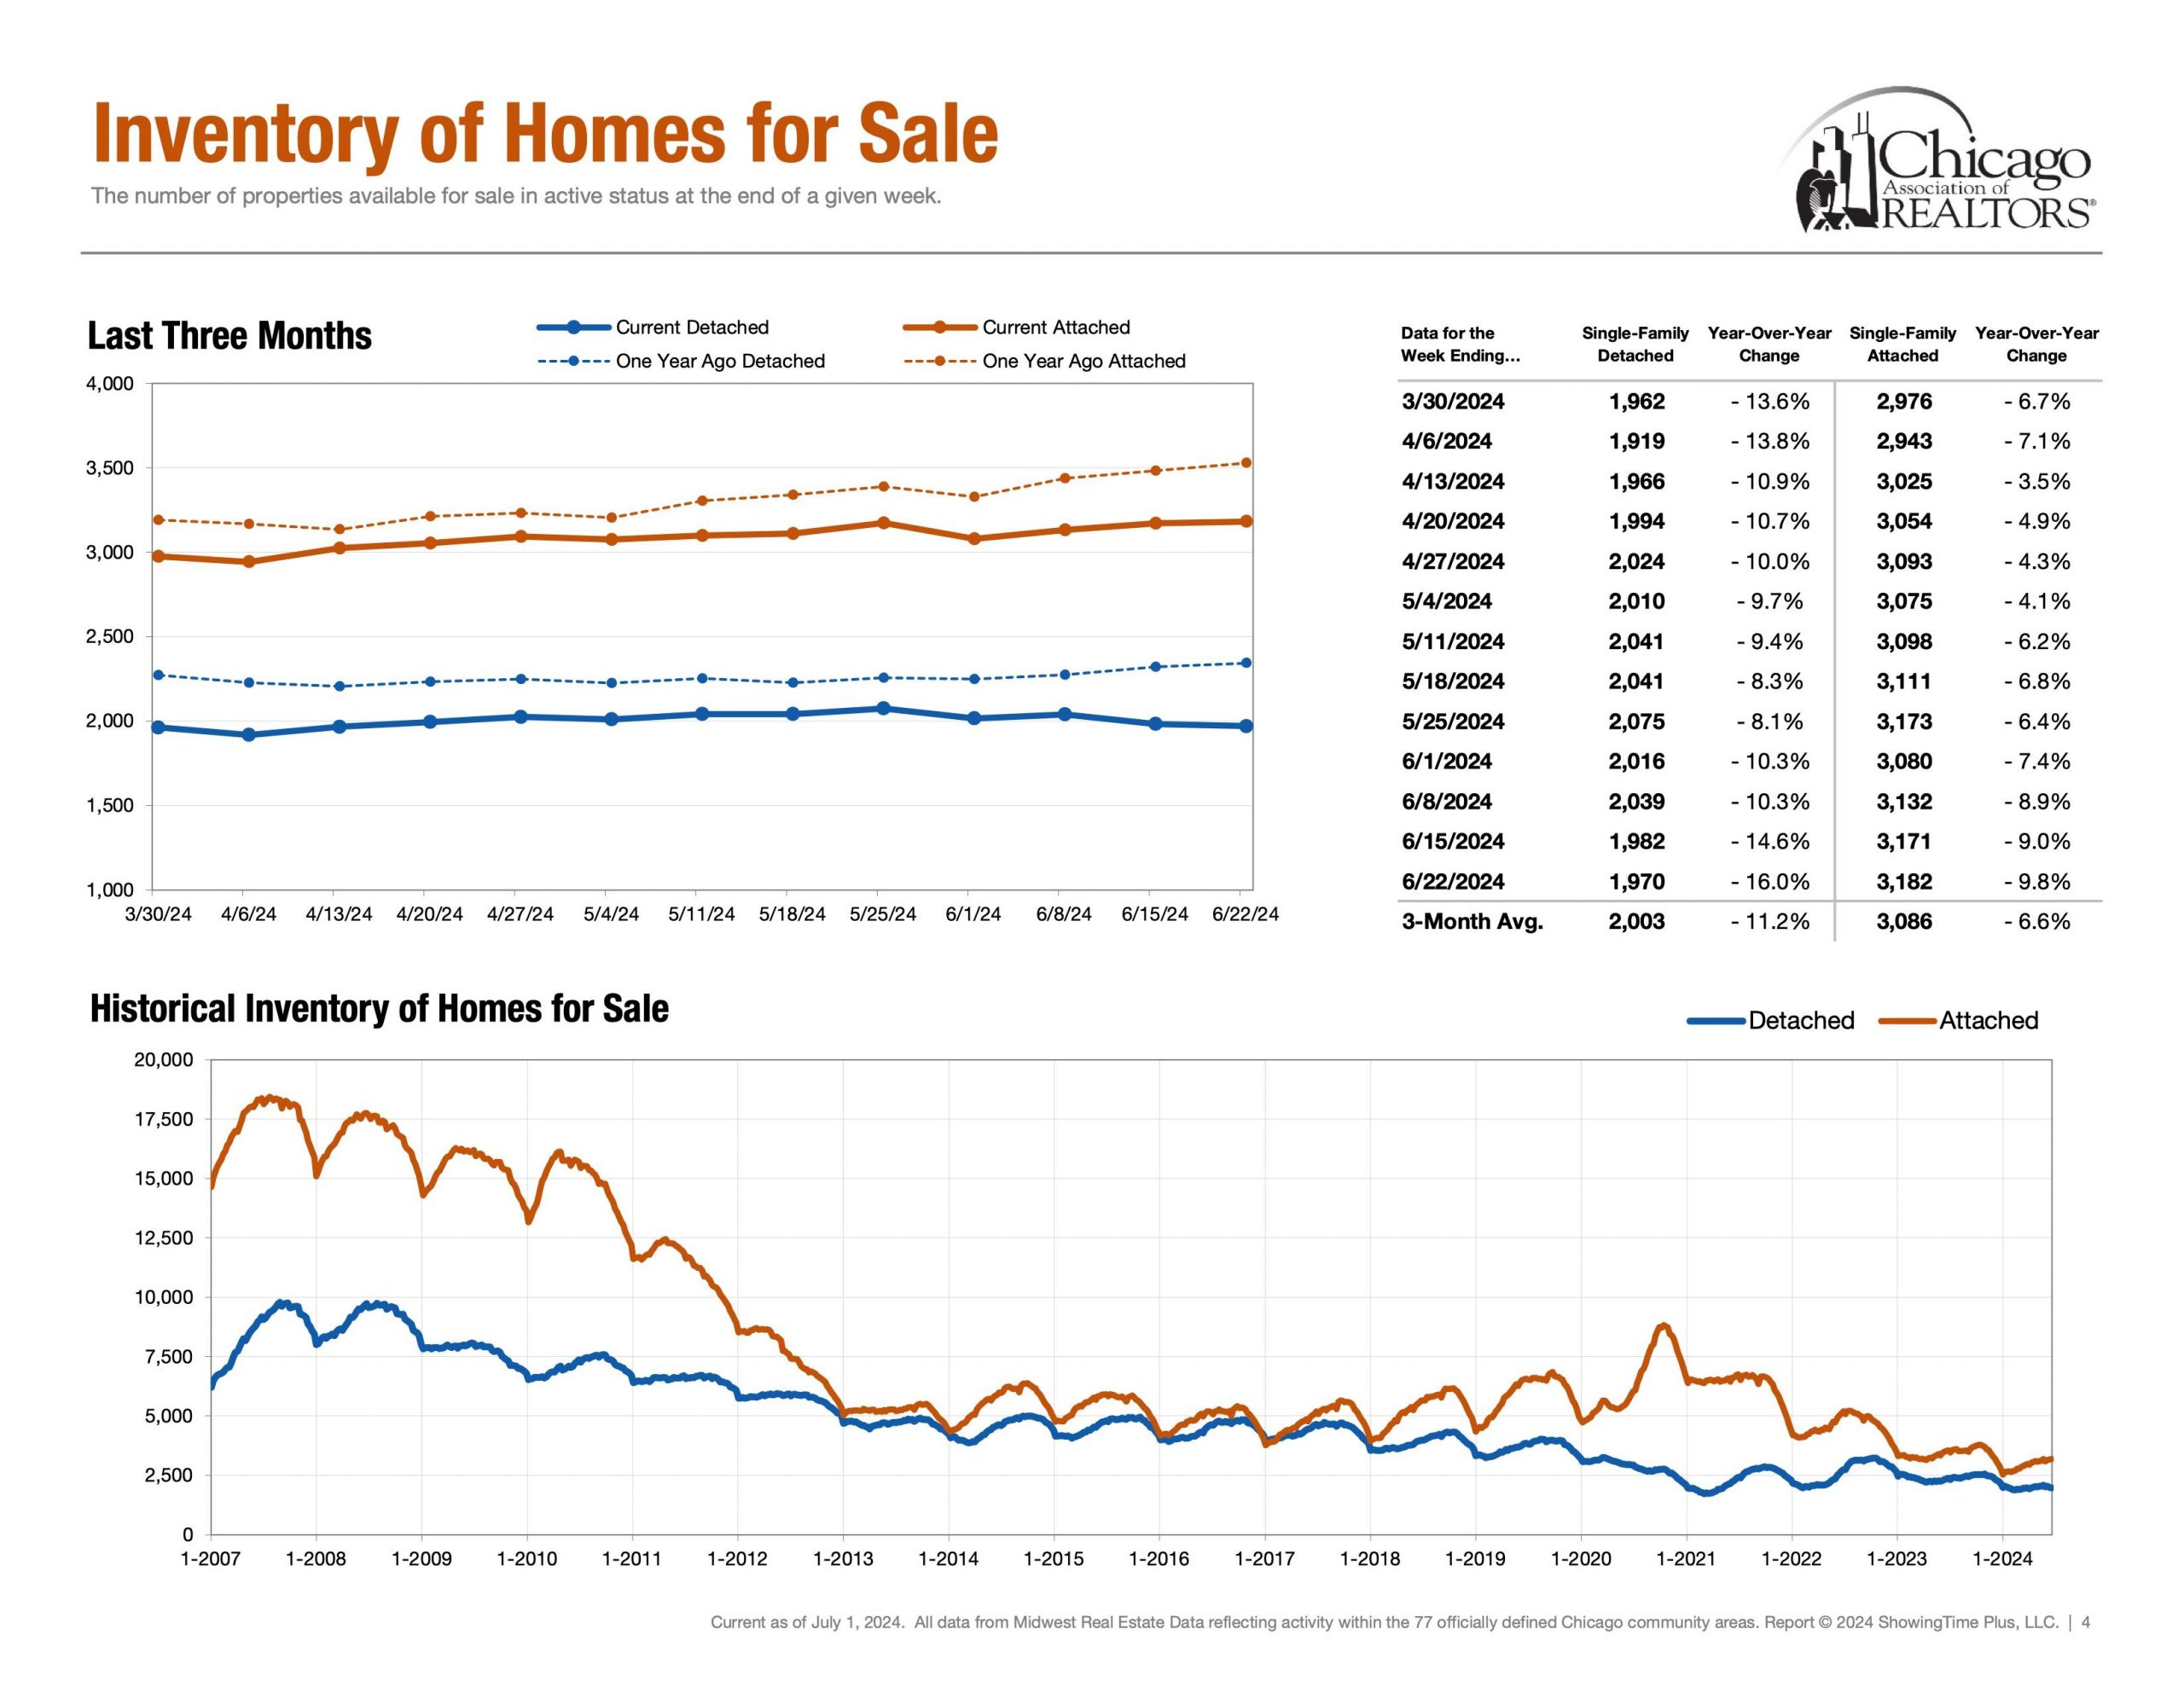
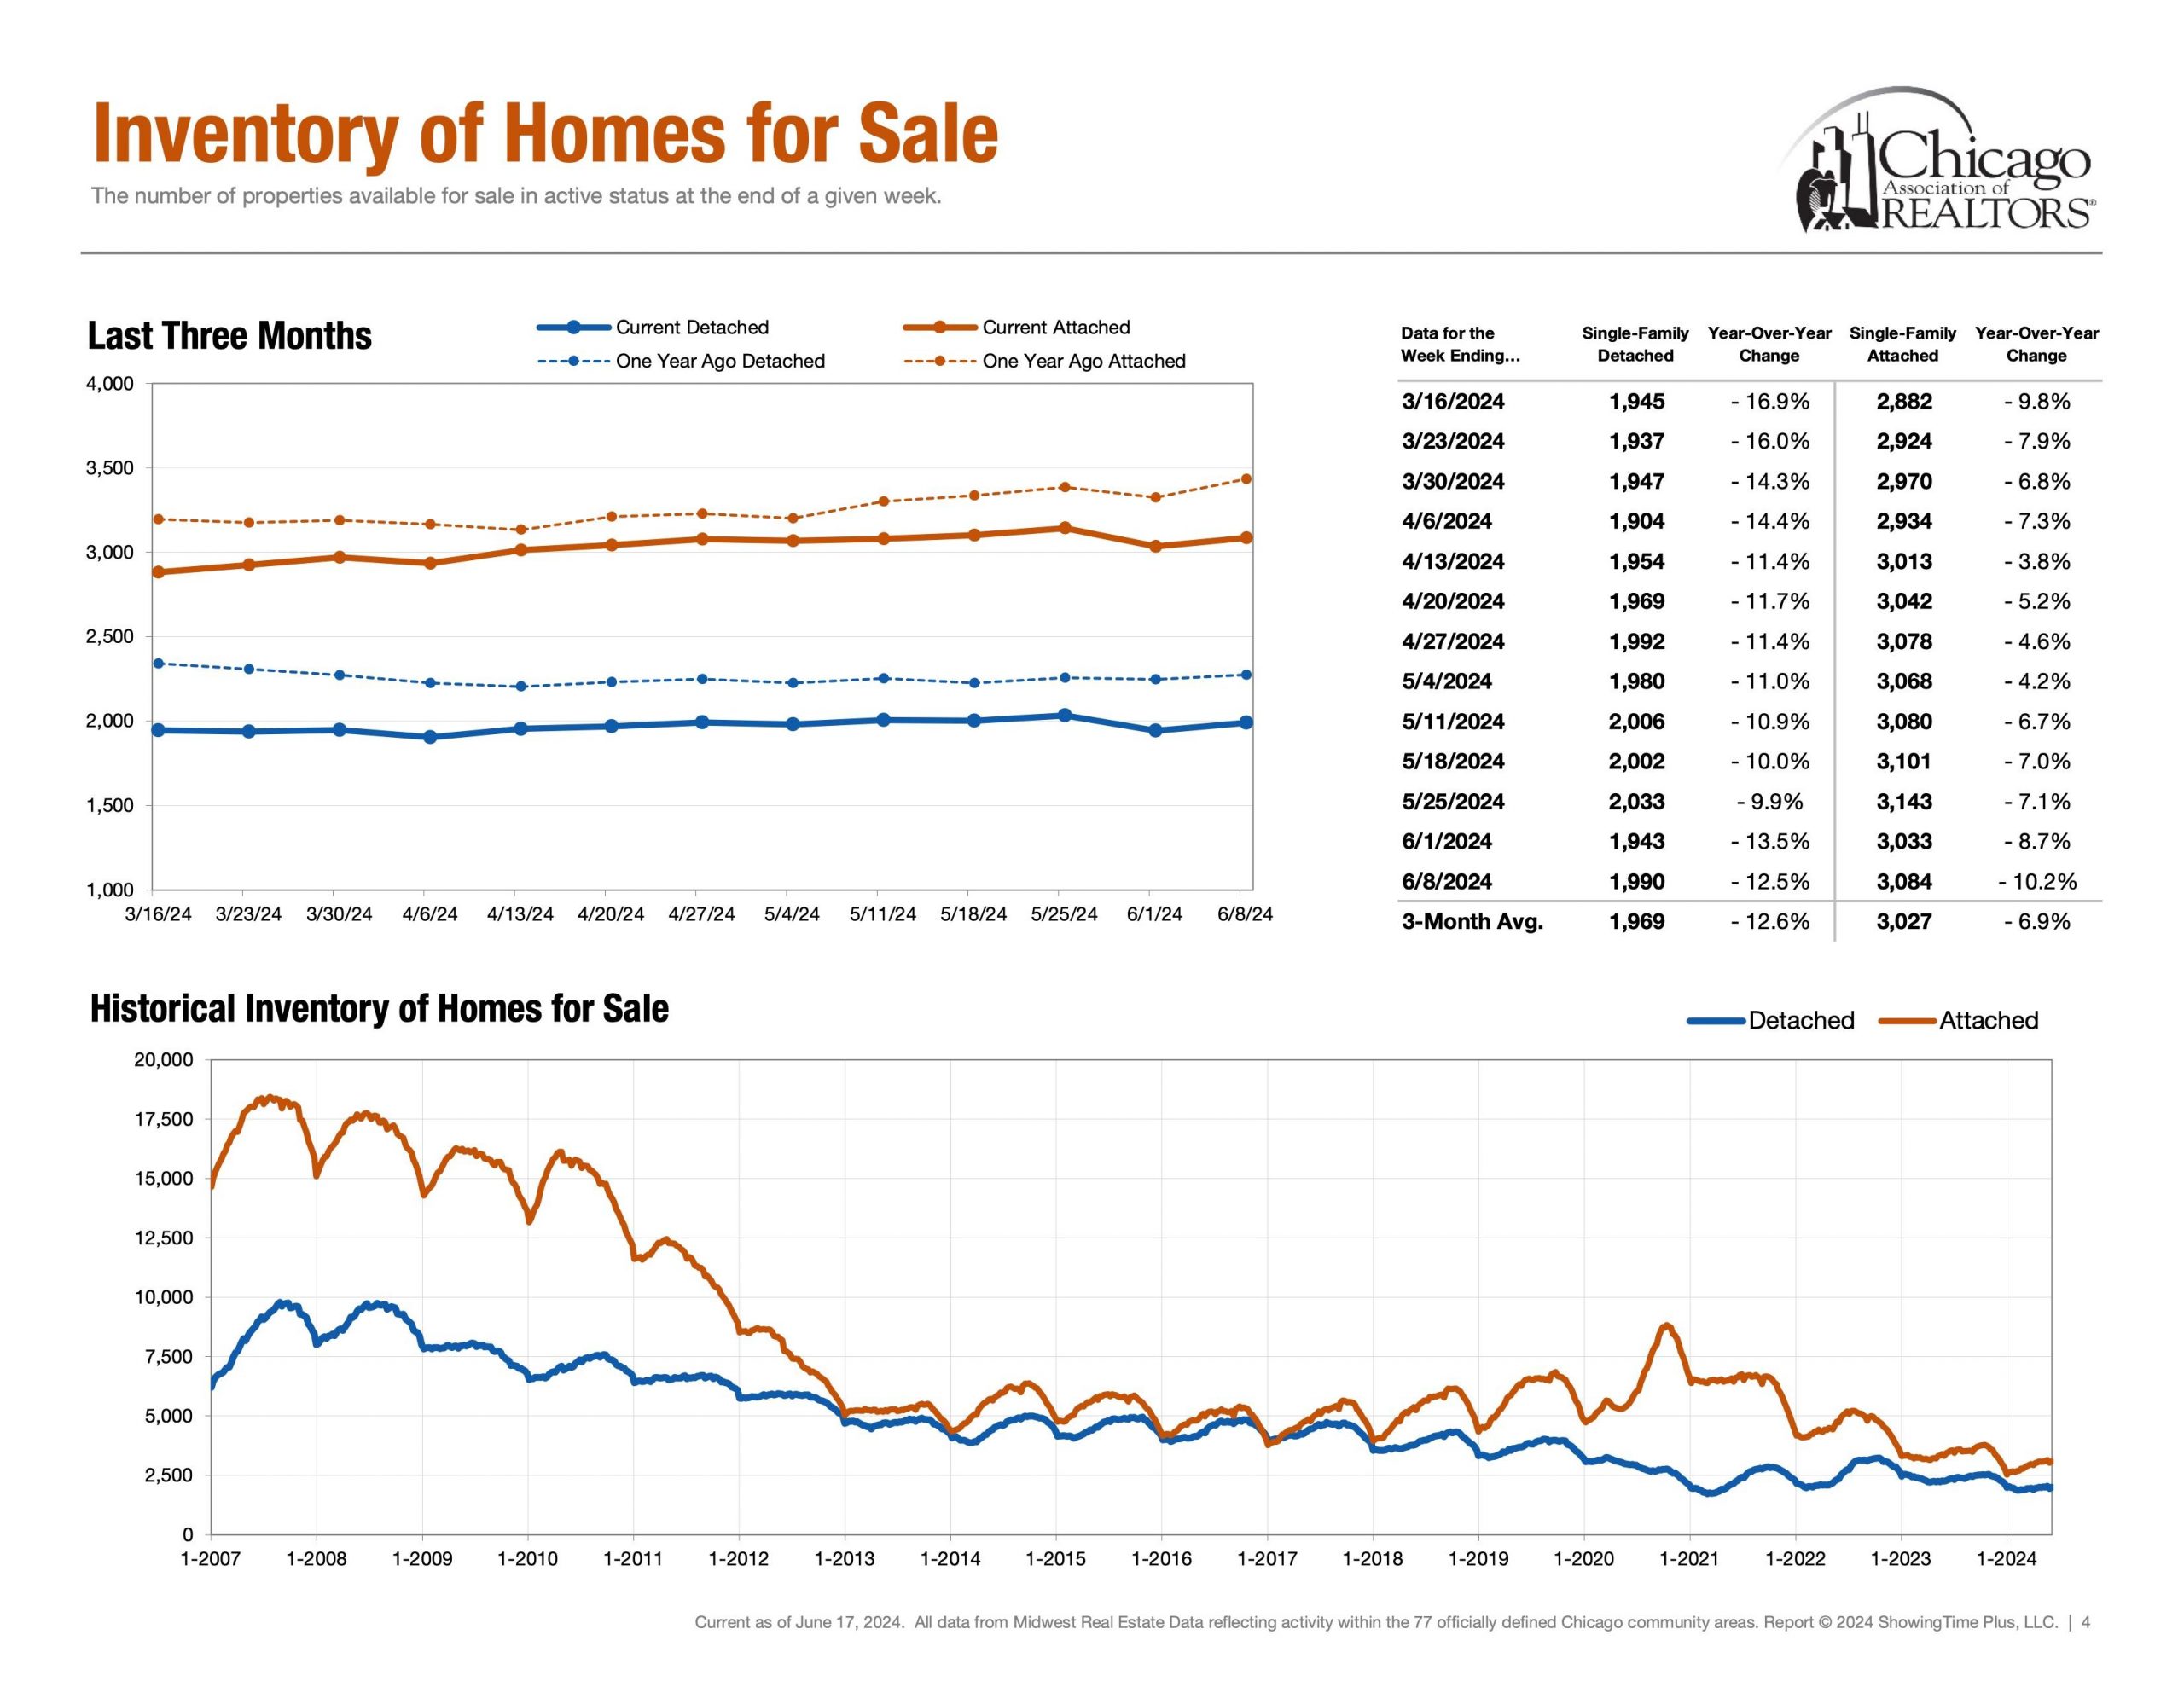
Supply | Inventory of Homes for Sale


Detached Single = 1,970 Properties (June 16th – June 22nd)

Attached Single = 3,182 Properties (June 16th – June 22nd)

Next, supply showcases how much inventory is available for buyers and how much competition sellers are up against. Additionally, Months of Inventory, Homes for Sale, New Listings and Absorption Rate are also other key metrics in the conversation of supply.


Negotiations | Percentage of Original List Price Received


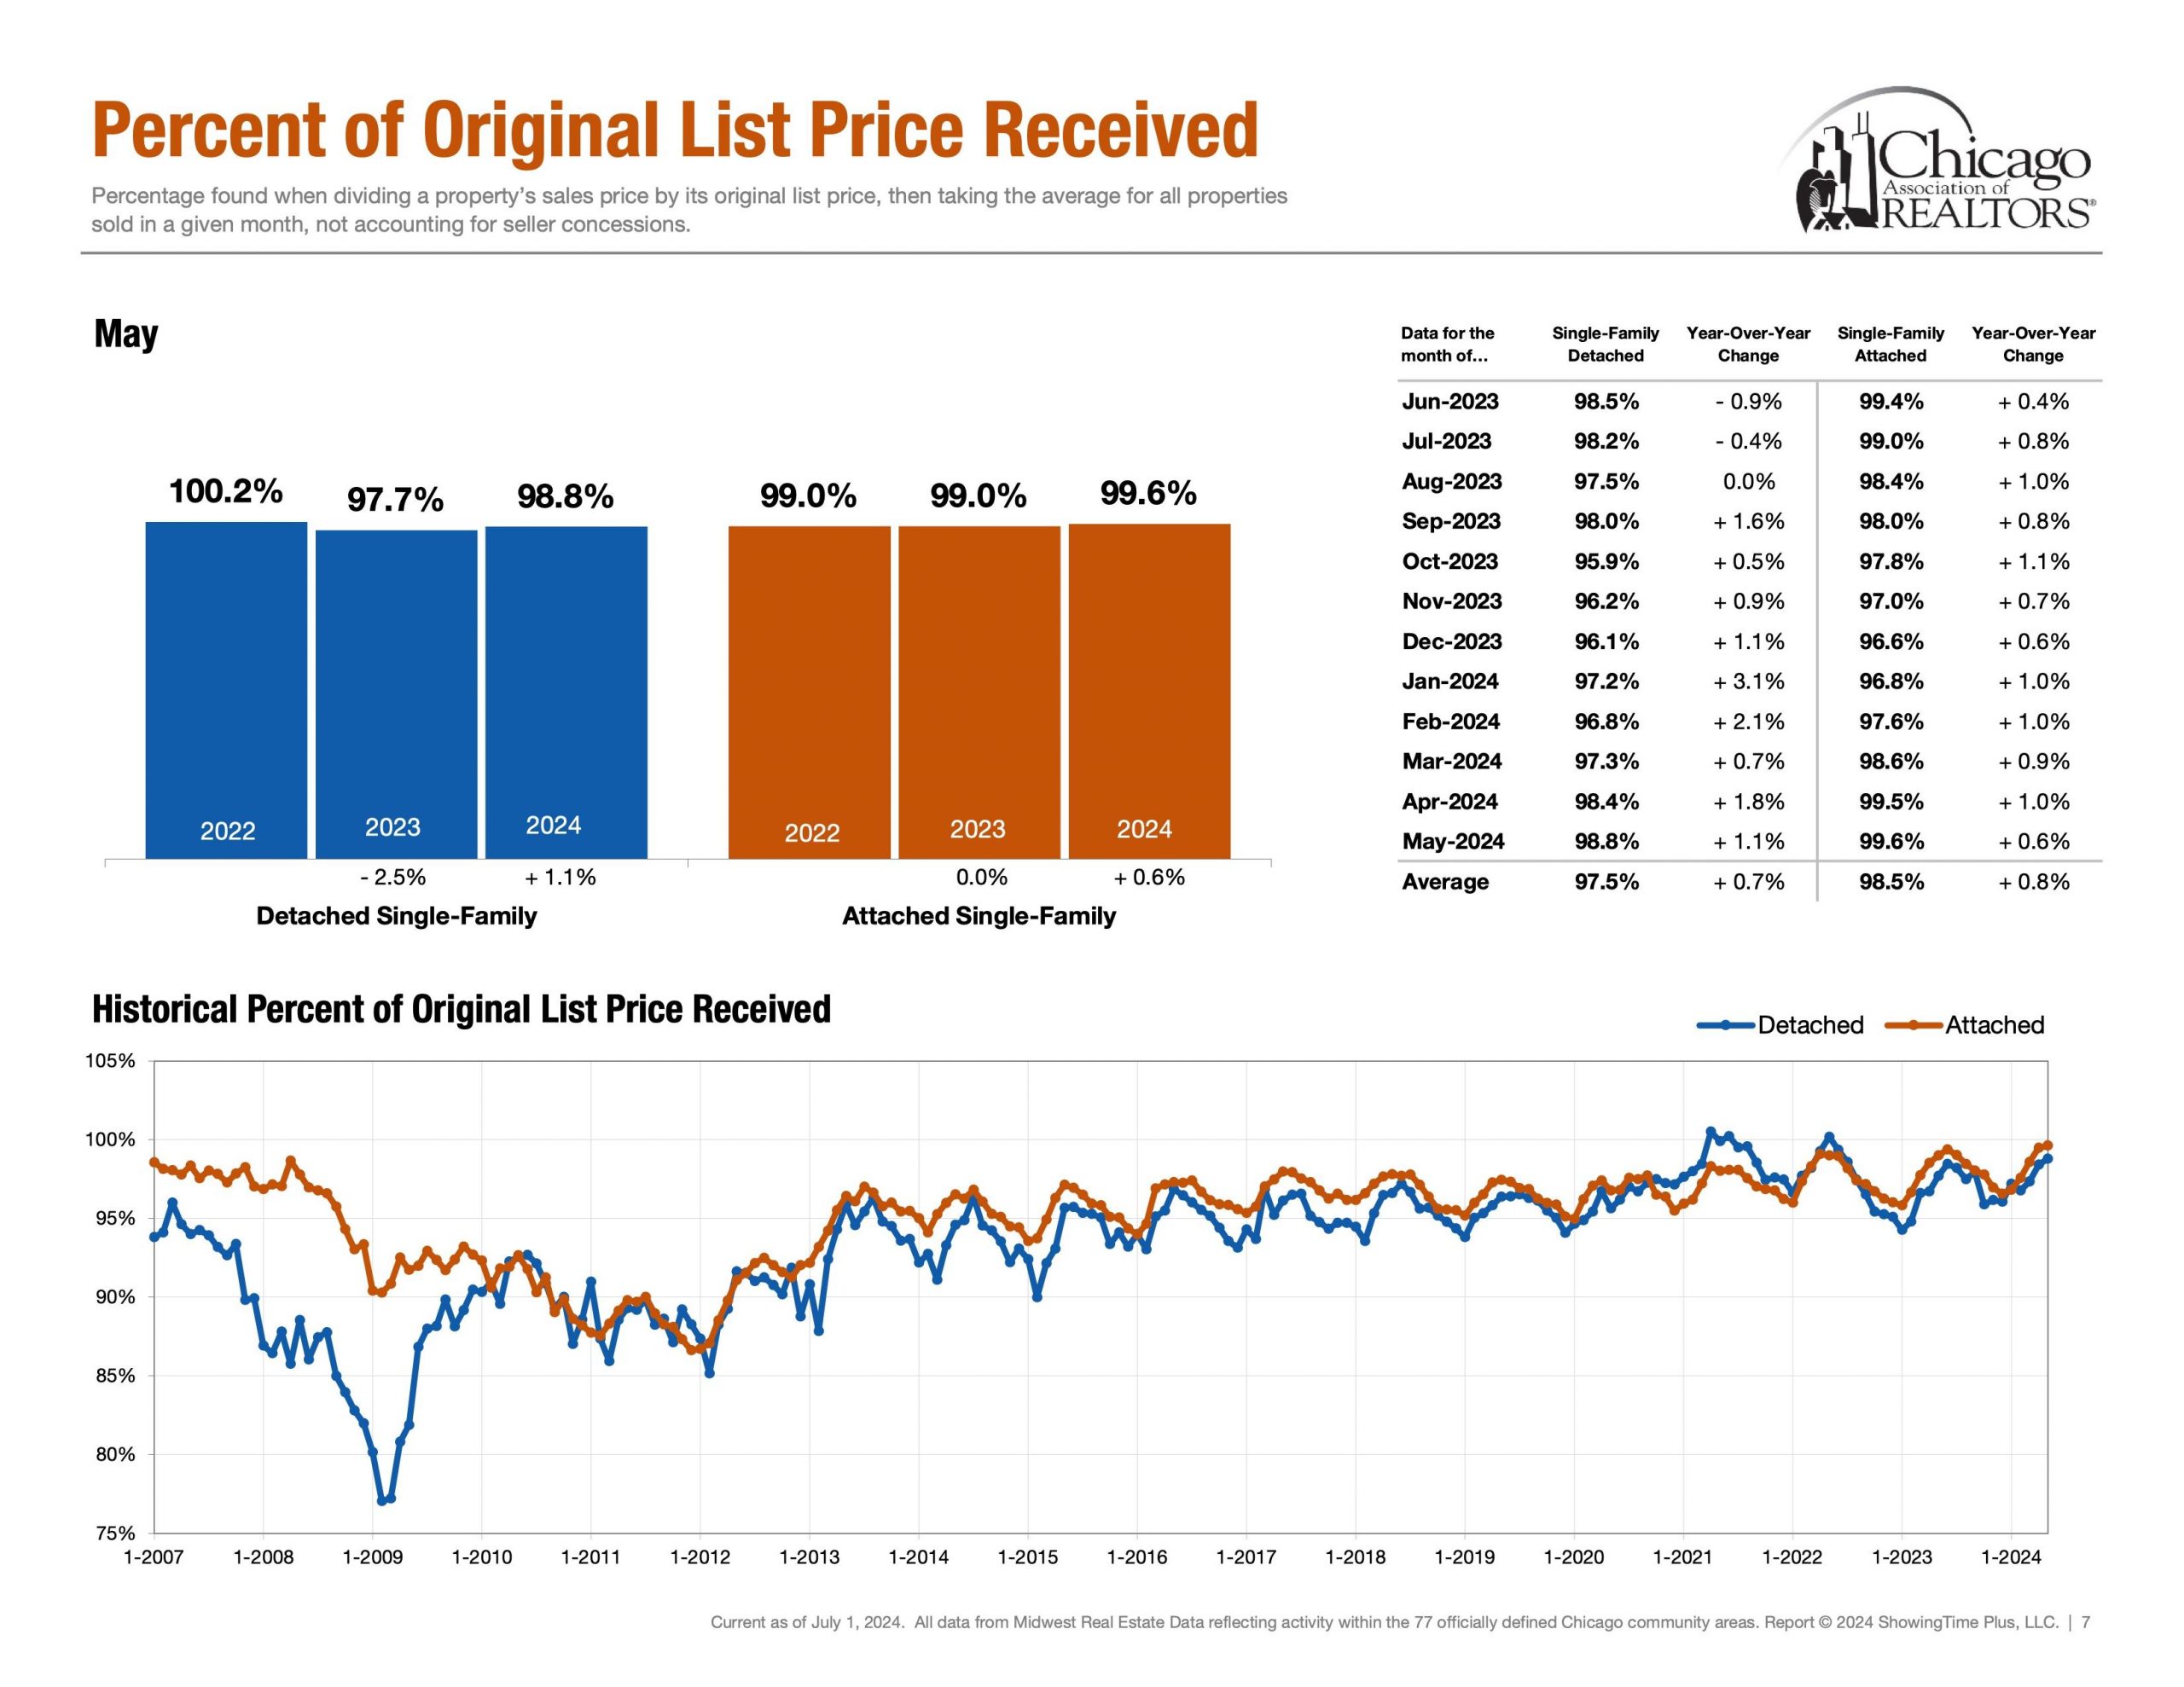
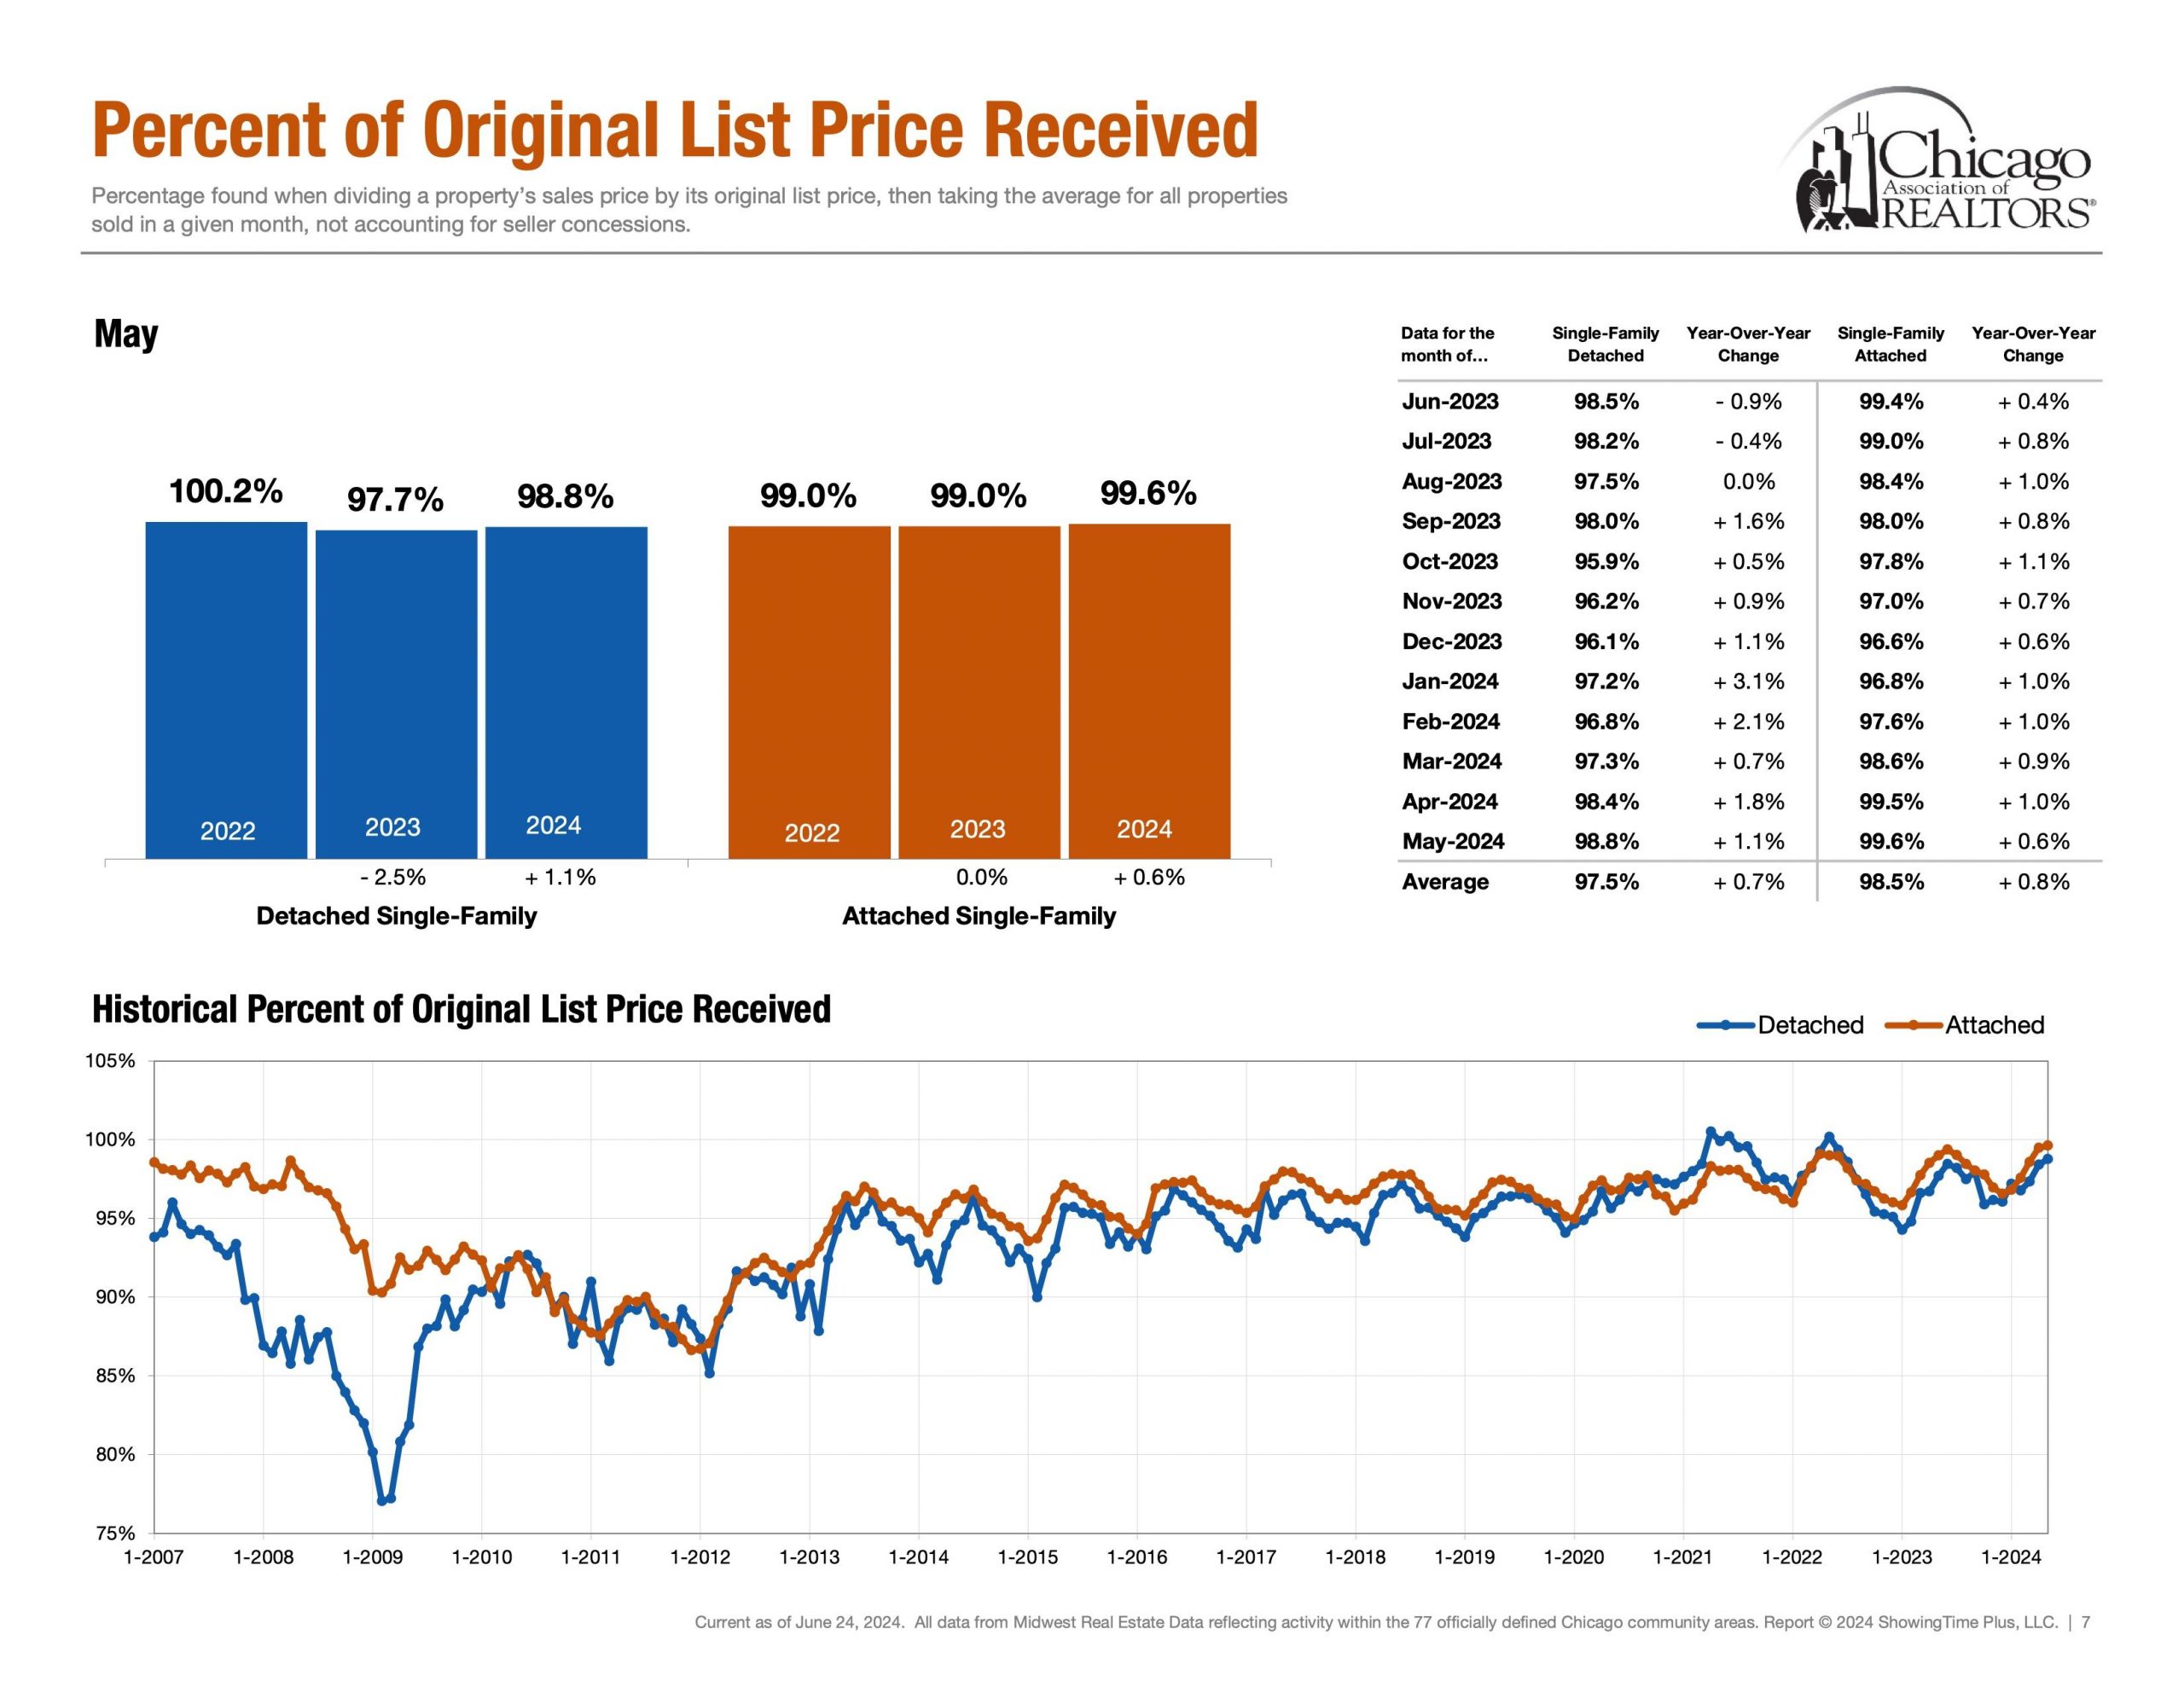
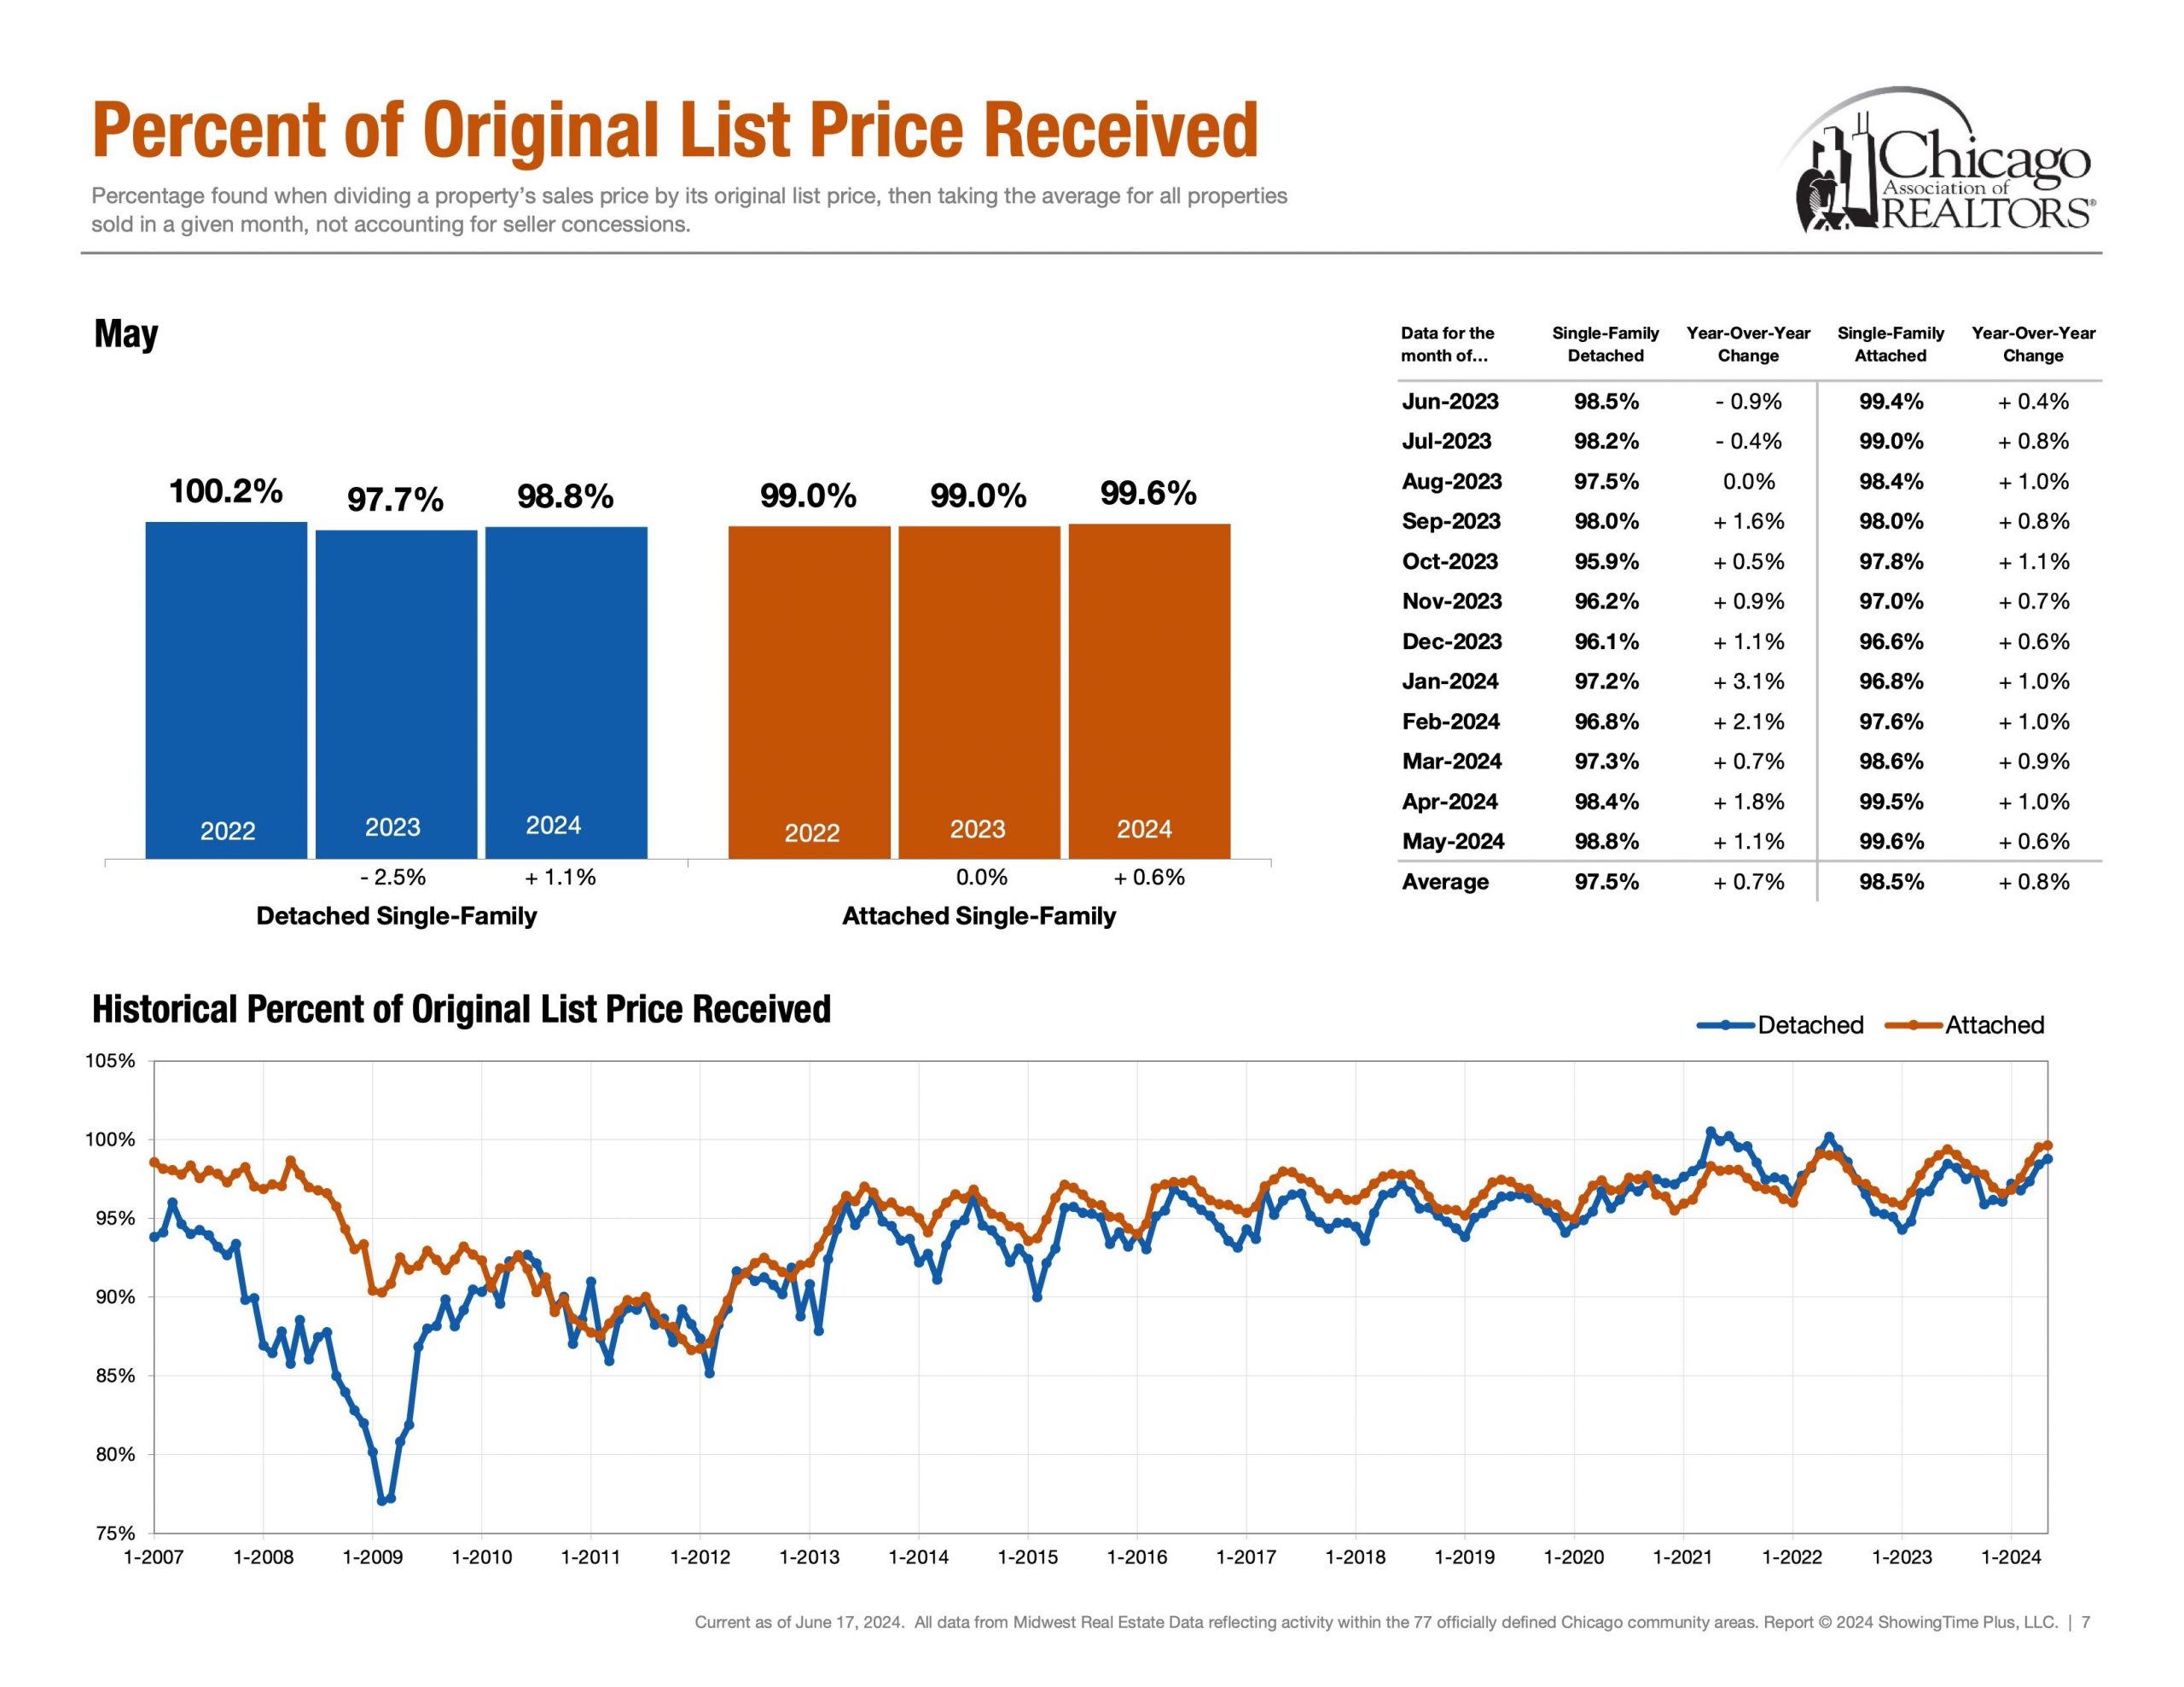
Detached Single ~ 97.5% (Rolling 12 Months Avg) & ~ 98.8% (May 24′)

Attached Single ~ 98.5% (Rolling 12 Months Avg) & ~ 99.6% (May 24′)

Lastly, Percentage of Original List Price Received to Closed Price is a metric that showcases what the average accepted purchase price is relative to the list price. How much below asking price can an offer go while still getting accepted? How much would one have to offer above ask in order to be an above average purchase price?


The End | Have A Great Day!

Please note all of these metrics are along a spectrum as opposed to a specific number. Below is “The Weekly Market Activity Report” which is a research tool reflecting residential real estate activity within the 77 officially defined Chicago community areas provided by the Chicago Association of Realtors®. It is essential to keep in mind that real estate markets can vary across neighborhoods and property types within a city. In conclusion, economic conditions and external factors can influence market trends. Staying updated on these metrics and trends is crucial for making informed decisions. 


How Is The Chicago Real Estate Market? June 15, 2024

How Is the Chicago Real Estate Market? Week 24

June 2024 Week 24

Matthew Litzenberger a third generation Realtor with Coldwell Banker Realty helps buyers and sellers understand Chicago Real Estate Market metrics. Follow along for weekly updates on all things Chicago Real Estate by clicking here.


Introduction

Hello and welcome back to the 24th installment in our weekly series aimed to help understand current Chicago Real Estate Market Metrics. While there are many metrics to talk about in the world of real estate, today we are going to look at only four: speed, demand, supply and negotiations. Let’s get started!


Speed | Healthy Market Time Range


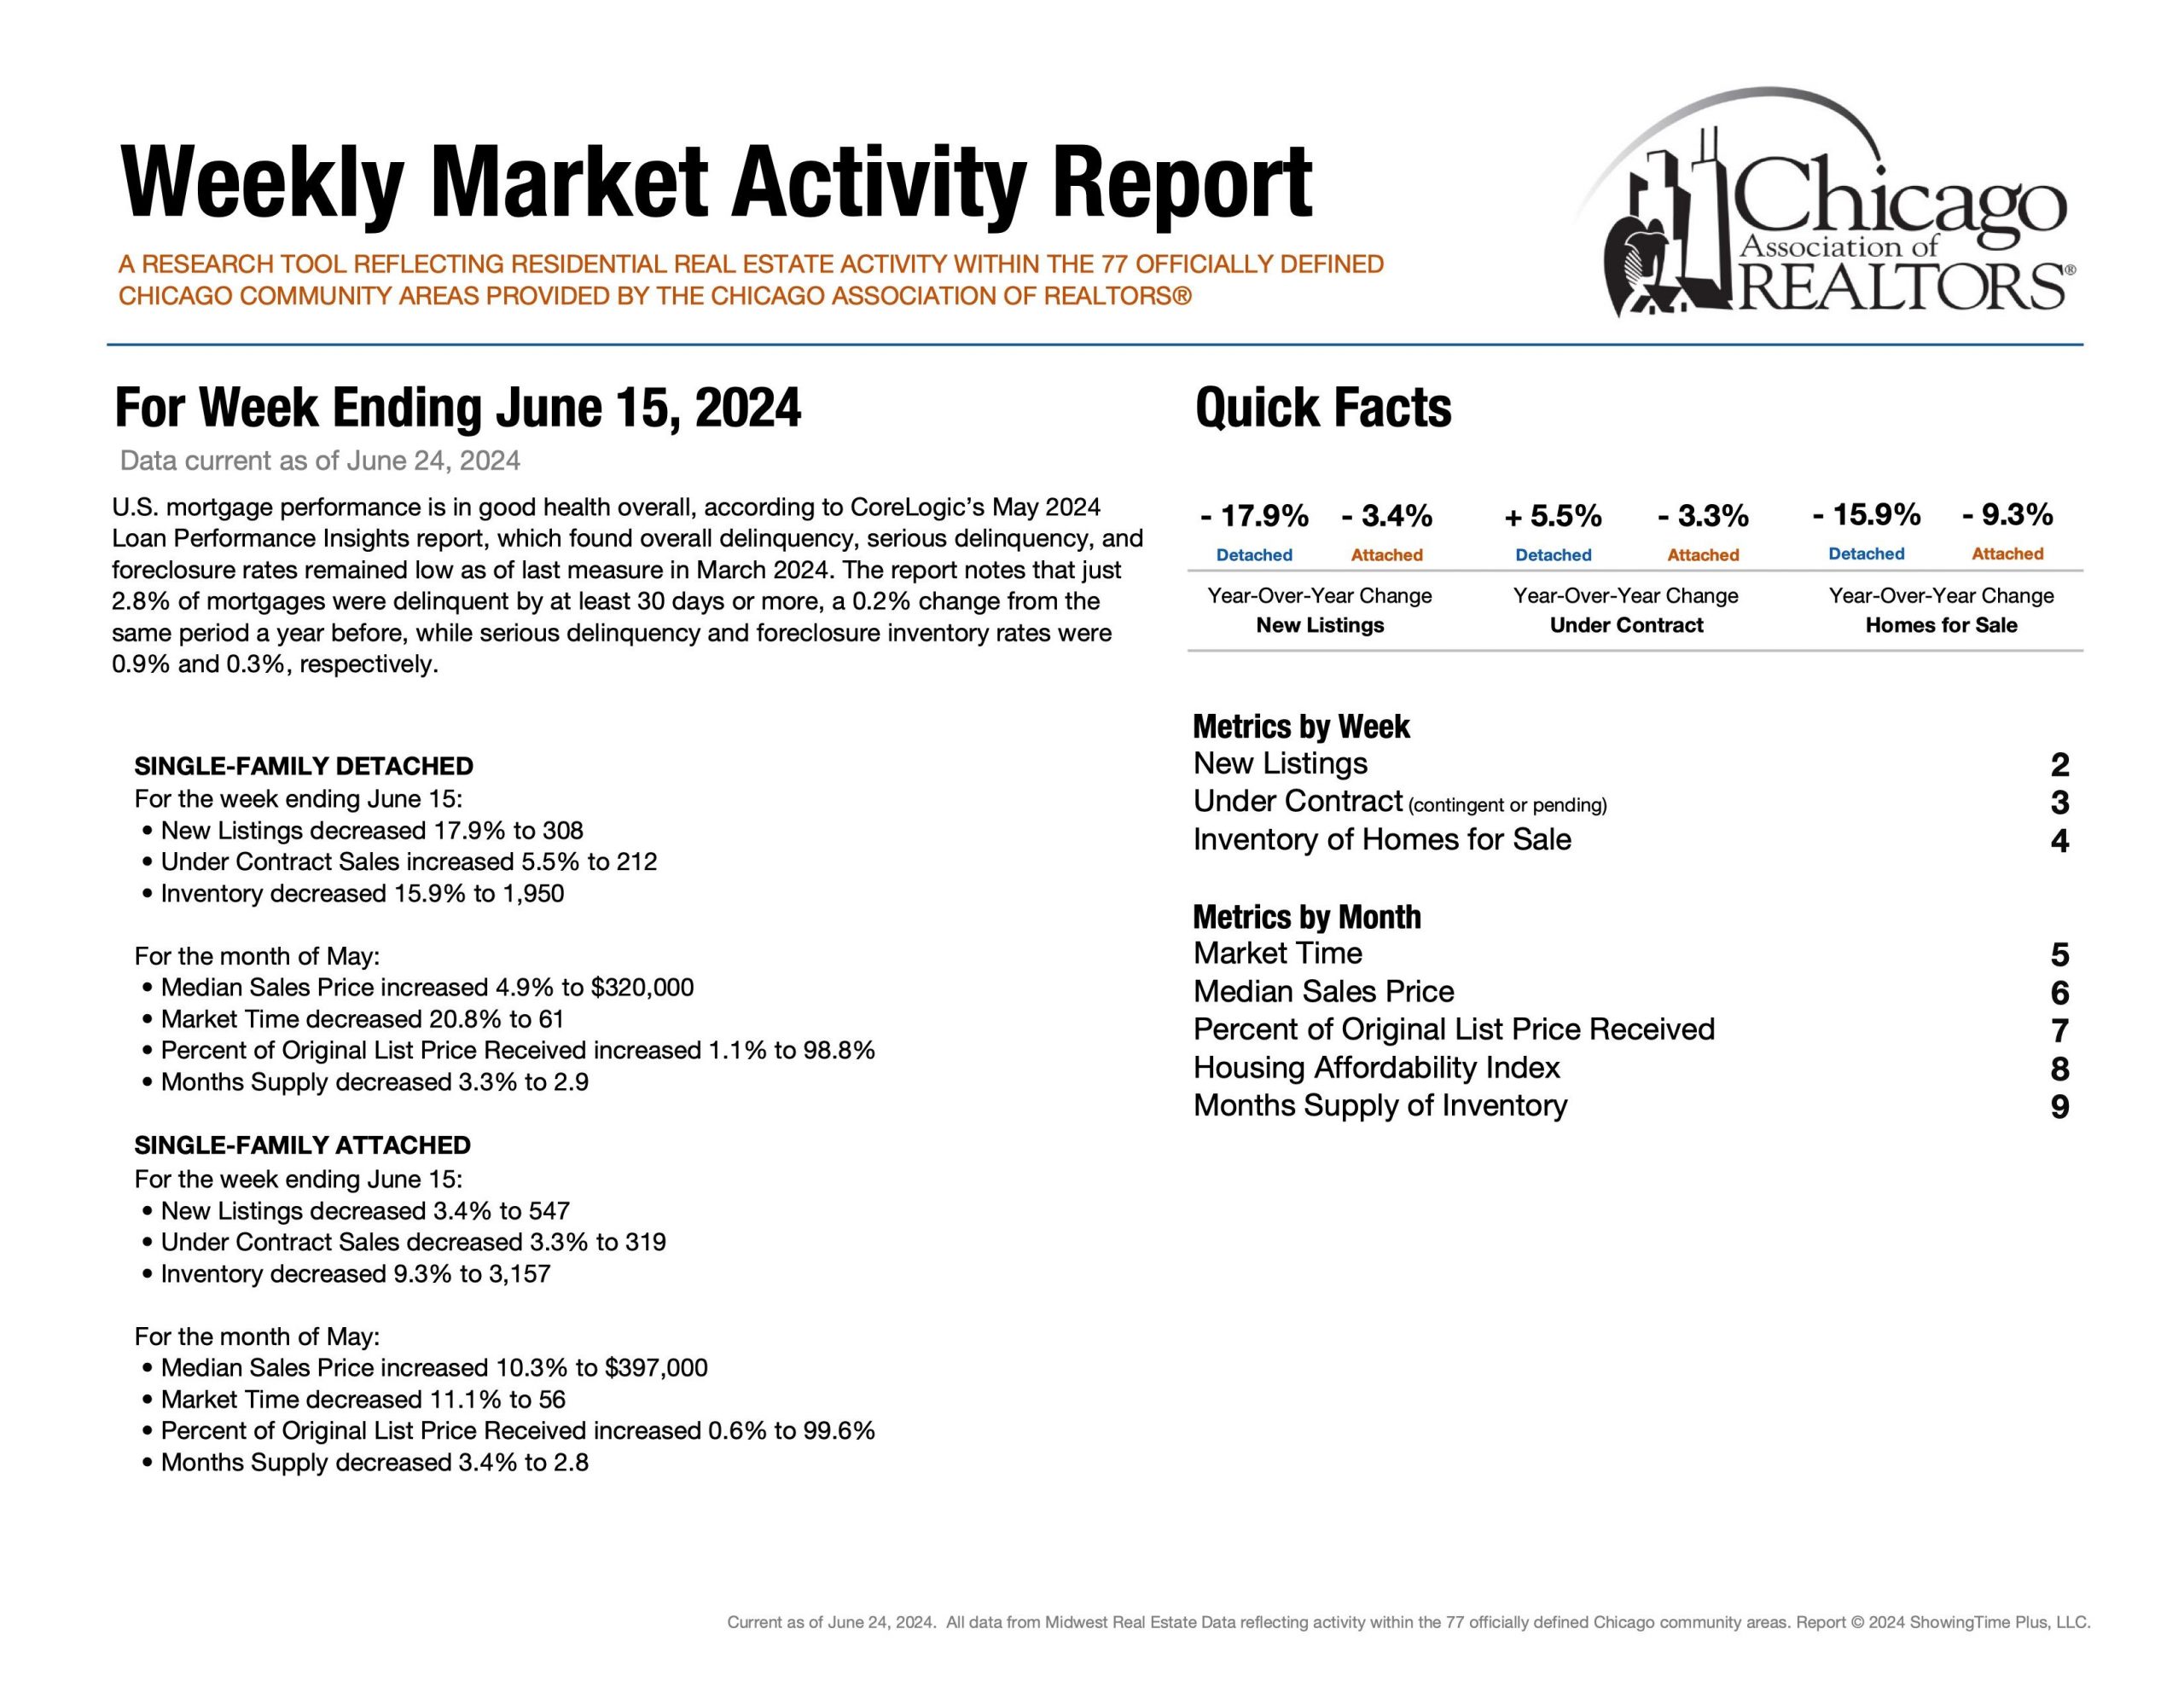
Detached Single ~ 61 Days (May 24′)

Attached Single ~ 56 Days (May 24′)


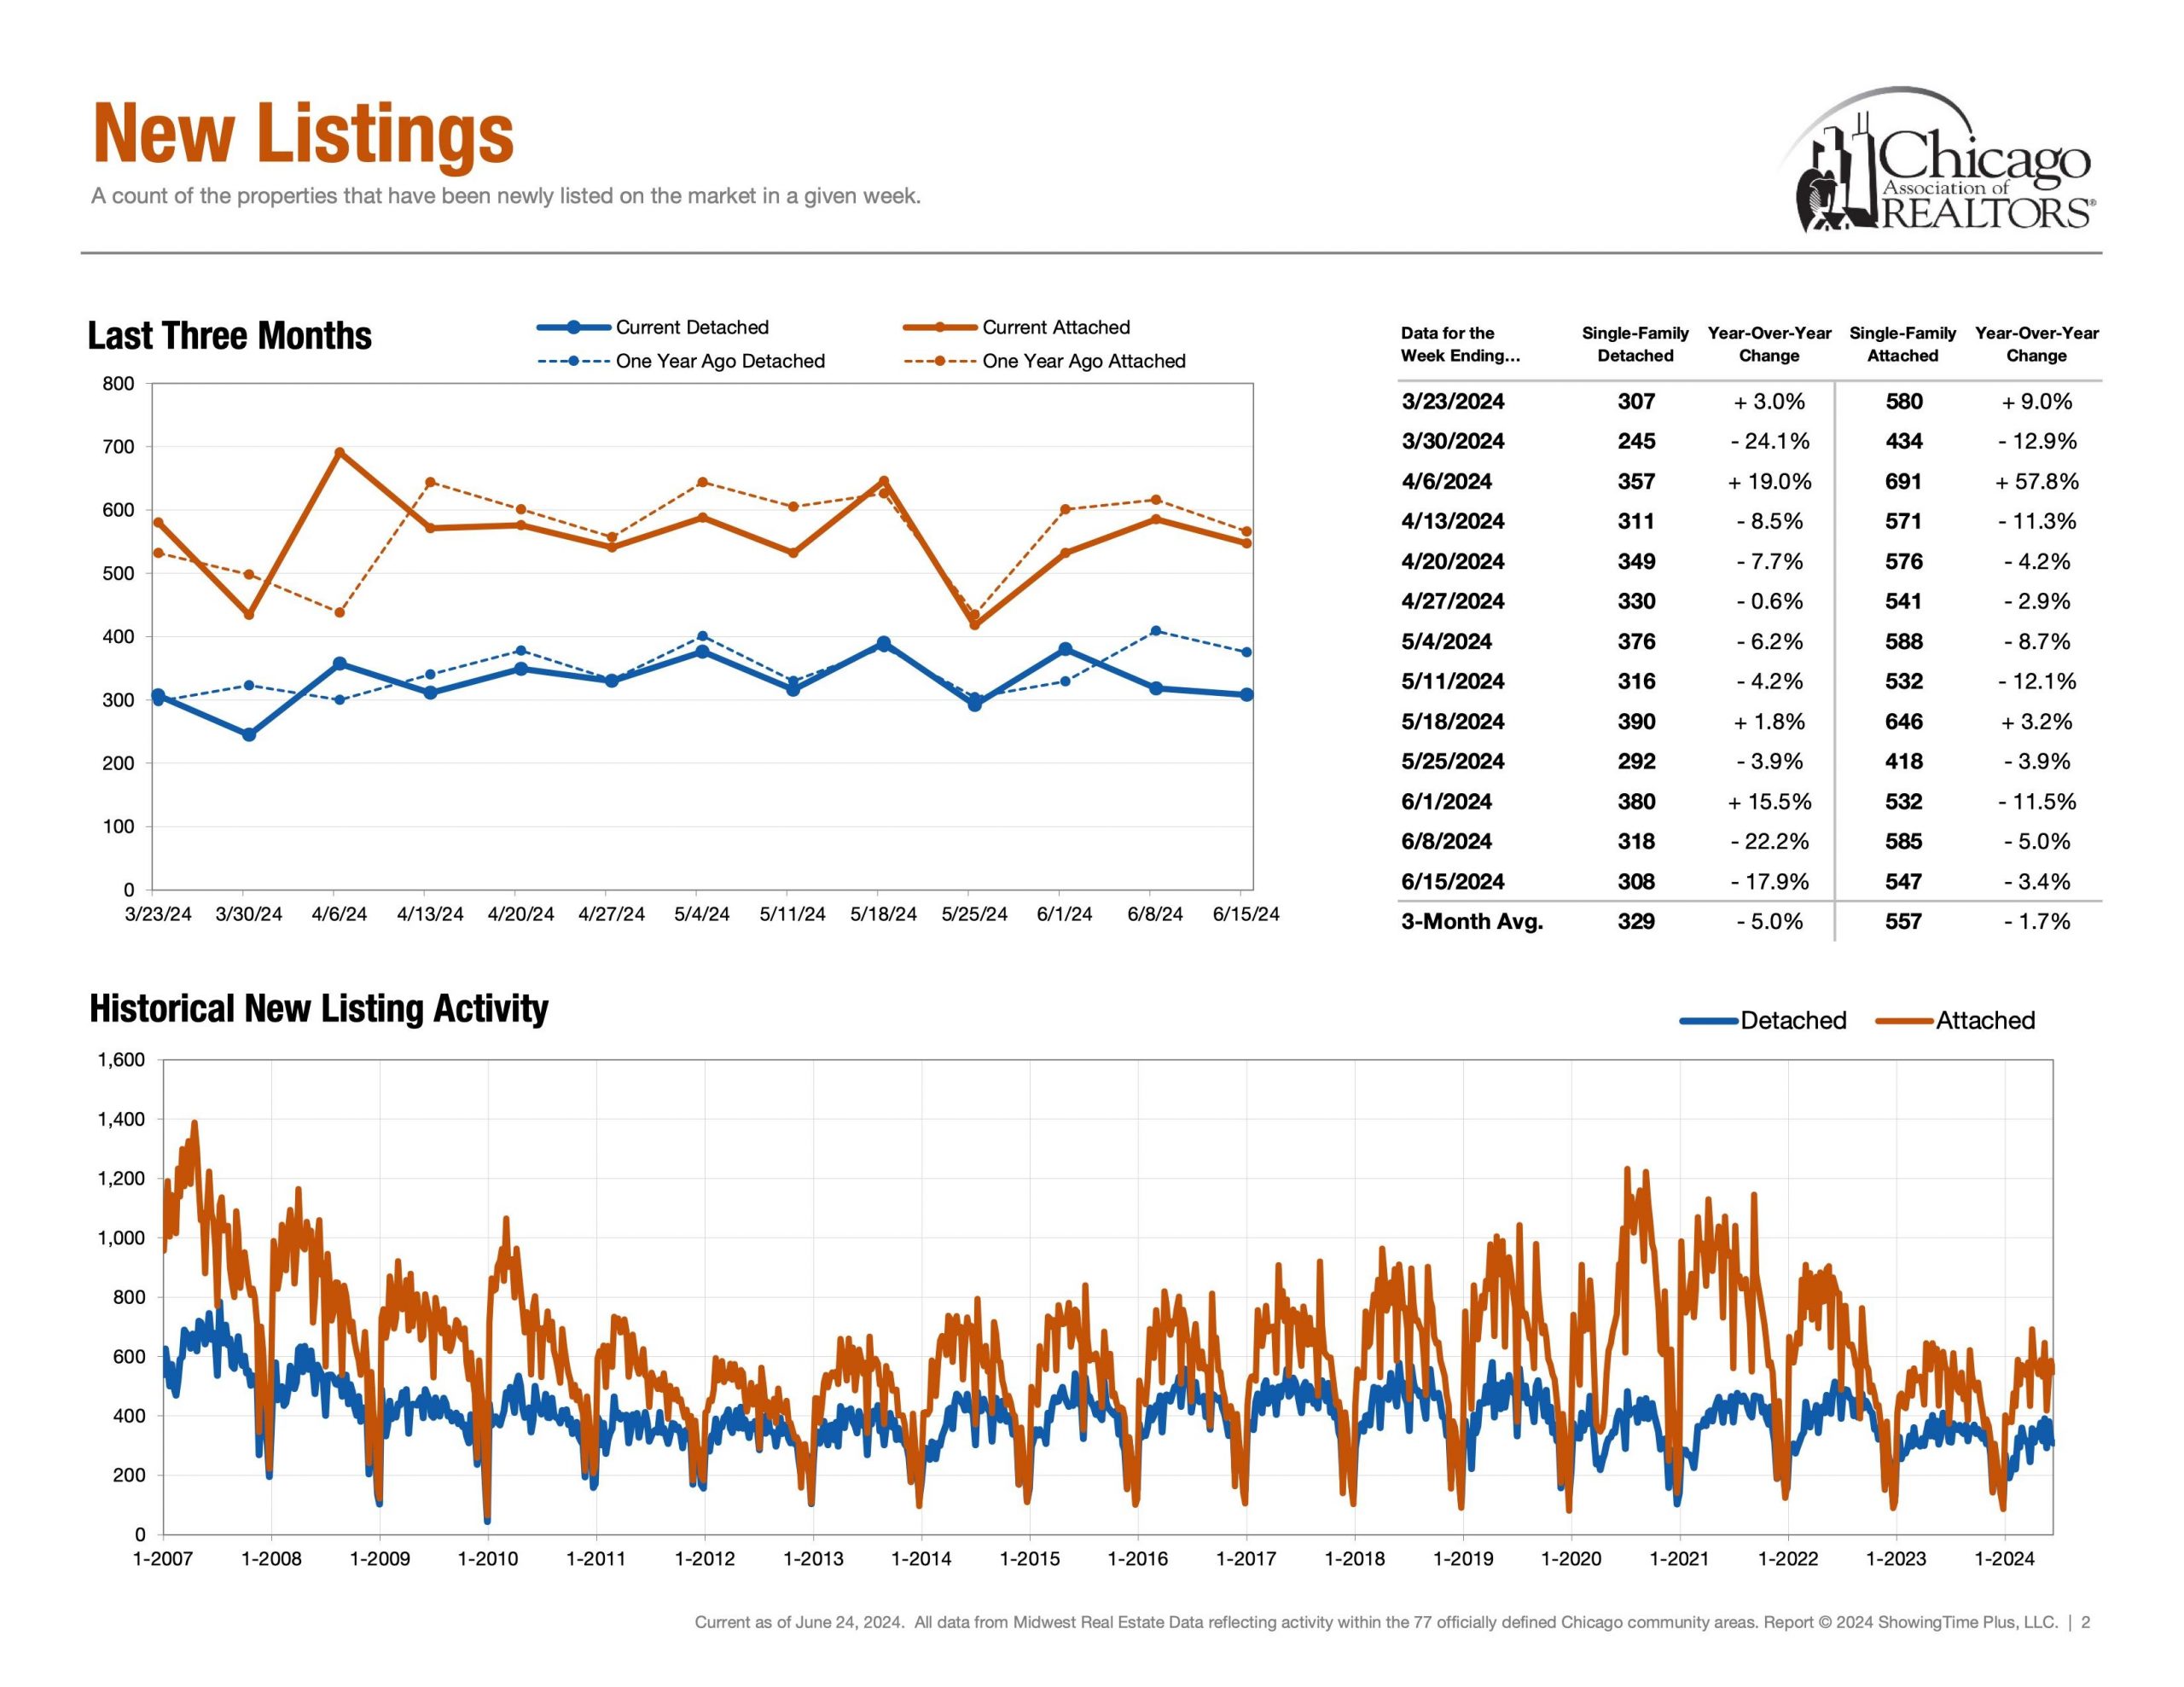
First, market time is metric that showcases speed and whether a listing was priced too low, priced properly or priced too high. If a listing surpasses average days on market, it is a check engine light that your listing maybe overpriced.


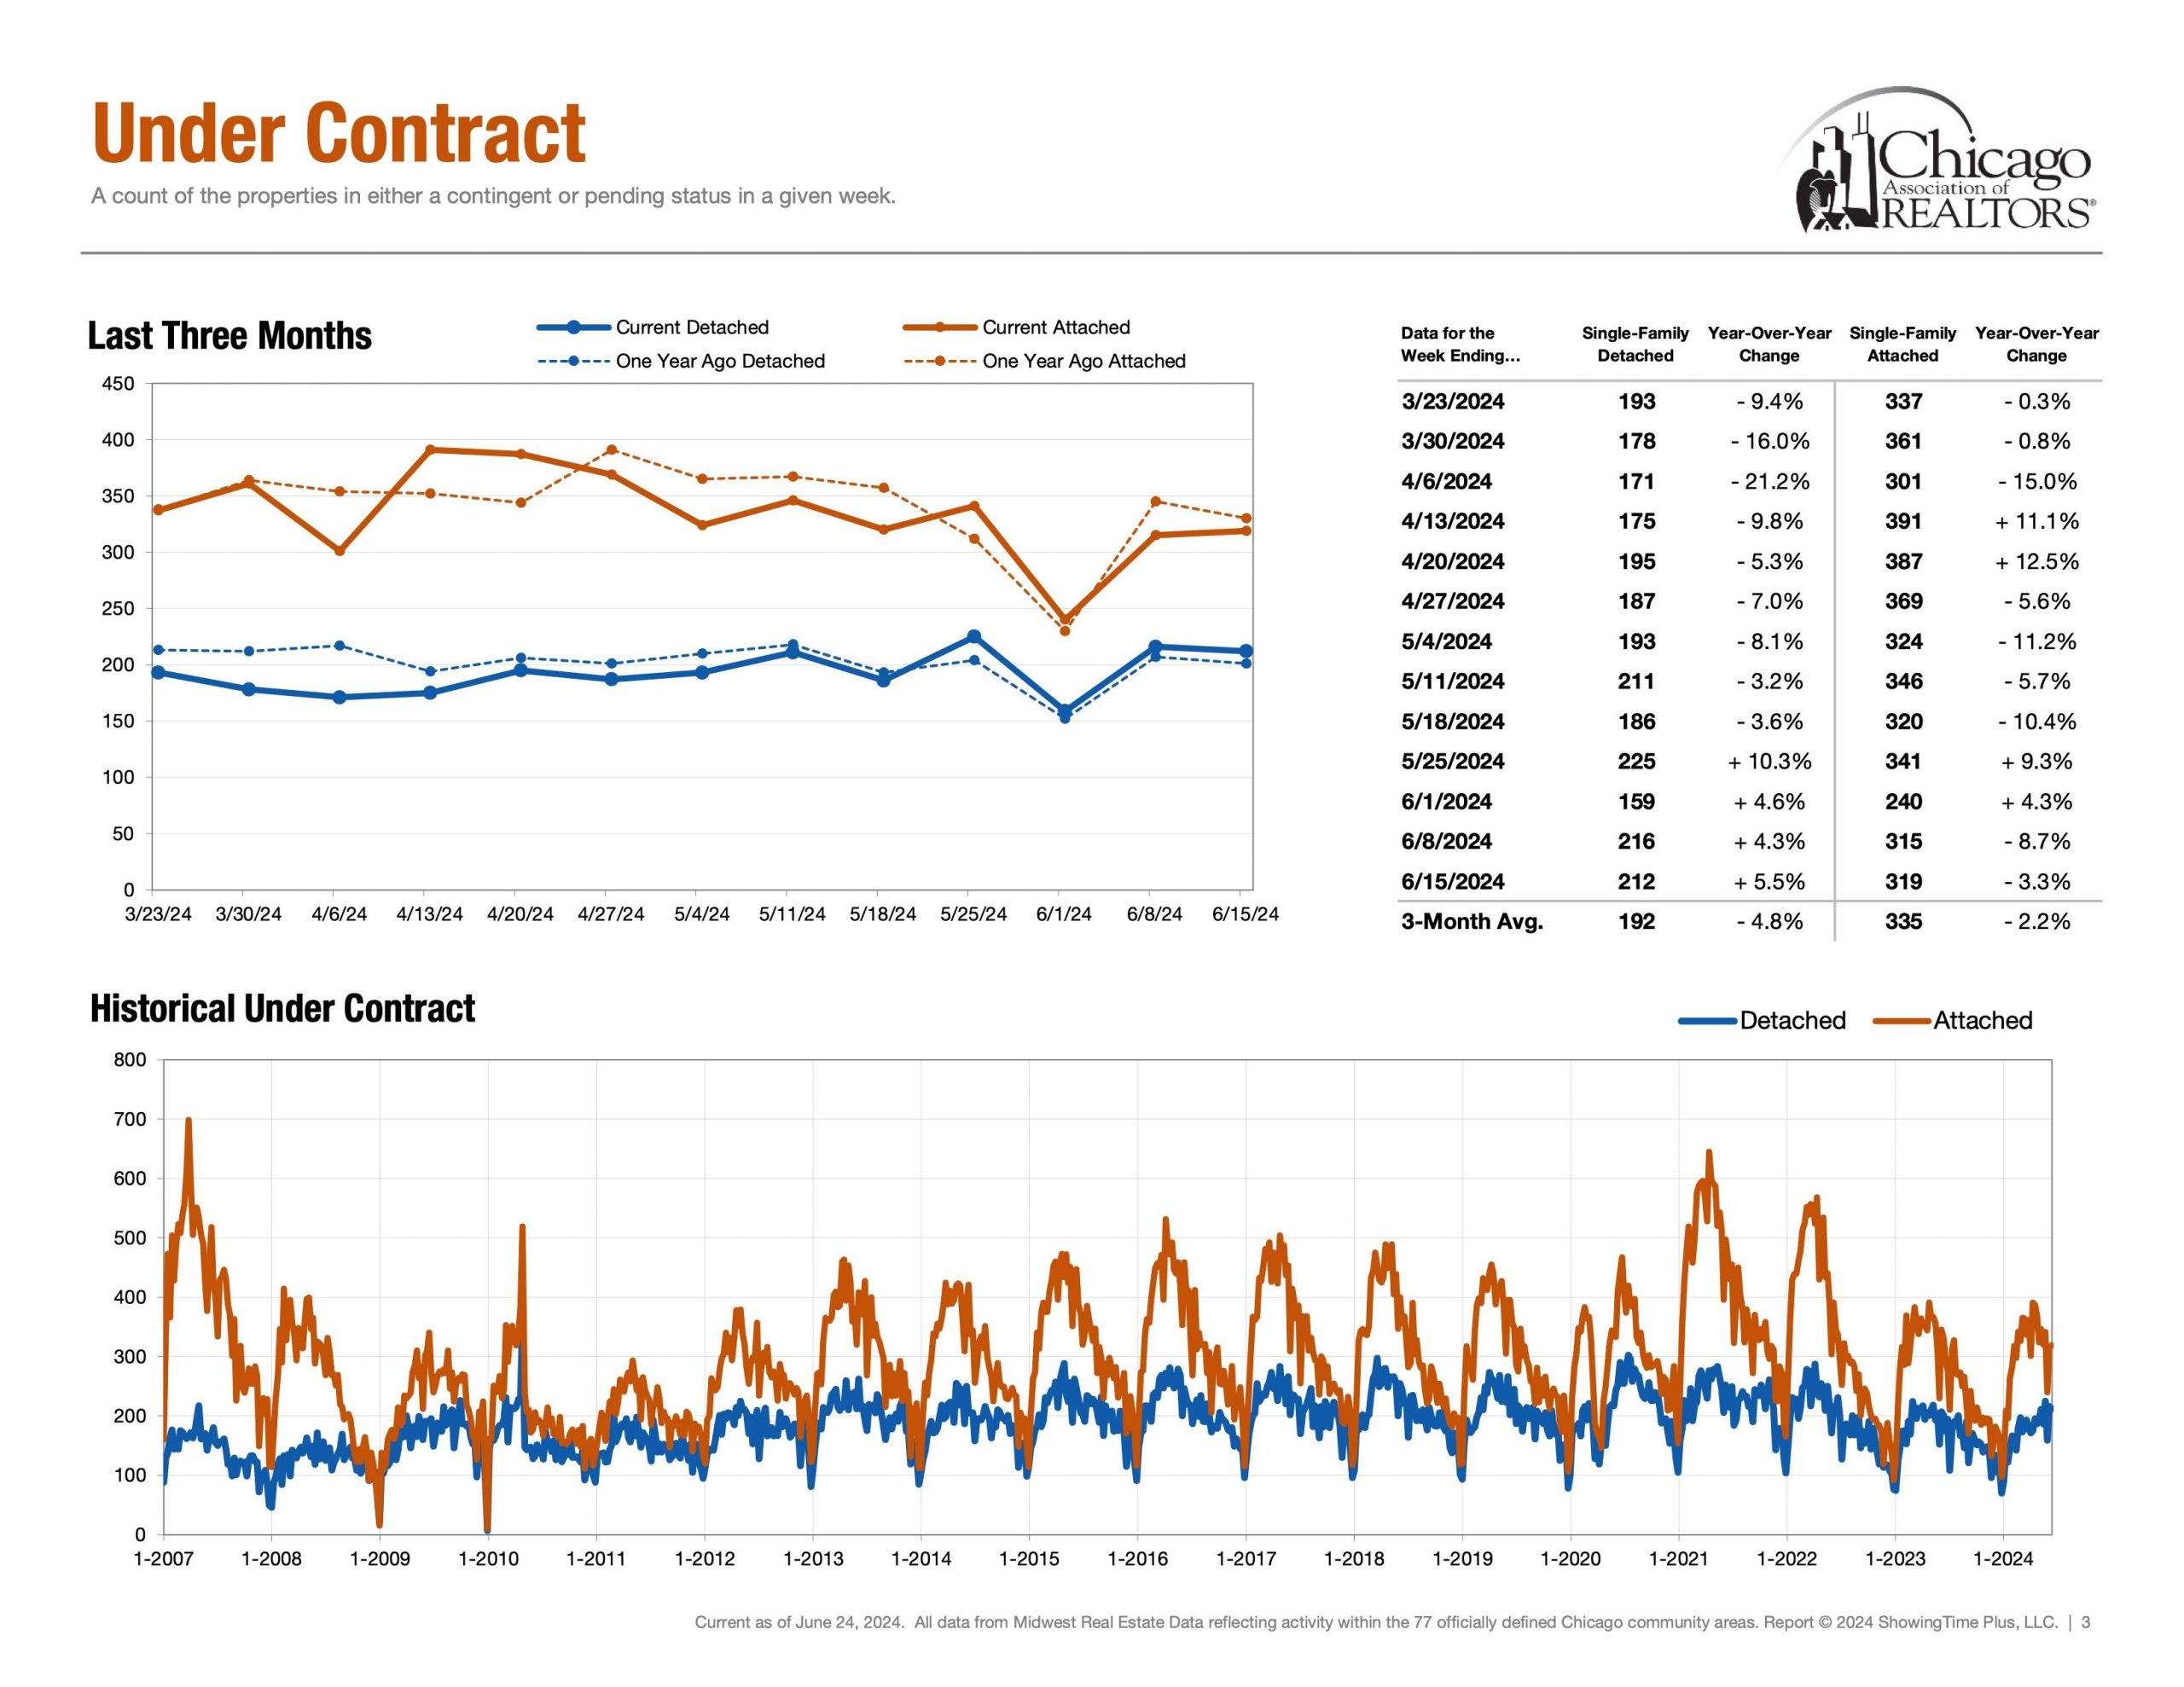
Demand | Under Contract


Detached Single = 212 Properties (June 9th – June 15th)

Attached Single = 319 Properties (June 9th – June 15th)

Secondly, under contract helps answer the question, “In our current market, how many buyers are buying?” Showcasing the heartbeat of the real estate market. Interestingly, demand metrics become more insightful when compared and contrasted with supply/inventory metrics.


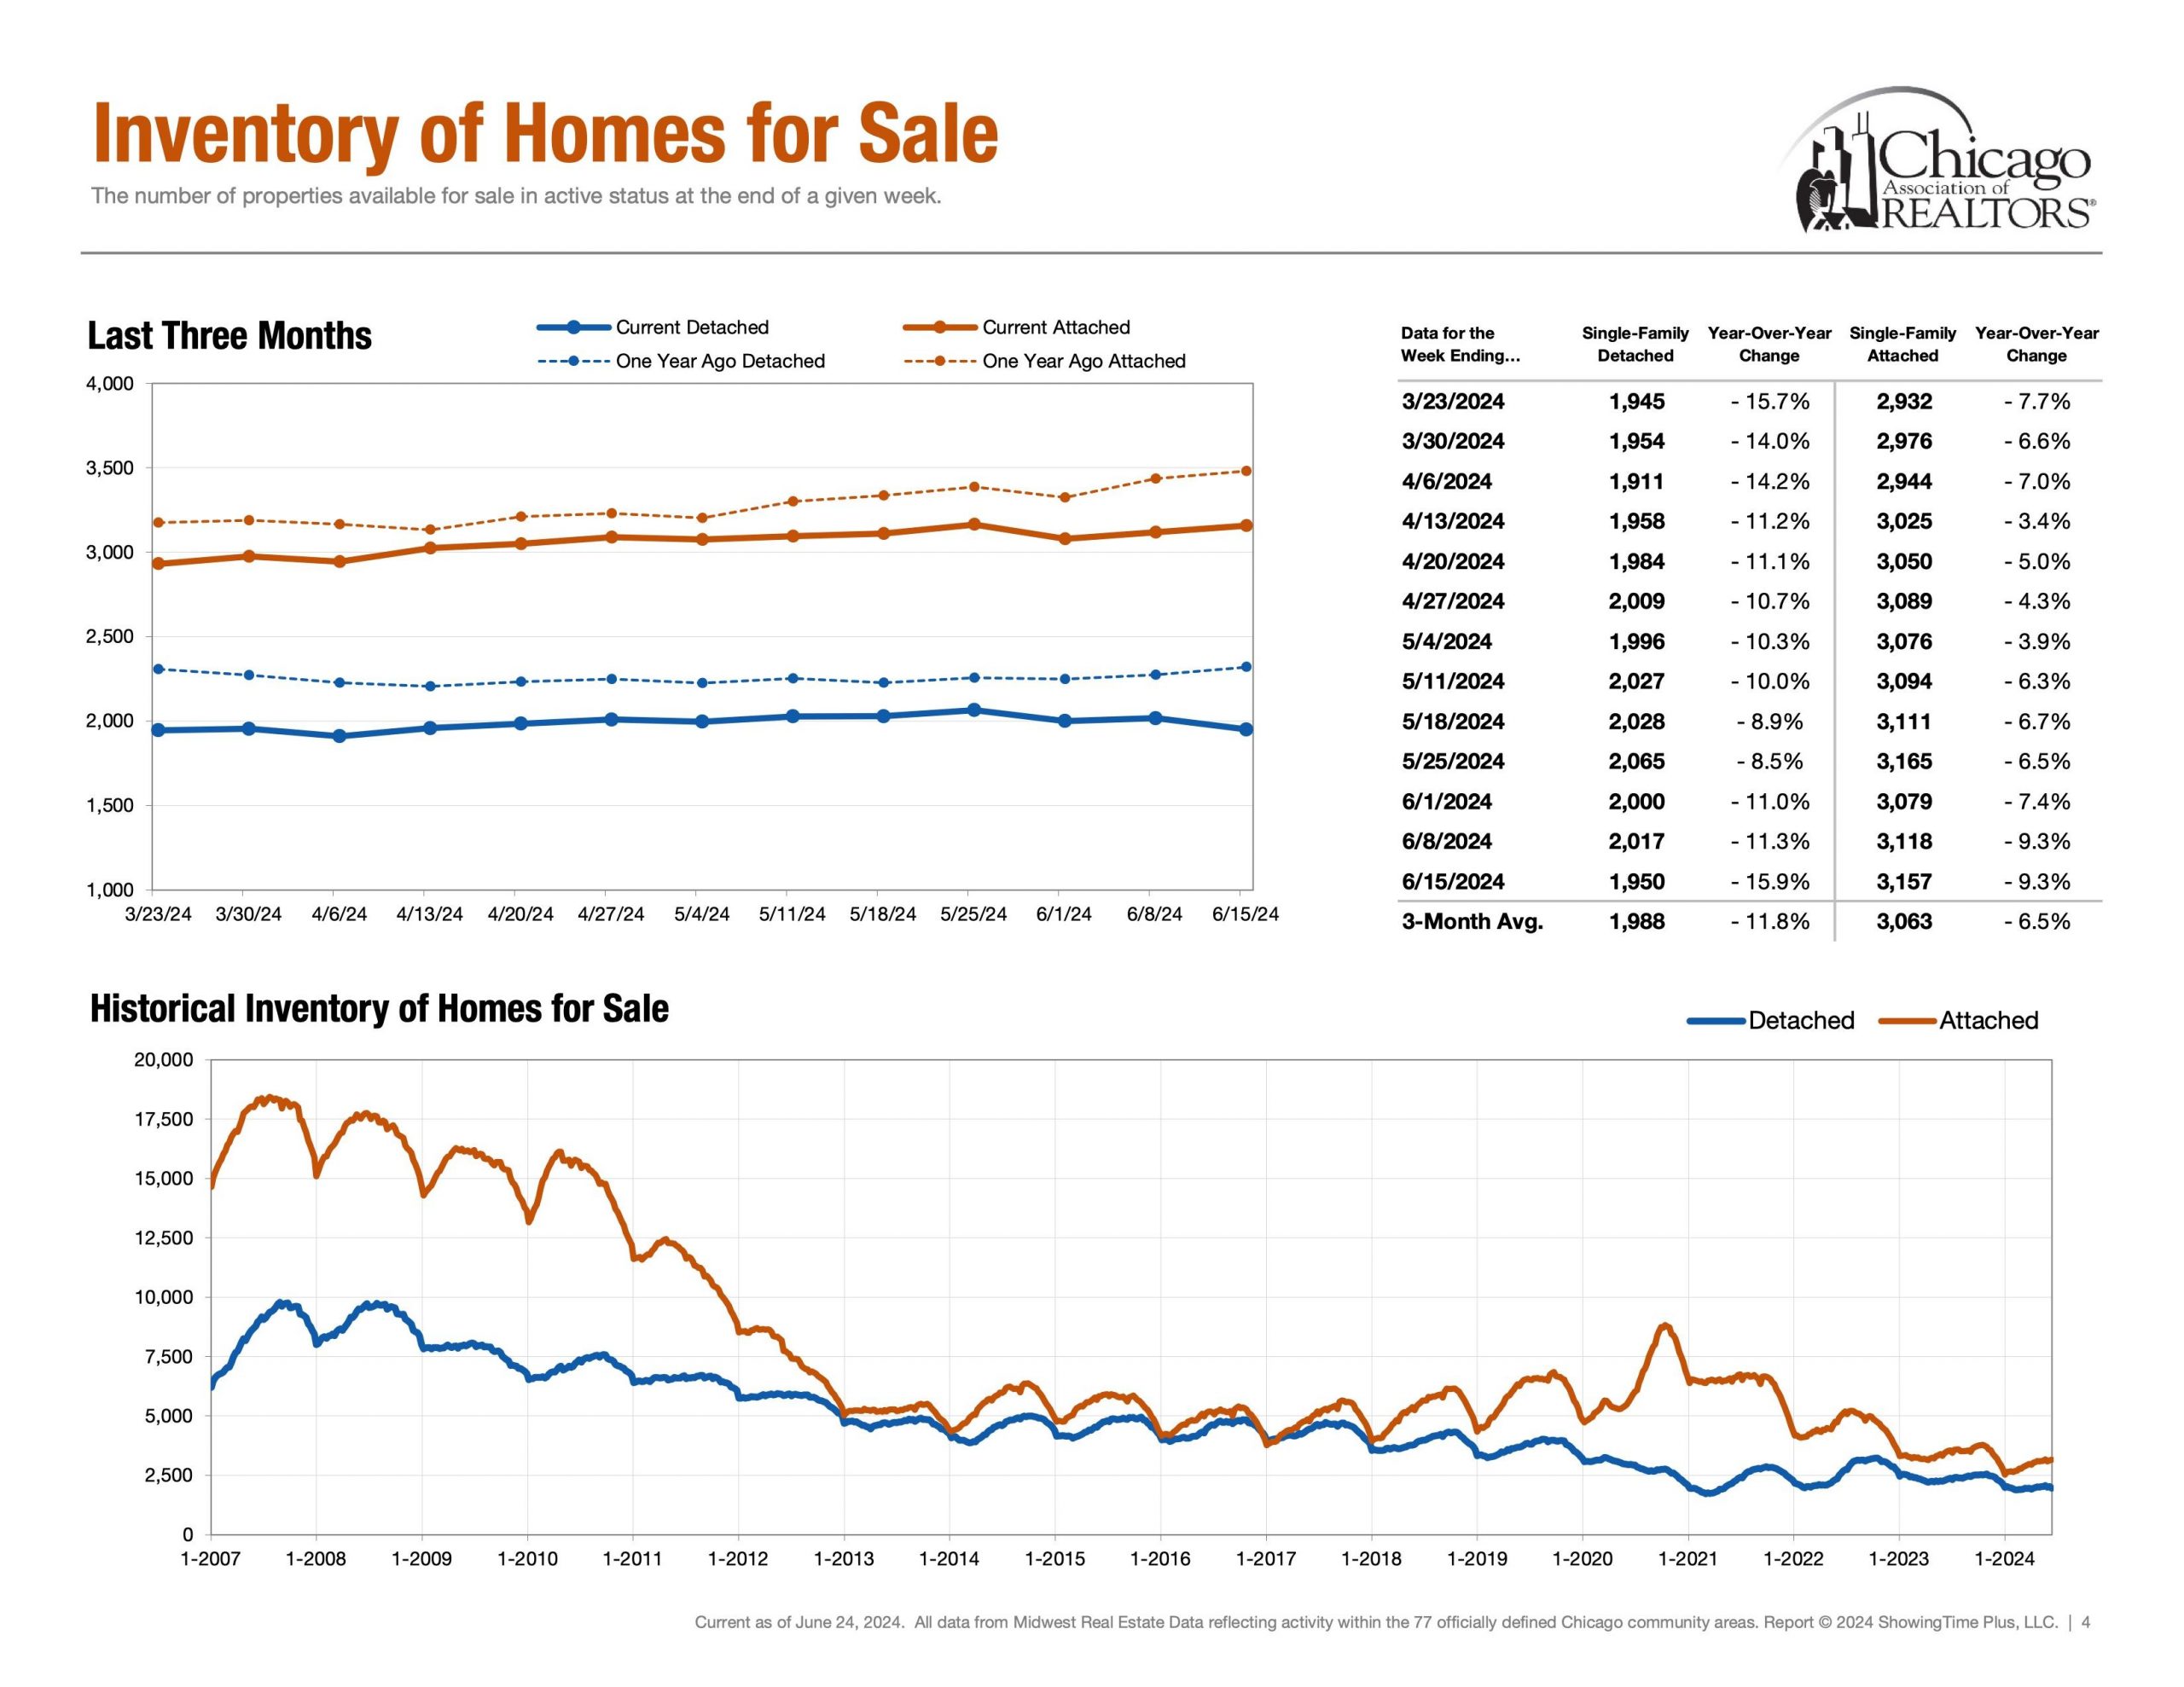
Supply | Inventory of Homes for Sale


Detached Single = 1,950 Properties (June 9th – June 15th)

Attached Single = 3,157 Properties (June 9th – June 15th)

Next, supply showcases how much inventory is available for buyers and how much competition sellers are up against. Additionally, Months of Inventory, Homes for Sale, New Listings and Absorption Rate are also other key metrics in the conversation of supply.


Negotiations | Percentage of Original List Price Received


Detached Single ~ 97.5% (Rolling 12 Months Avg) & ~ 98.8% (May 24′)

Attached Single ~ 98.5% (Rolling 12 Months Avg) & ~ 99.6% (May 24′)

Lastly, Percentage of Original List Price Received to Closed Price is a metric that showcases what the average accepted purchase price is relative to the list price. How much below asking price can an offer go while still getting accepted? How much would one have to offer above ask in order to be an above average purchase price?


The End | Have A Great Day!

Please note all of these metrics are along a spectrum as opposed to a specific number. Below is “The Weekly Market Activity Report” which is a research tool reflecting residential real estate activity within the 77 officially defined Chicago community areas provided by the Chicago Association of Realtors®. It is essential to keep in mind that real estate markets can vary across neighborhoods and property types within a city. In conclusion, economic conditions and external factors can influence market trends. Staying updated on these metrics and trends is crucial for making informed decisions. 


How Is The Chicago Real Estate Market? June 8, 2024

How Is the Chicago Real Estate Market? Week 23

June 2024 Week 23

Matthew Litzenberger a third generation Realtor with Coldwell Banker Realty helps buyers and sellers understand Chicago Real Estate Market metrics. Follow along for weekly updates on all things Chicago Real Estate by clicking here.


Introduction

Hello and welcome back to the 23rd installment in our weekly series aimed to help understand current Chicago Real Estate Market Metrics. While there are many metrics to talk about in the world of real estate, today we are going to look at only four: speed, demand, supply and negotiations. Let’s get started!


Speed | Healthy Market Time Range


Detached Single ~ 61 Days (May 24′)

Attached Single ~ 56 Days (May 24′)


First, market time is metric that showcases speed and whether a listing was priced too low, priced properly or priced too high. If a listing surpasses average days on market, it is a check engine light that your listing maybe overpriced.


Demand | Under Contract


Detached Single = 228 Properties (June 2nd – June 8th)

Attached Single = 326 Properties (June 2nd – June 8th)

Secondly, under contract helps answer the question, “In our current market, how many buyers are buying?” Showcasing the heartbeat of the real estate market. Interestingly, demand metrics become more insightful when compared and contrasted with supply/inventory metrics.


Supply | Inventory of Homes for Sale


Detached Single = 1,990 Properties (June 2nd – June 8th)

Attached Single = 3,084 Properties (June 2nd – June 8th)

Next, supply showcases how much inventory is available for buyers and how much competition sellers are up against. Additionally, Months of Inventory, Homes for Sale, New Listings and Absorption Rate are also other key metrics in the conversation of supply.


Negotiations | Percentage of Original List Price Received


Detached Single ~ 97.5% (Rolling 12 Months Avg) & ~ 98.8% (May 24′)

Attached Single ~ 98.5% (Rolling 12 Months Avg) & ~ 99.6% (May 24′)

Lastly, Percentage of Original List Price Received to Closed Price is a metric that showcases what the average accepted purchase price is relative to the list price. How much below asking price can an offer go while still getting accepted? How much would one have to offer above ask in order to be an above average purchase price?


The End | Have A Great Day!

Please note all of these metrics are along a spectrum as opposed to a specific number. Below is “The Weekly Market Activity Report” which is a research tool reflecting residential real estate activity within the 77 officially defined Chicago community areas provided by the Chicago Association of Realtors®. It is essential to keep in mind that real estate markets can vary across neighborhoods and property types within a city. In conclusion, economic conditions and external factors can influence market trends. Staying updated on these metrics and trends is crucial for making informed decisions. 


How Is The Chicago Real Estate Market? June 1, 2024

How Is the Chicago Real Estate Market? Week 22

June 2024 Week 22

Matthew Litzenberger a third generation Realtor with Coldwell Banker Realty helps buyers and sellers understand Chicago Real Estate Market metrics. Follow along for weekly updates on all things Chicago Real Estate by clicking here.


Introduction

Hello and welcome back to the 22nd installment in our weekly series aimed to help understand current Chicago Real Estate Market Metrics. While there are many metrics to talk about in the world of real estate, today we are going to look at only four: speed, demand, supply and negotiations. Let’s get started!


Speed | Healthy Market Time Range


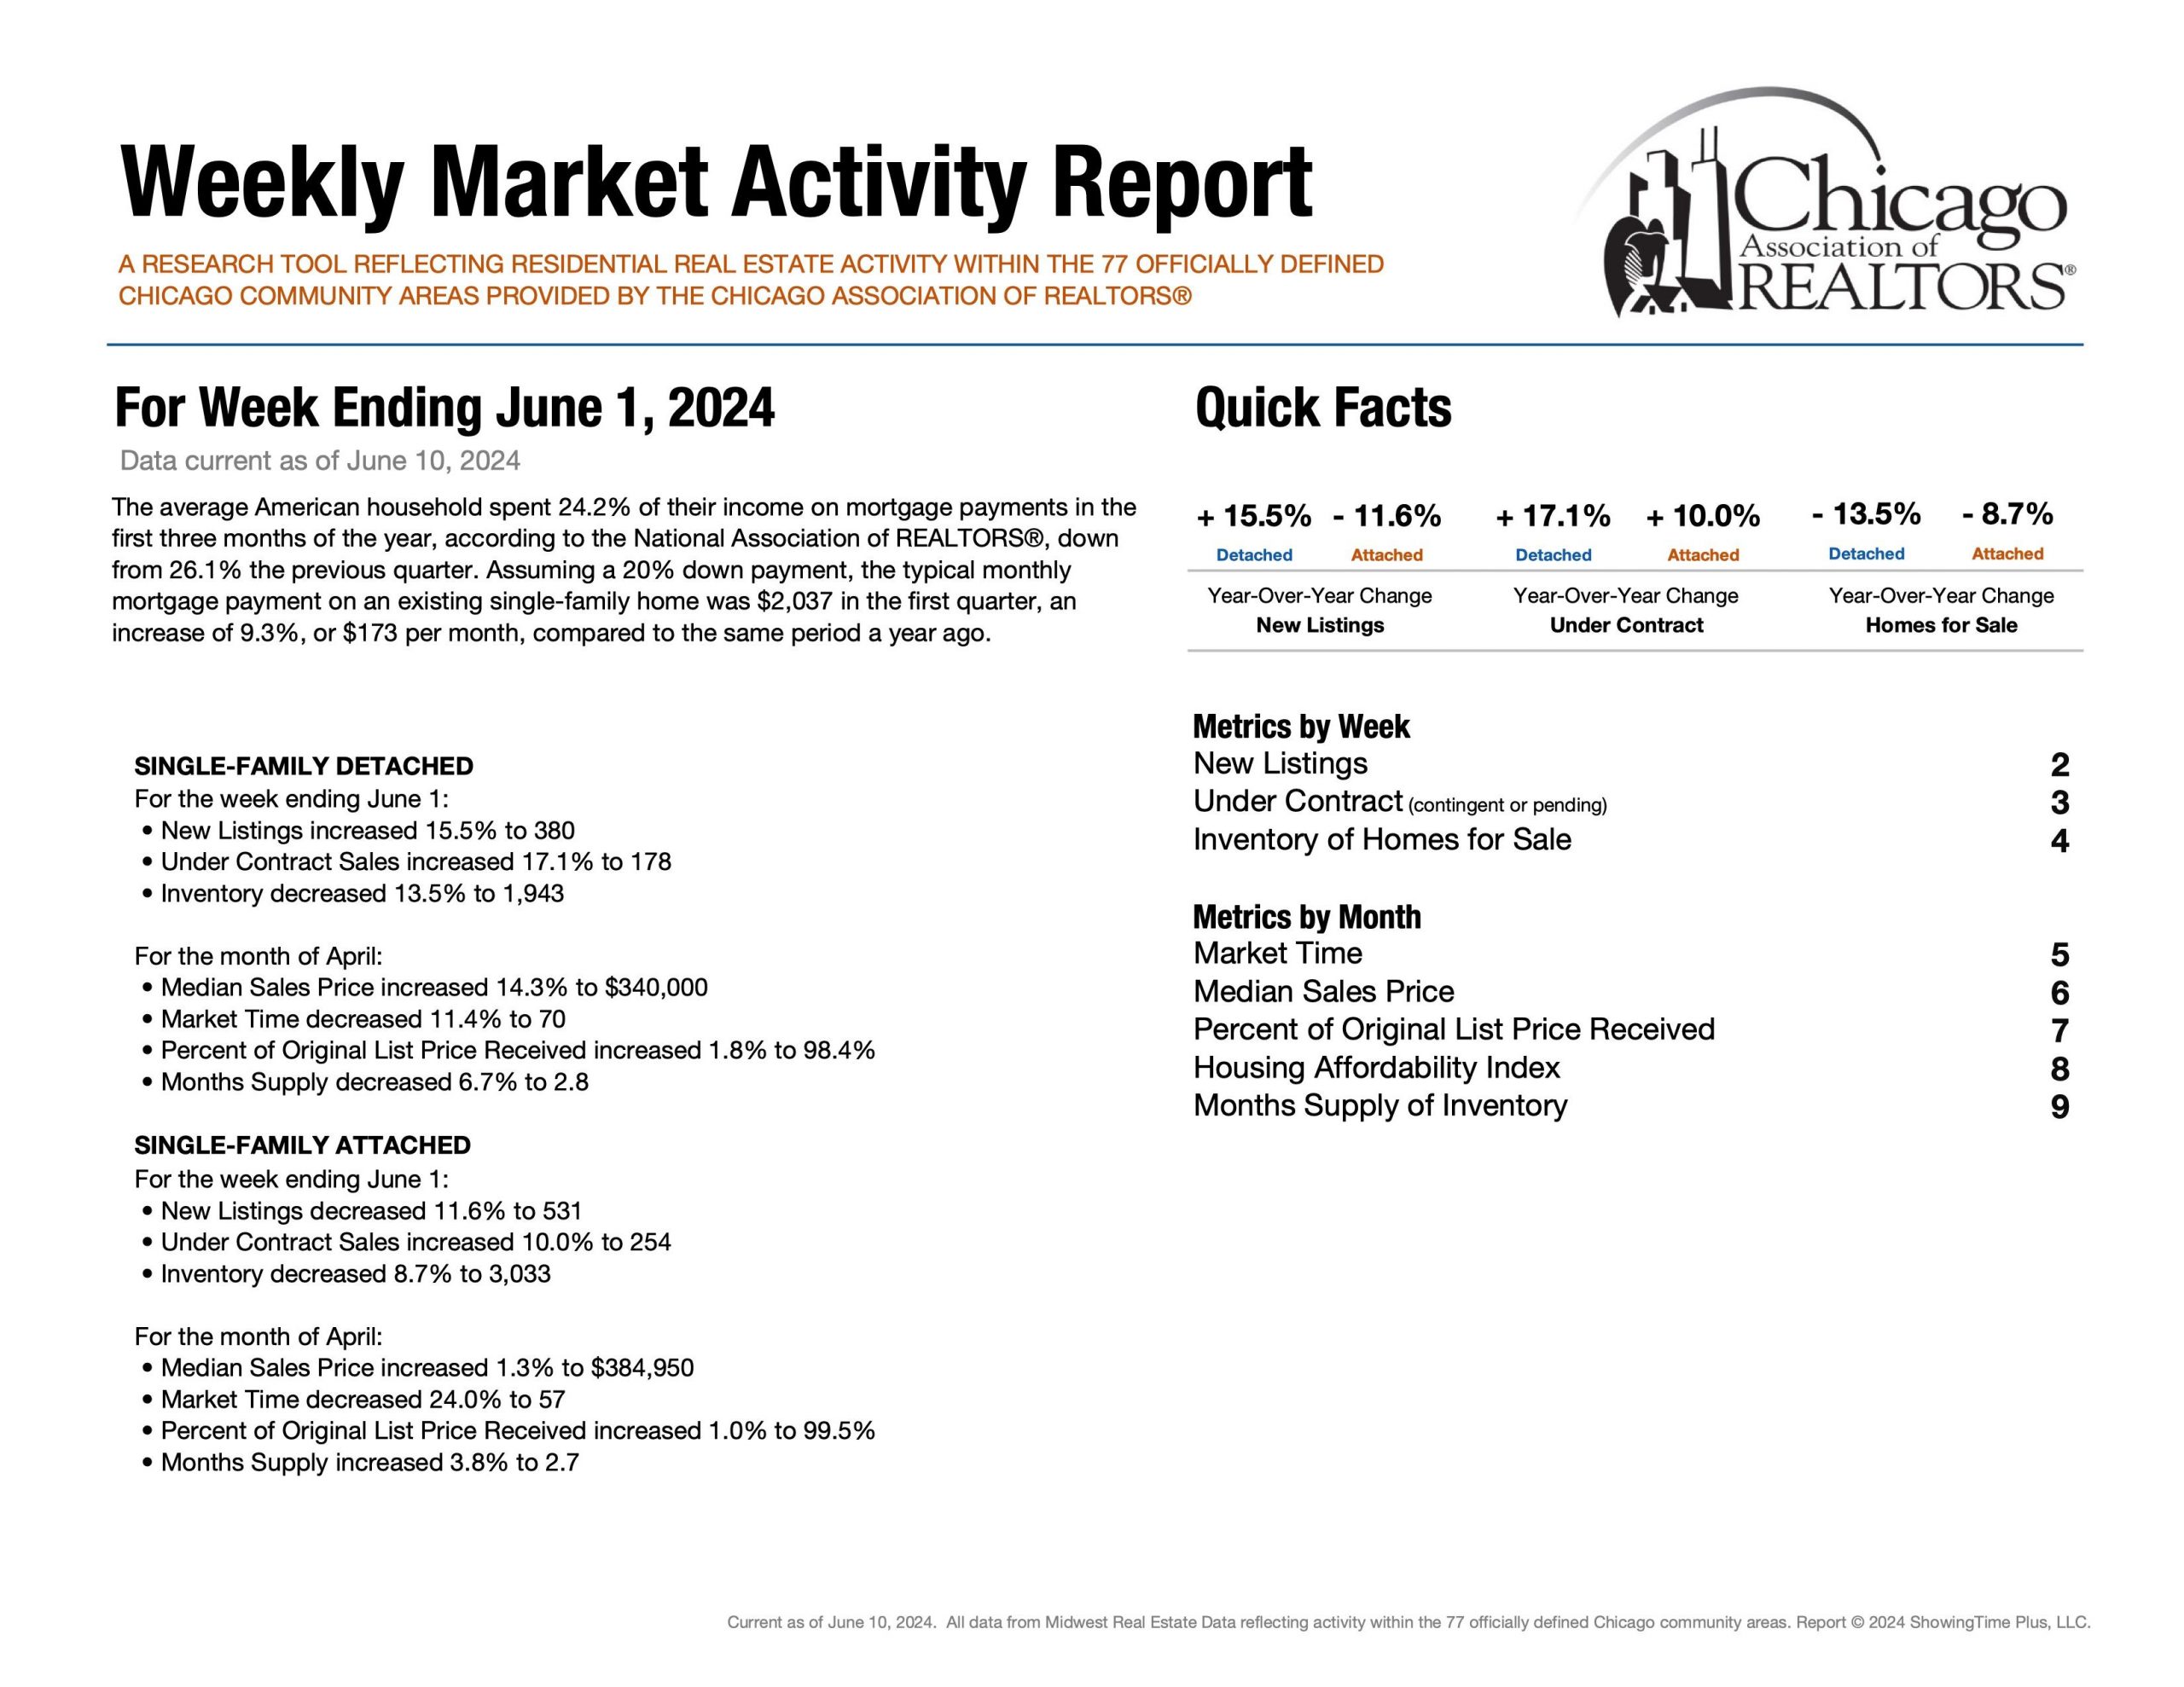
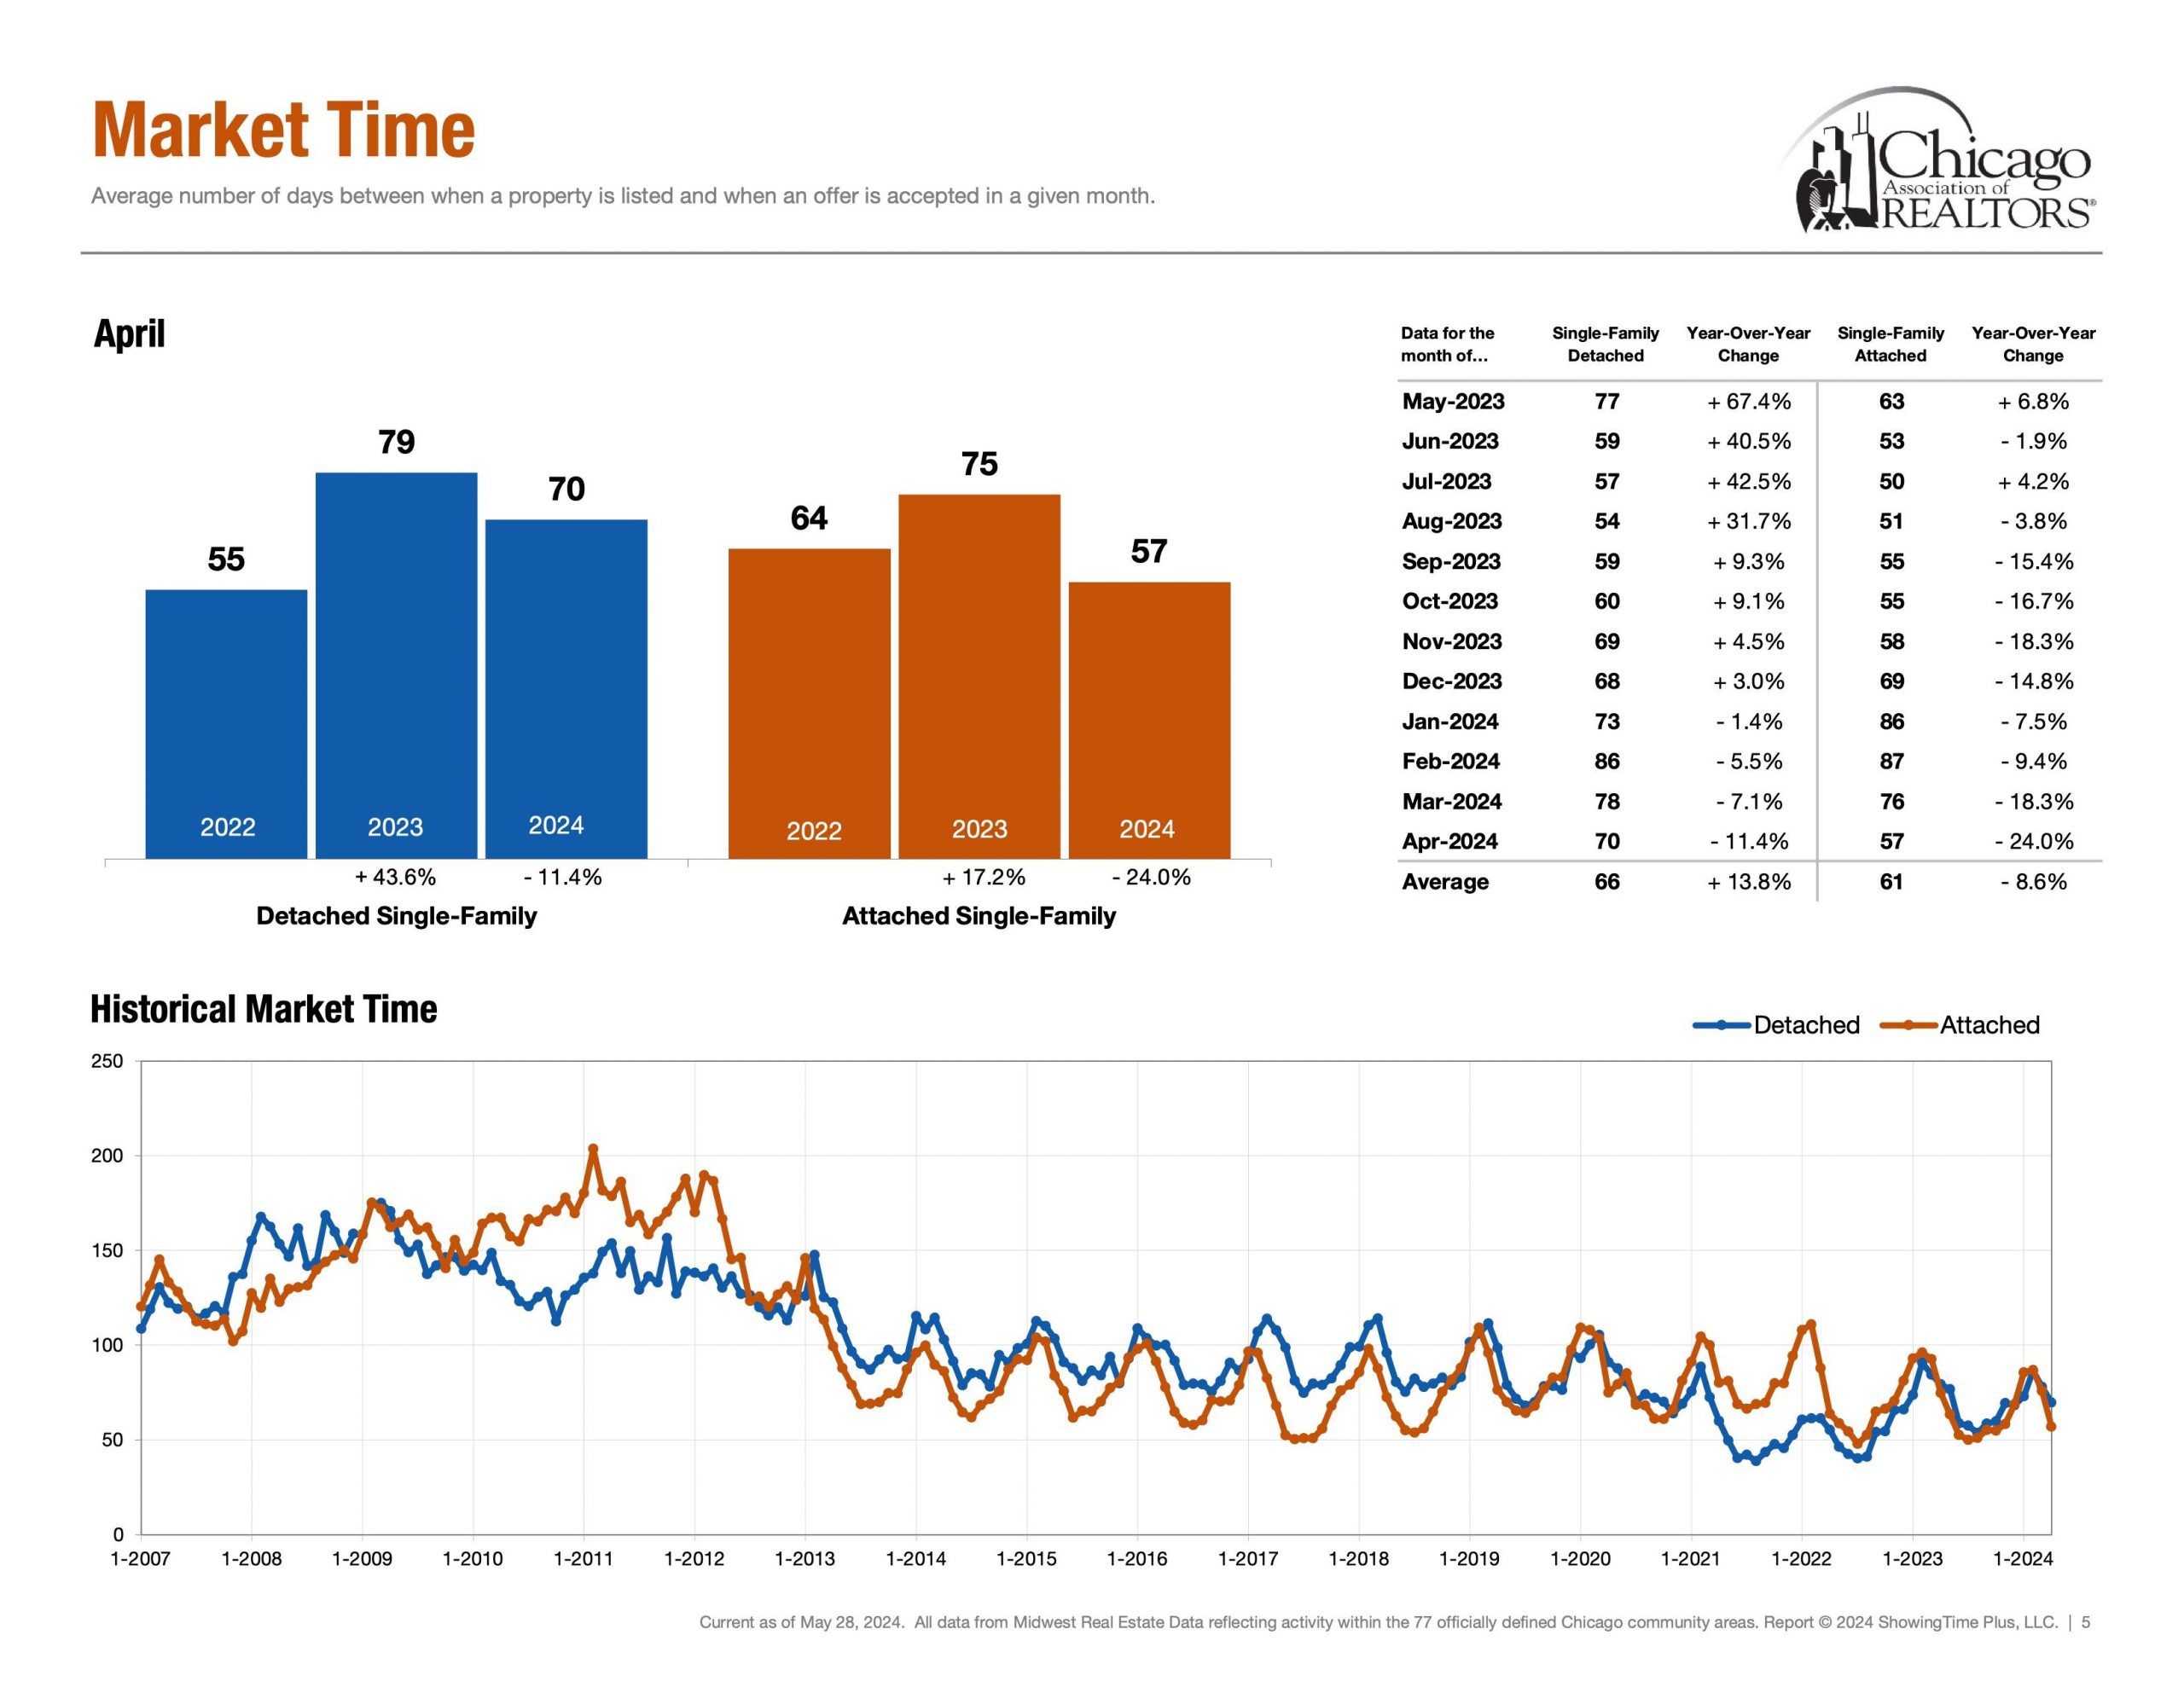
Detached Single ~ 70 Days (April 24′)

Attached Single ~ 57 Days (April 24′)


First, market time is metric that showcases speed and whether a listing was priced too low, priced properly or priced too high. If a listing surpasses average days on market, it is a check engine light that your listing maybe overpriced.


Demand | Under Contract


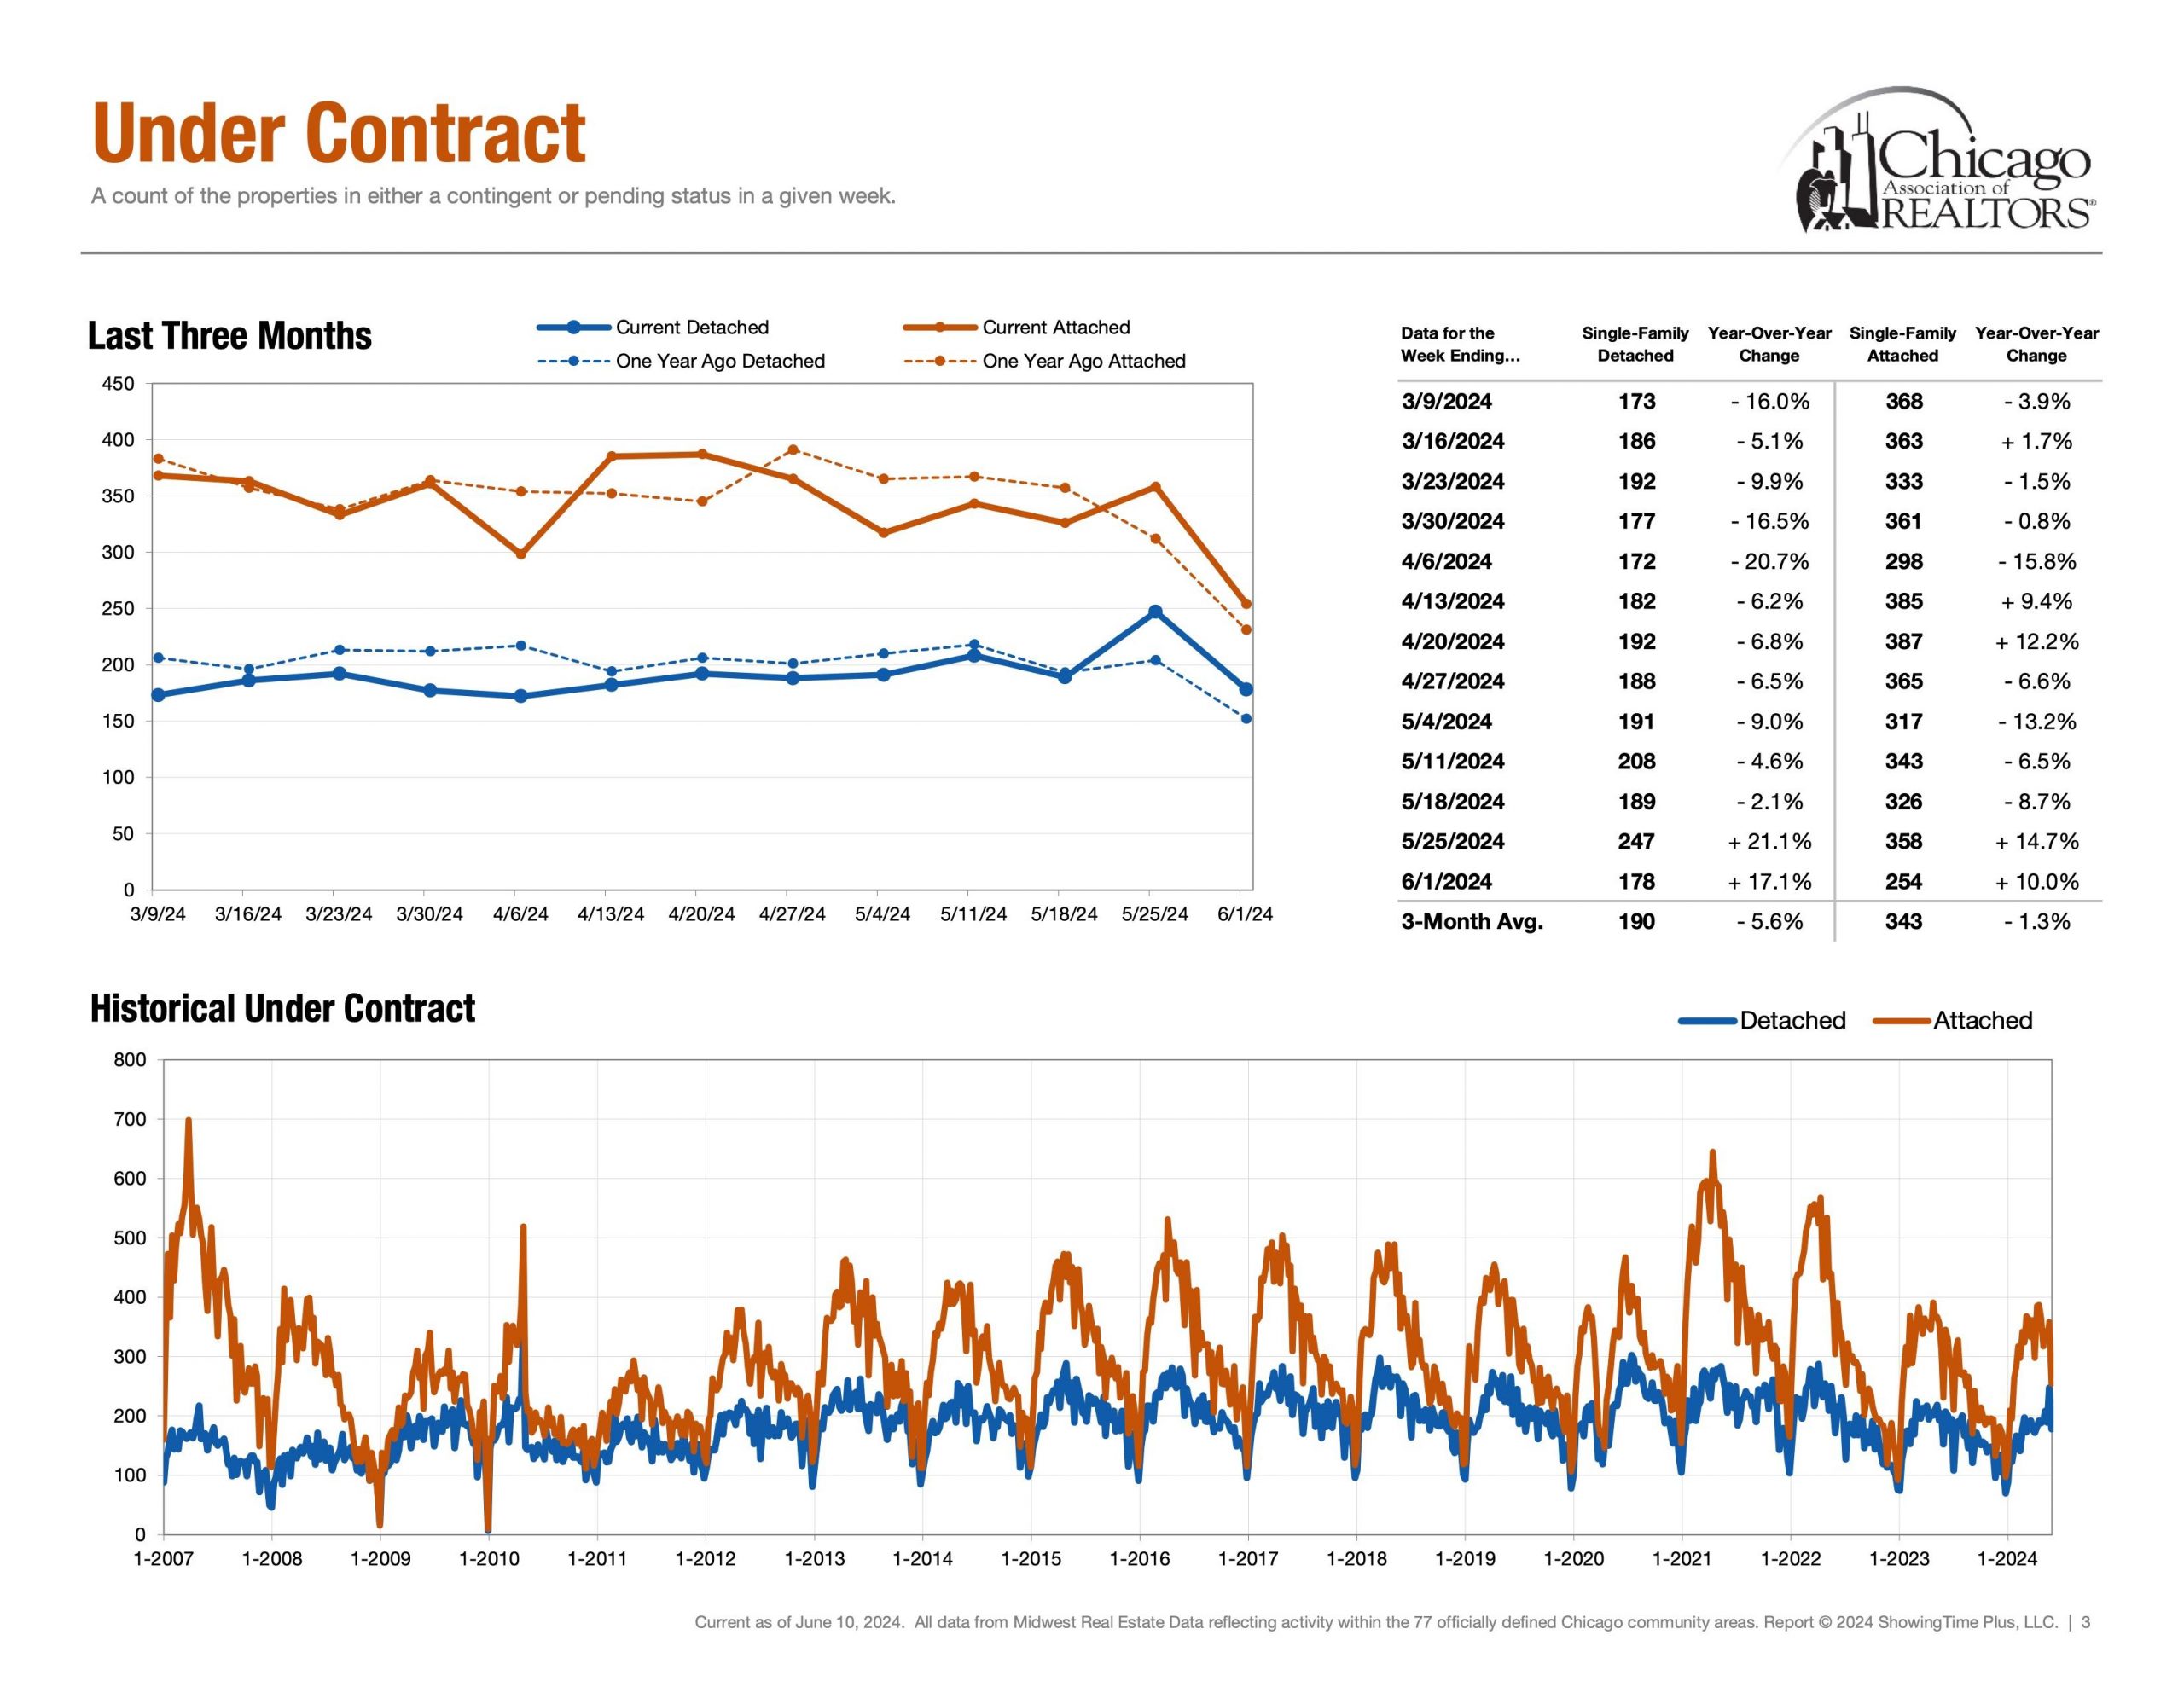
Detached Single = 178 Properties (May 26th – June 1st)

Attached Single = 254 Properties (May 26th – June 1st)

Secondly, under contract helps answer the question, “In our current market, how many buyers are buying?” Showcasing the heartbeat of the real estate market. Interestingly, demand metrics become more insightful when compared and contrasted with supply/inventory metrics.


Supply | Inventory of Homes for Sale


Detached Single = 1,943 Properties (May 26th – June 1st)

Attached Single = 3,033 Properties (May 26th – June 1st)

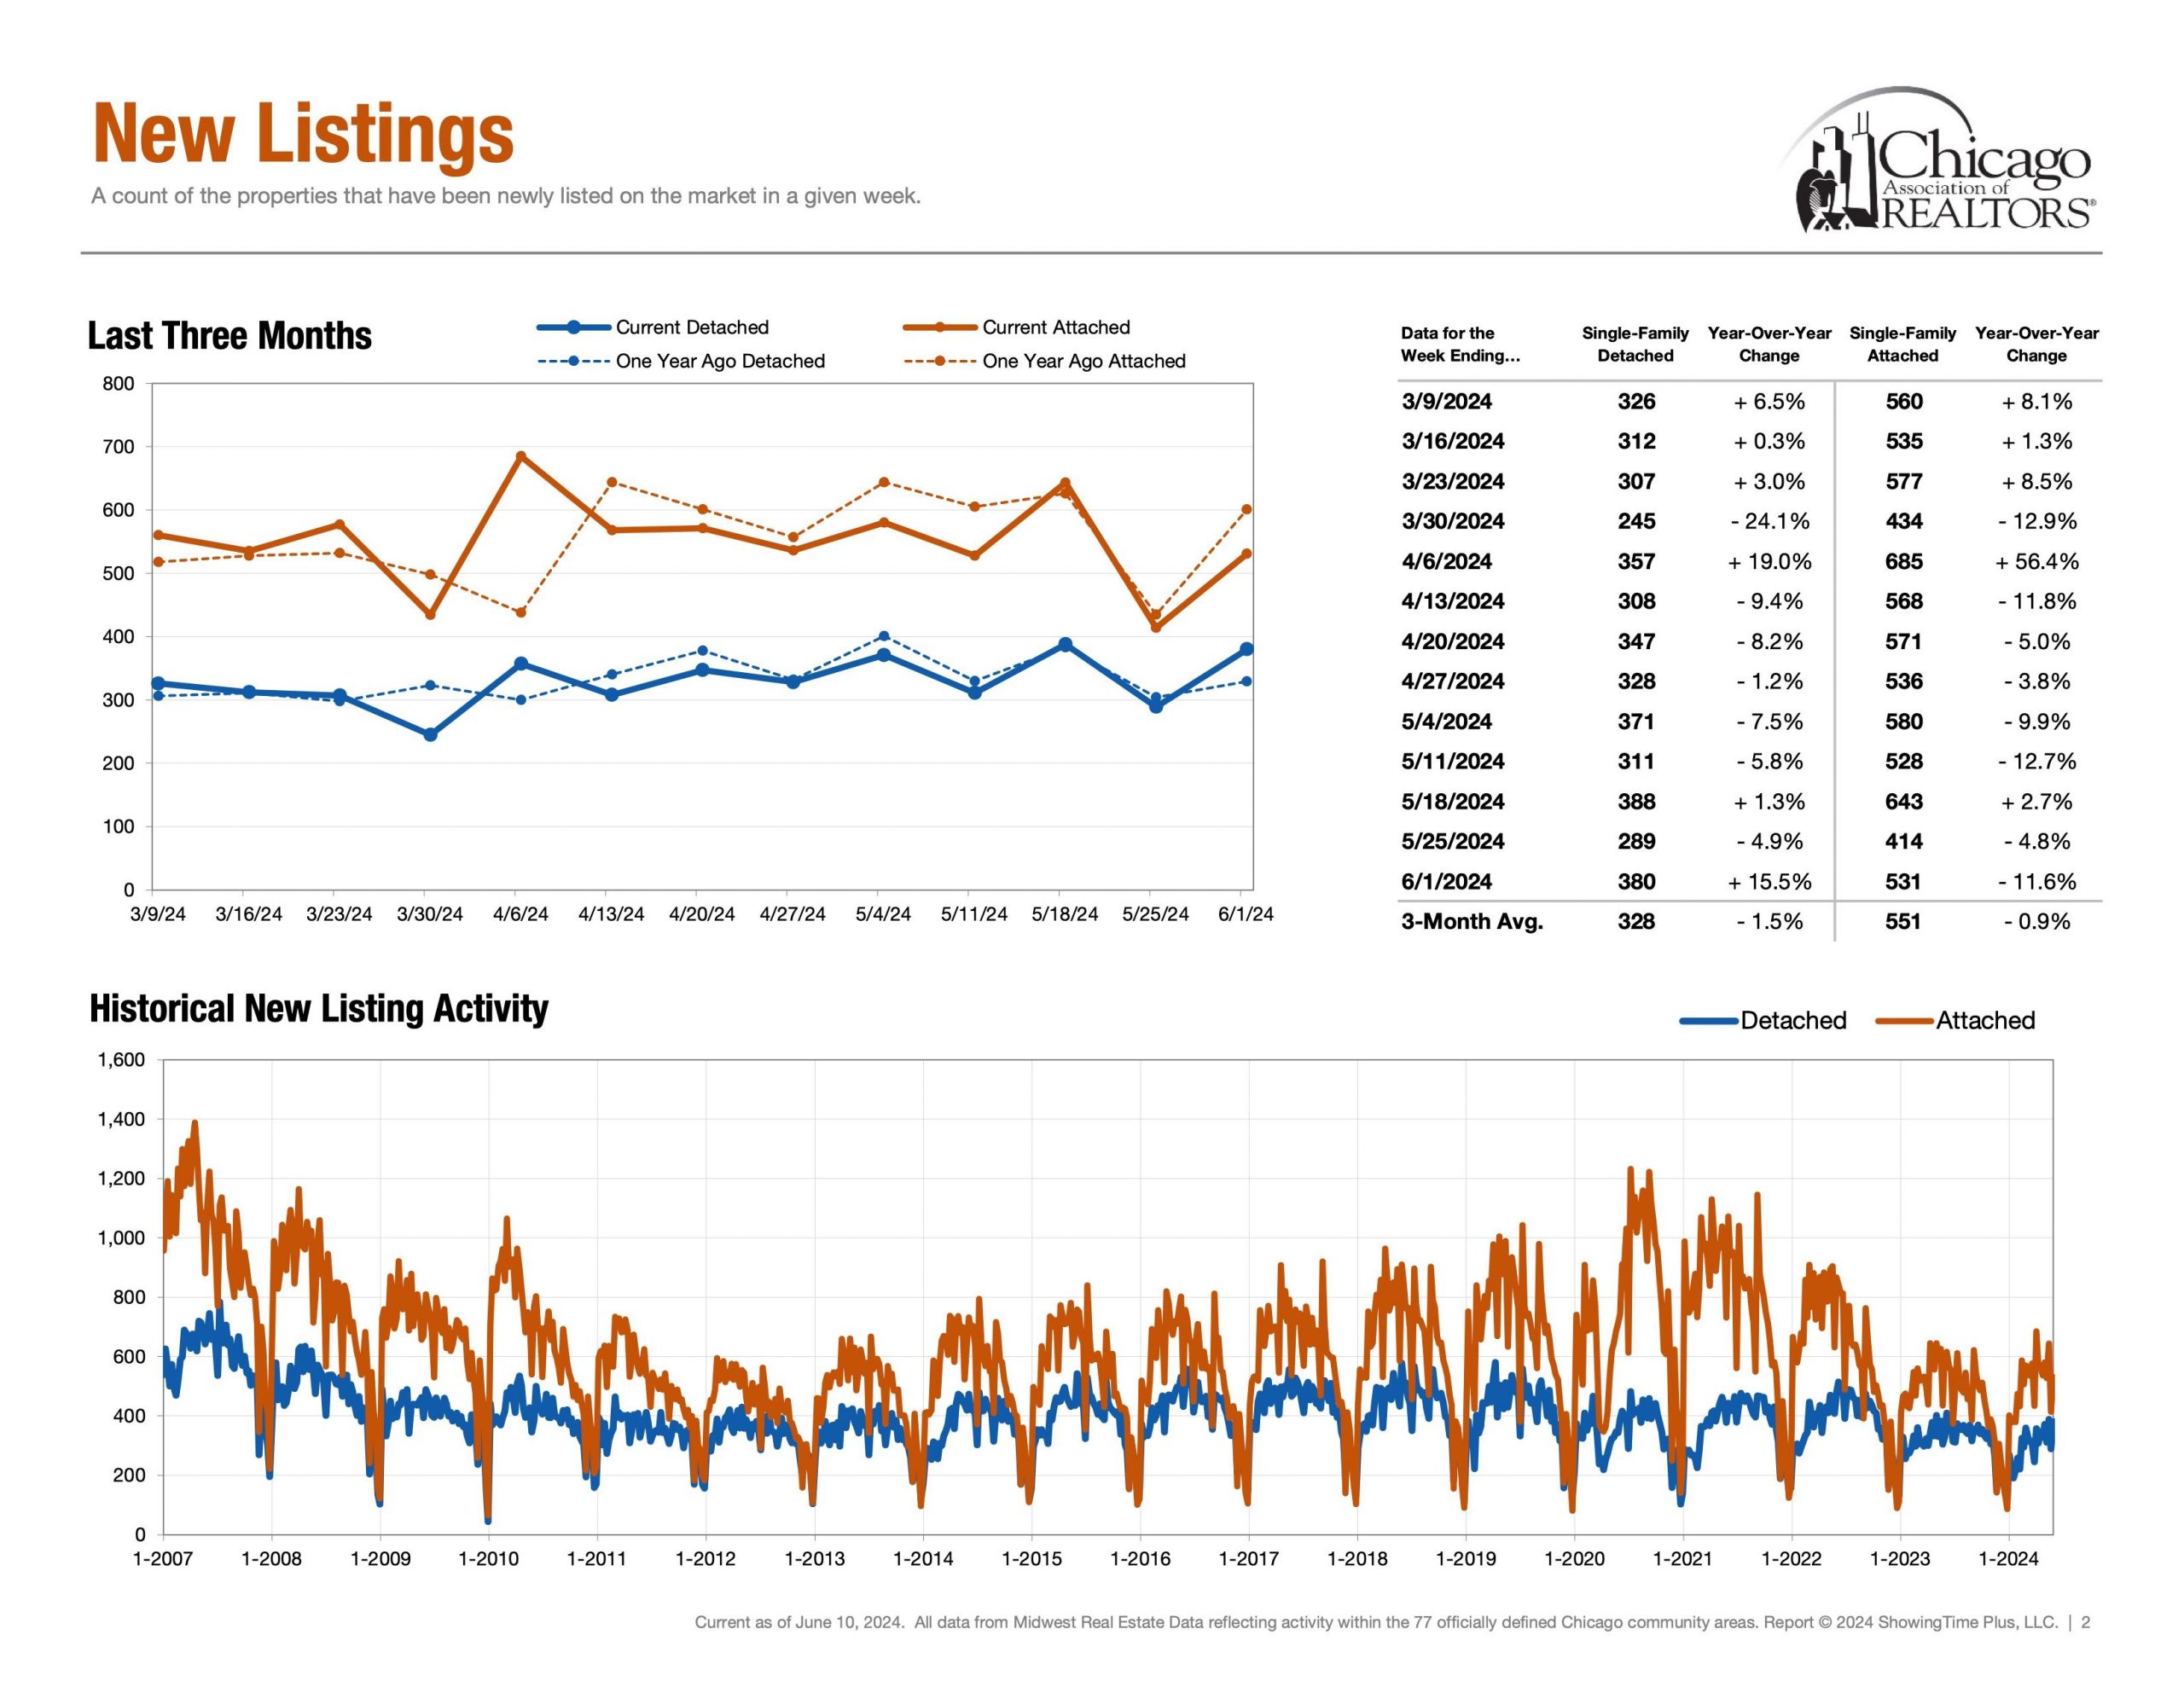
Next, supply showcases how much inventory is available for buyers and how much competition sellers are up against. Additionally, Months of Inventory, Homes for Sale, New Listings and Absorption Rate are also other key metrics in the conversation of supply.


Negotiations | Percentage of Original List Price Received


Detached Single ~ 97.4% (Rolling 12 Months Avg) & ~ 98.4% (May 24′)

Attached Single ~ 98.4% (Rolling 12 Months Avg) & ~ 99.5% (May 24′)

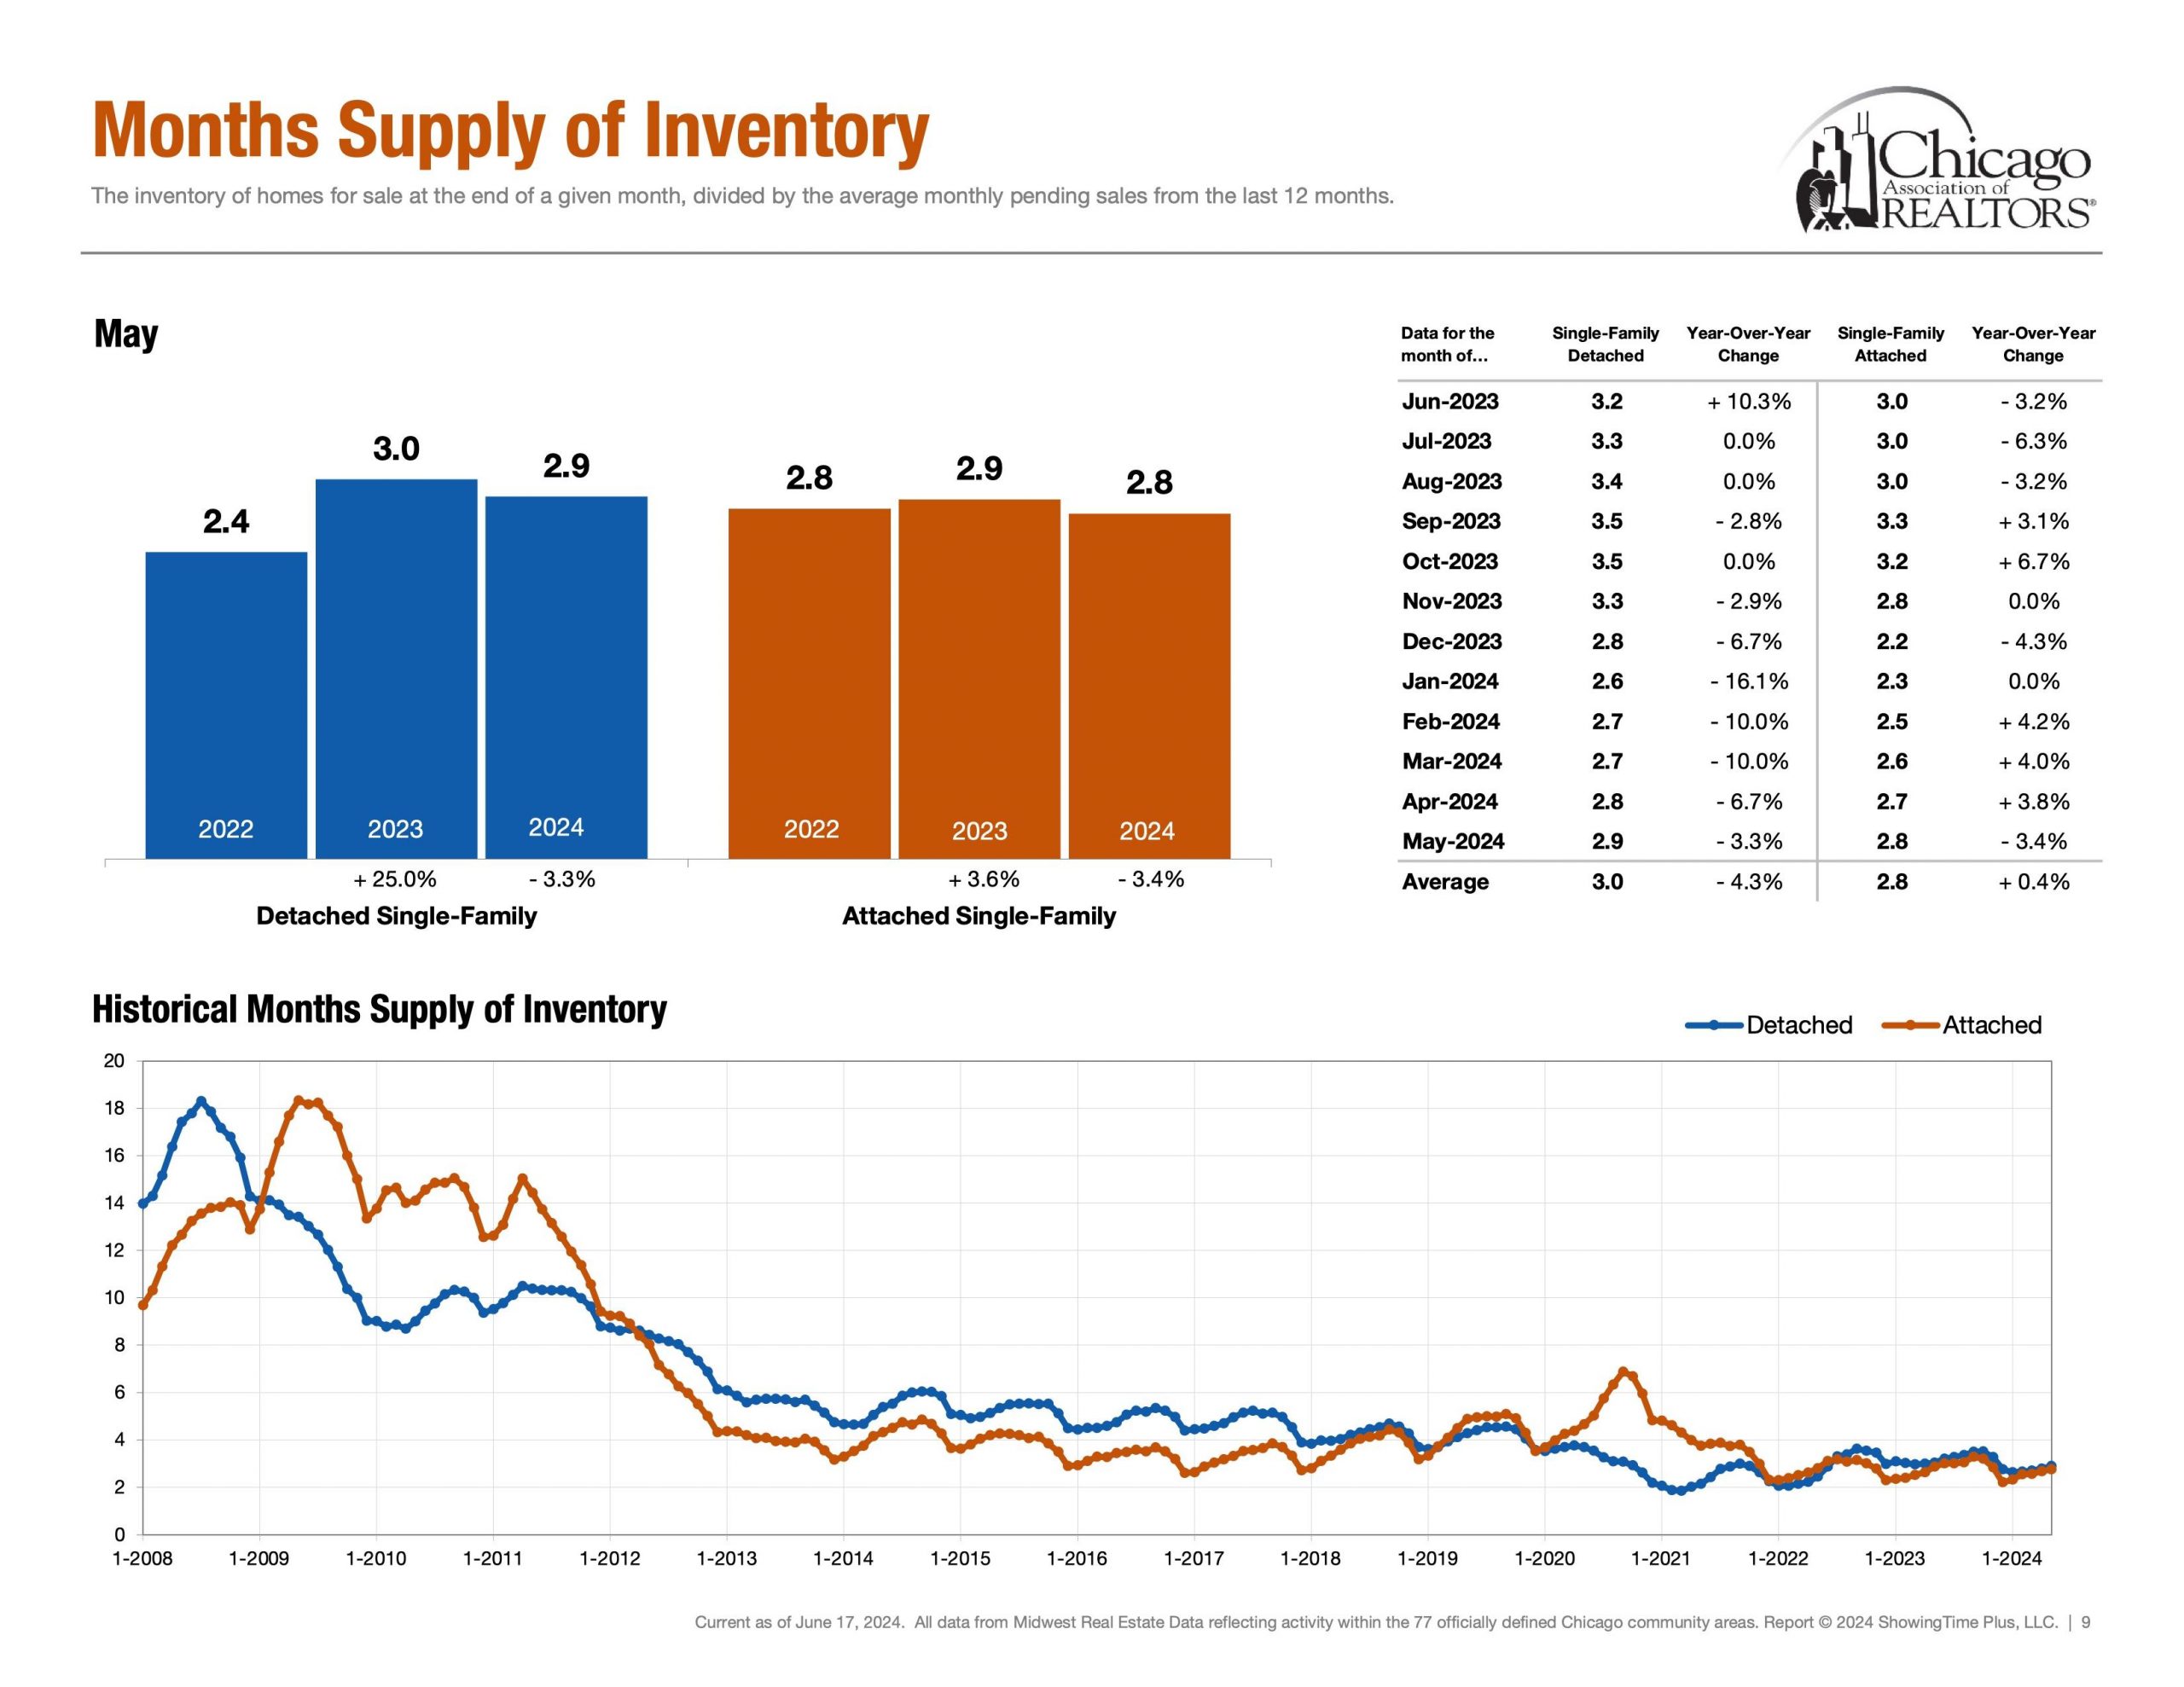
Lastly, Percentage of Original List Price Received to Closed Price is a metric that showcases what the average accepted purchase price is relative to the list price. How much below asking price can an offer go while still getting accepted? How much would one have to offer above ask in order to be an above average purchase price?


The End | Have A Great Day!

Please note all of these metrics are along a spectrum as opposed to a specific number. Below is “The Weekly Market Activity Report” which is a research tool reflecting residential real estate activity within the 77 officially defined Chicago community areas provided by the Chicago Association of Realtors®. It is essential to keep in mind that real estate markets can vary across neighborhoods and property types within a city. In conclusion, economic conditions and external factors can influence market trends. Staying updated on these metrics and trends is crucial for making informed decisions. 


How Is The Chicago Real Estate Market? May 25, 2024

How Is the Chicago Real Estate Market? Week 21

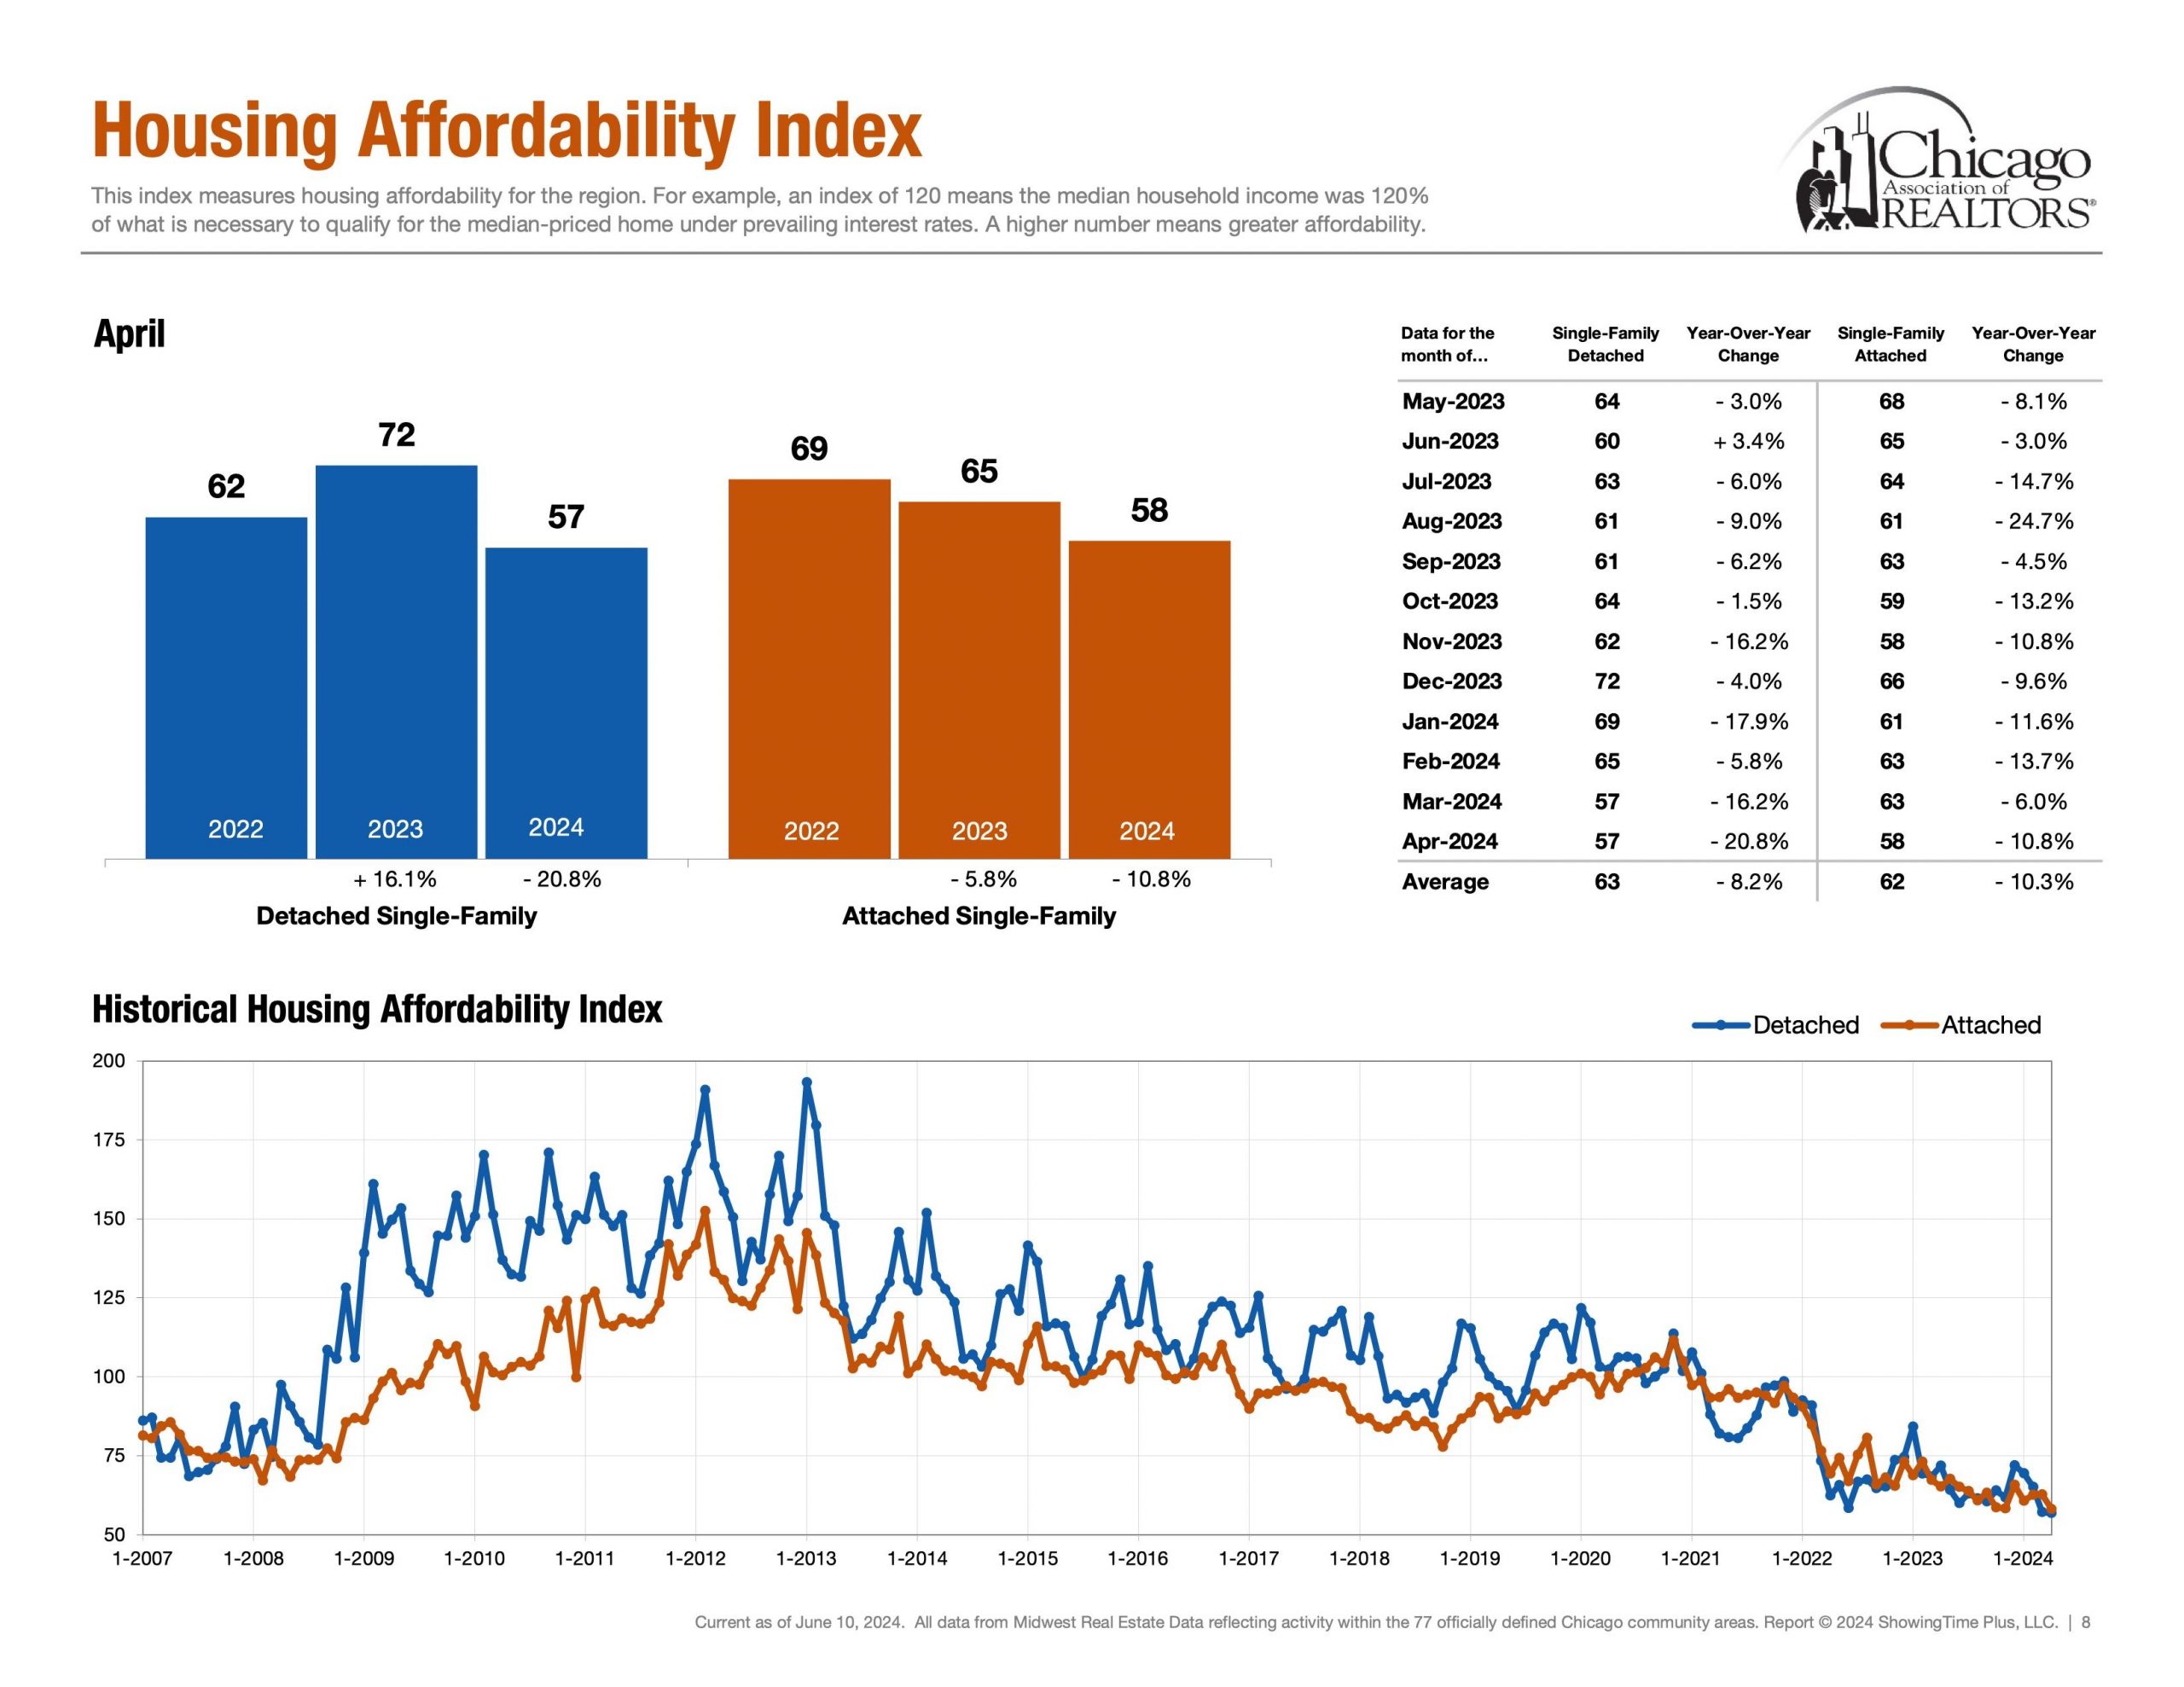
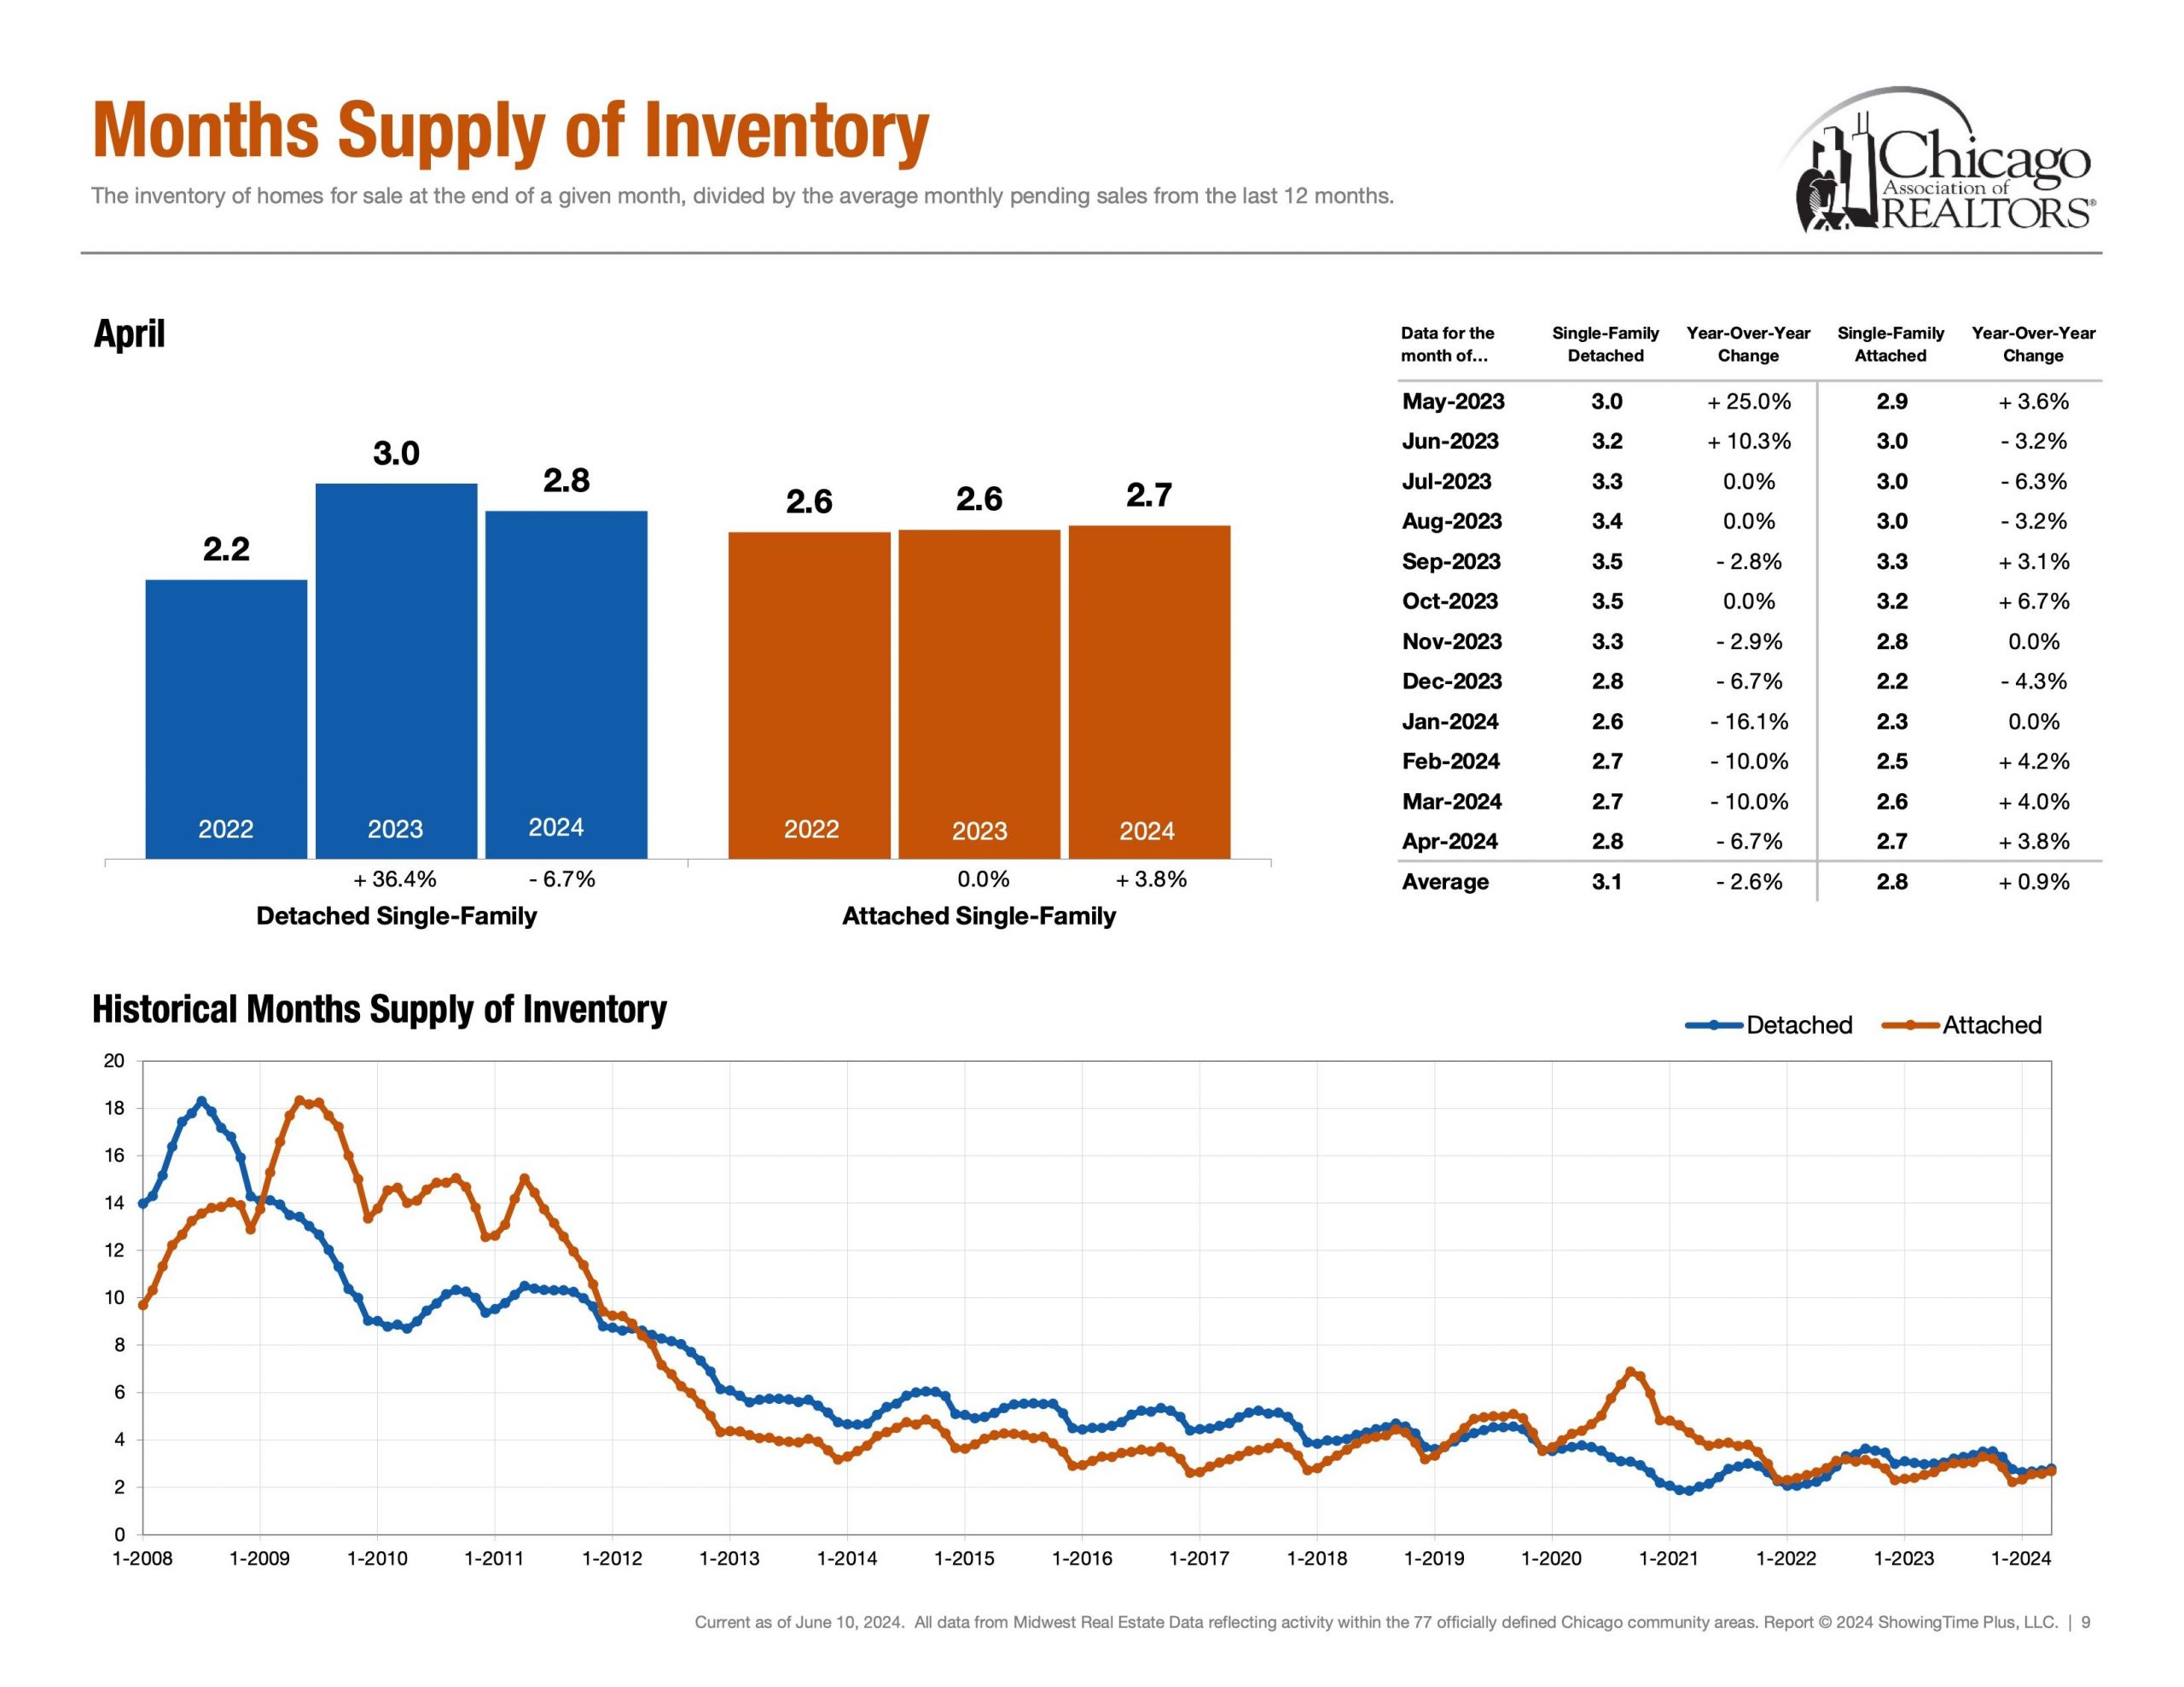
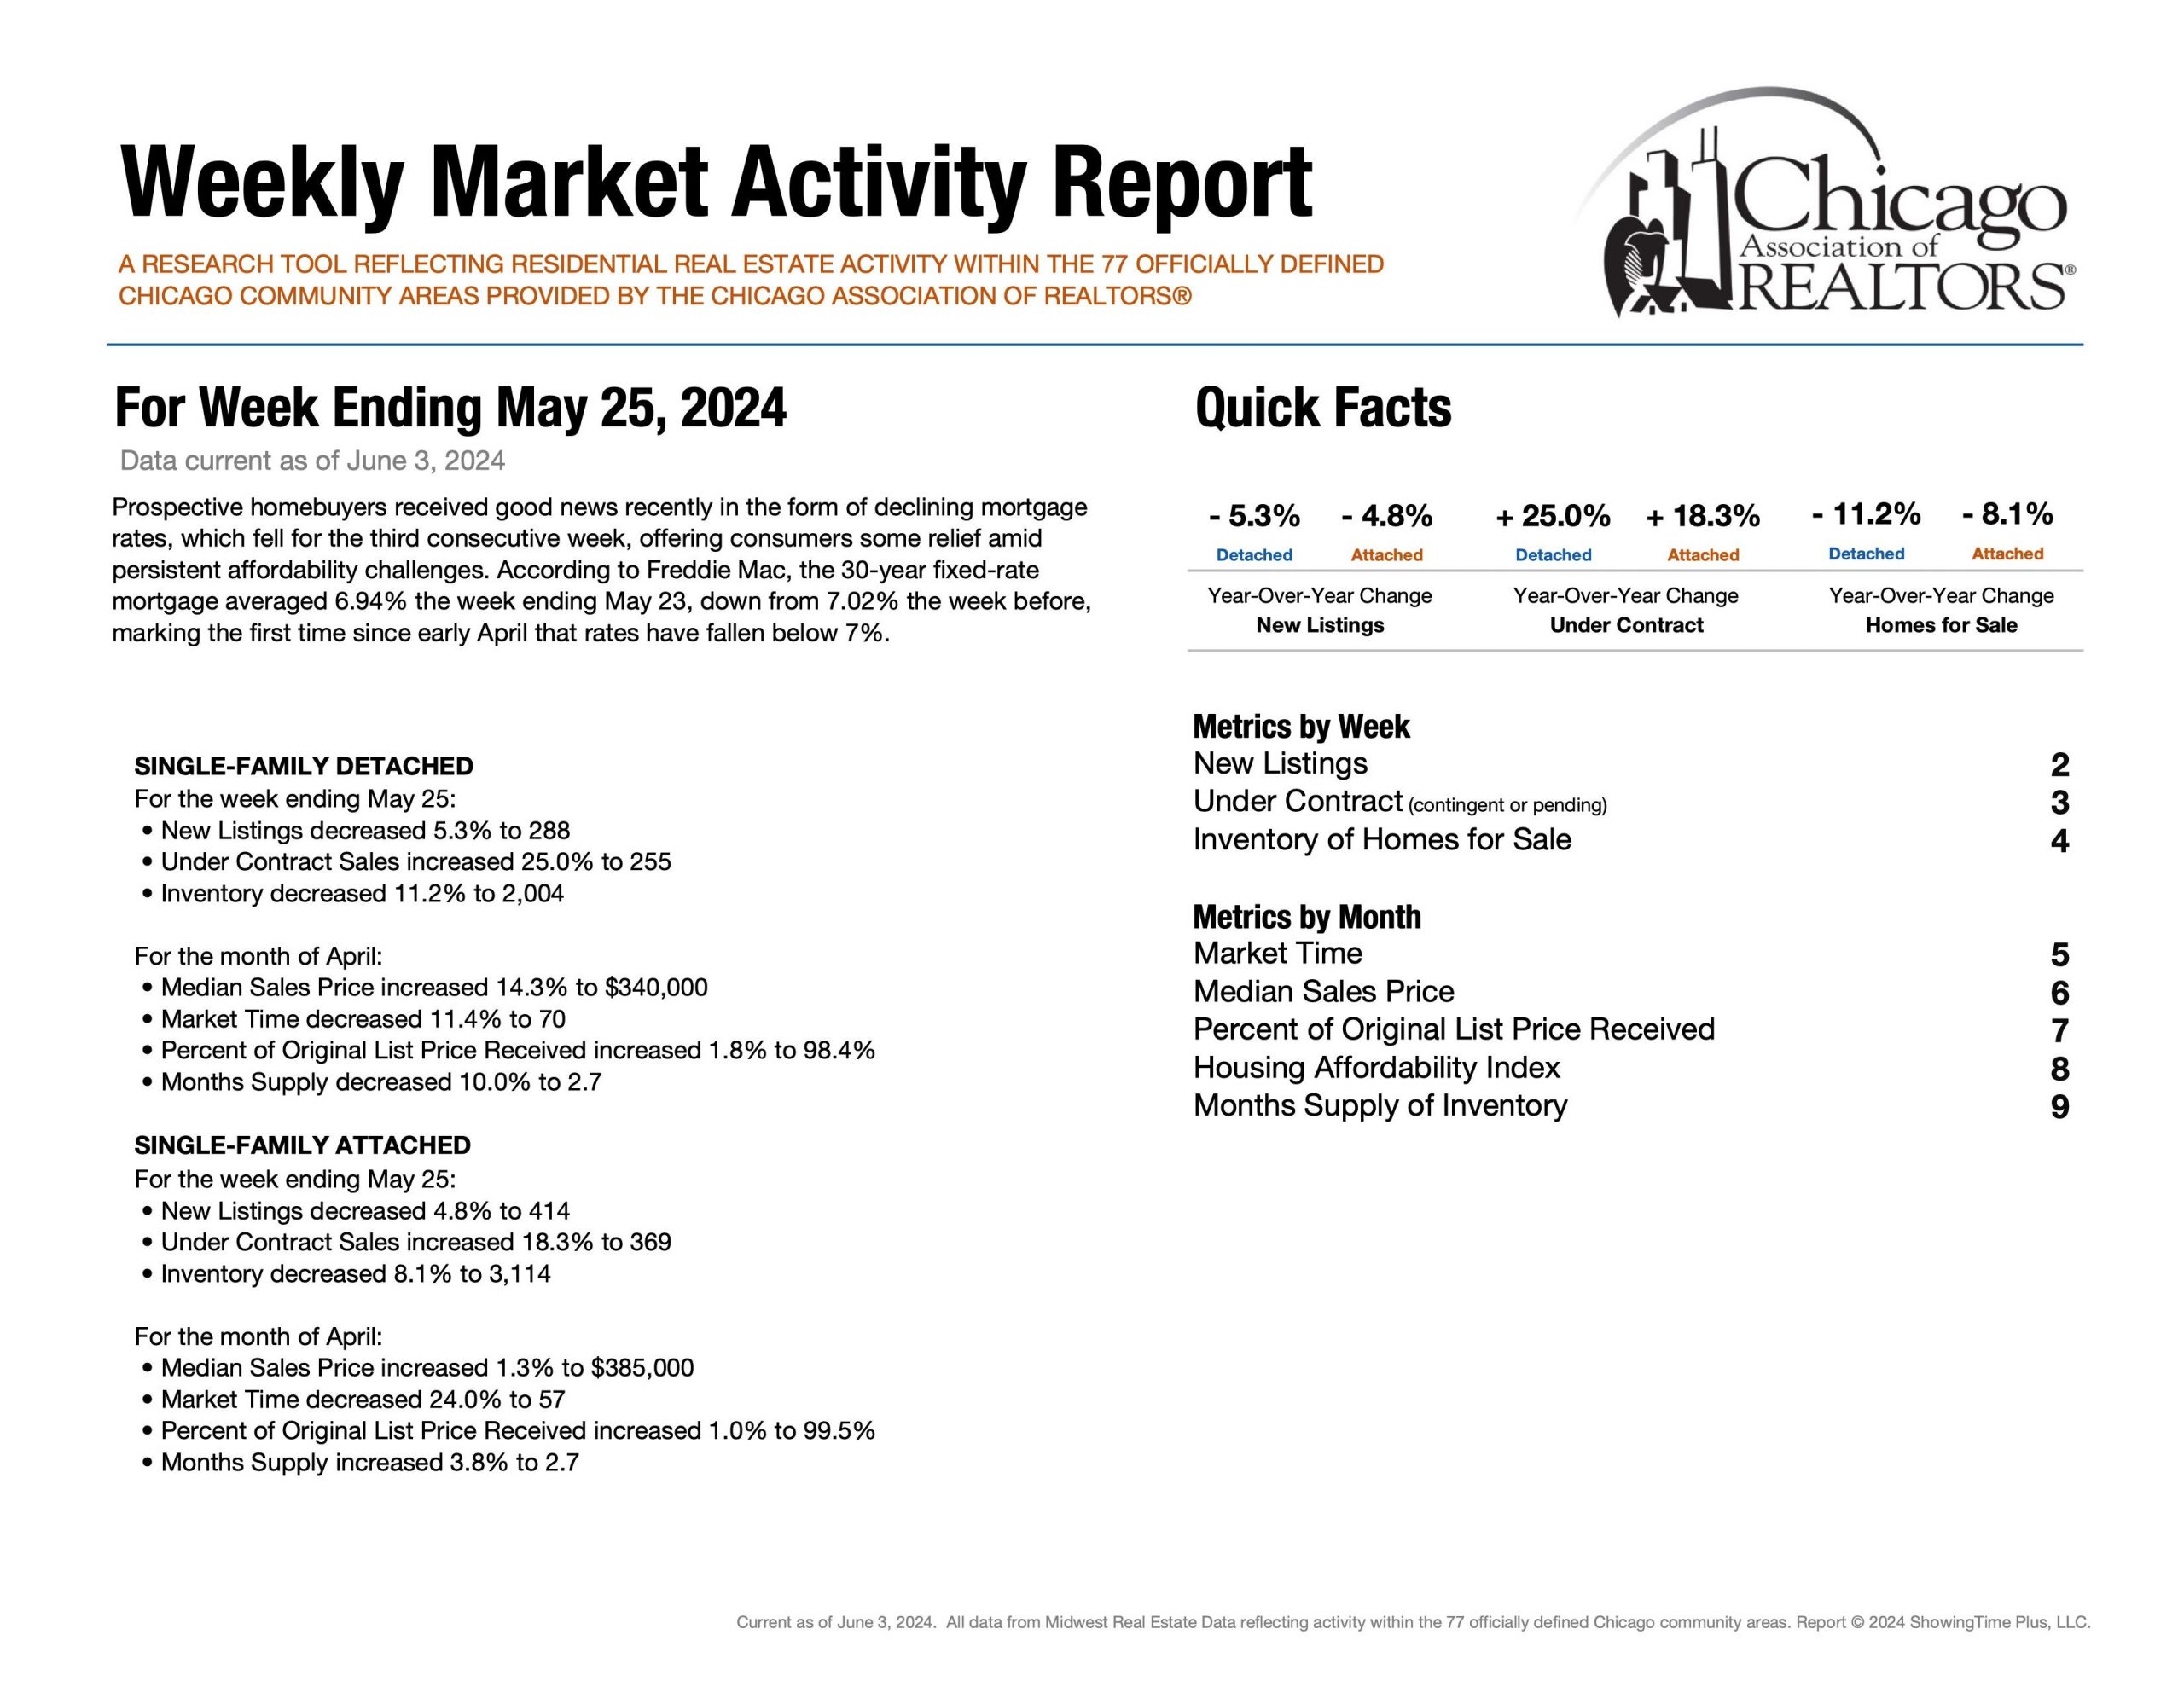
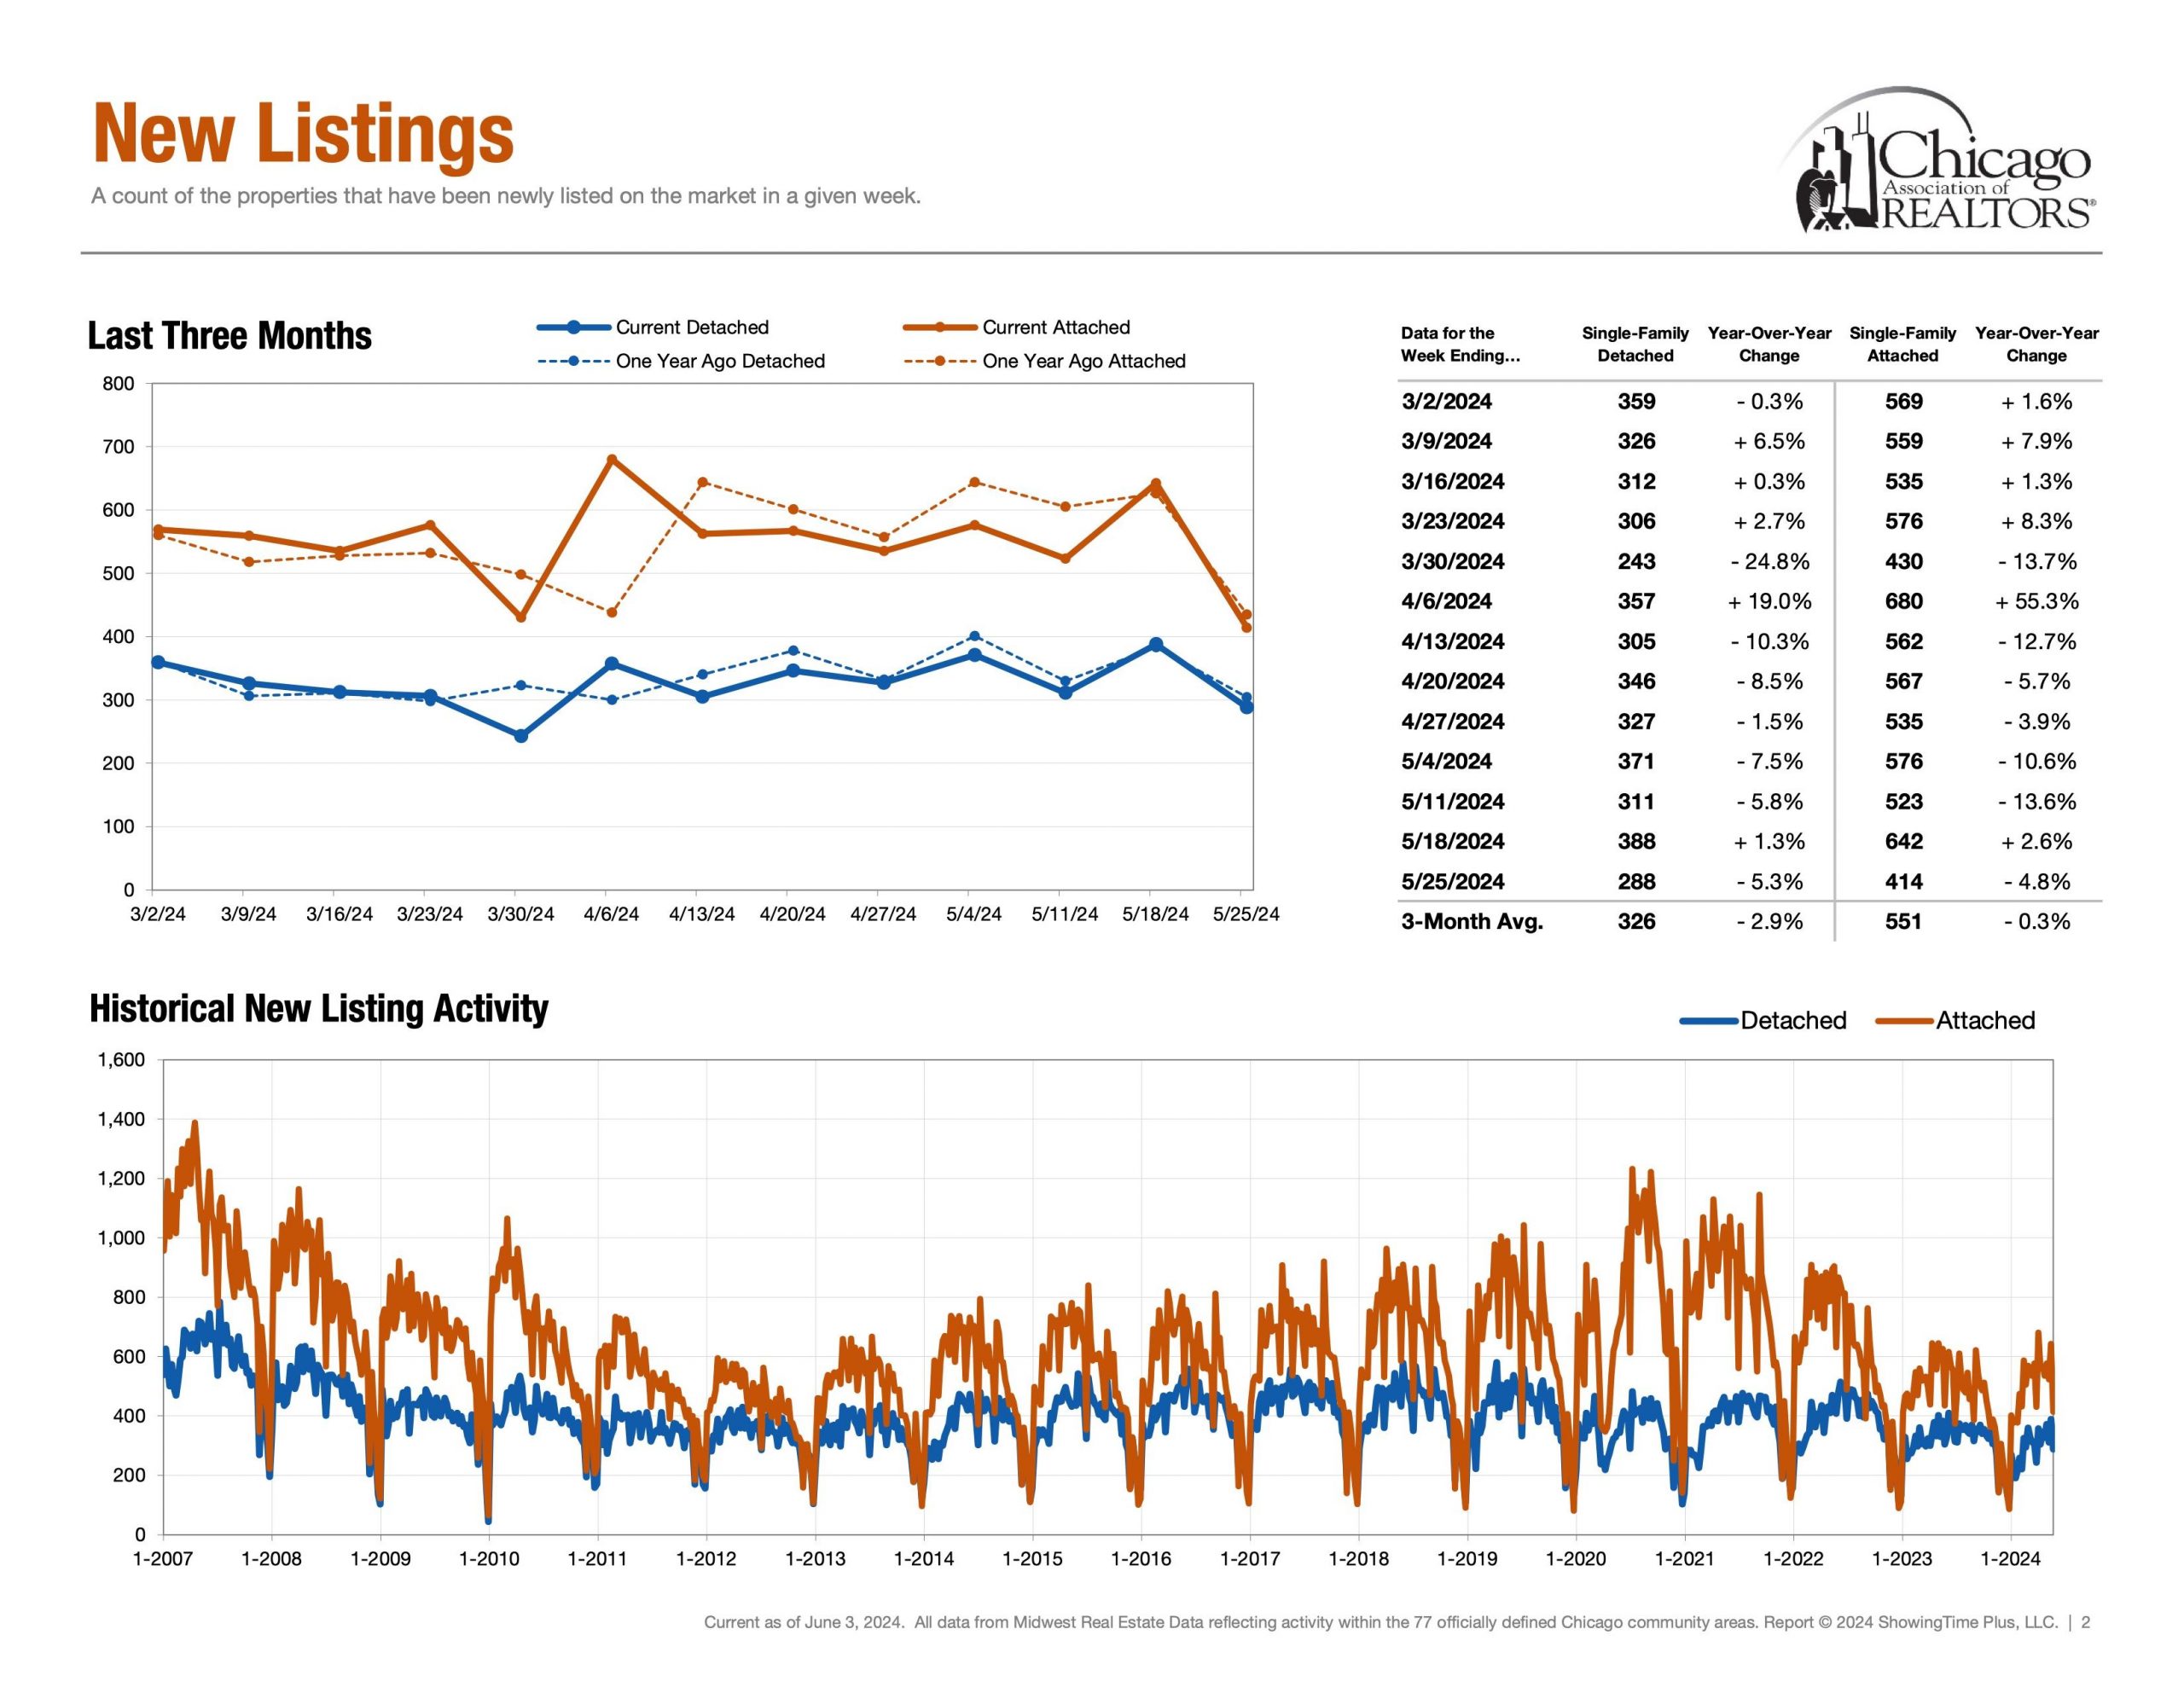
May 2024 Week 21

Matthew Litzenberger a third generation Realtor with Coldwell Banker Realty helps buyers and sellers understand Chicago Real Estate Market metrics. Follow along for weekly updates on all things Chicago Real Estate by clicking here.


Introduction

Hello and welcome back to the 21st installment in our weekly series aimed to help understand current Chicago Real Estate Market Metrics. While there are many metrics to talk about in the world of real estate, today we are going to look at only four: speed, demand, supply and negotiations. Let’s get started!


Speed | Healthy Market Time Range


Detached Single ~ 70 Days (April 24′)

Attached Single ~ 57 Days (April 24′)


First, market time is metric that showcases speed and whether a listing was priced too low, priced properly or priced too high. If a listing surpasses average days on market, it is a check engine light that your listing maybe overpriced.


Demand | Under Contract


Detached Single = 255 Properties (May 19th – May 25th)

Attached Single = 369 Properties (May 19th – May 25th)

Secondly, under contract helps answer the question, “In our current market, how many buyers are buying?” Showcasing the heartbeat of the real estate market. Interestingly, demand metrics become more insightful when compared and contrasted with supply/inventory metrics.


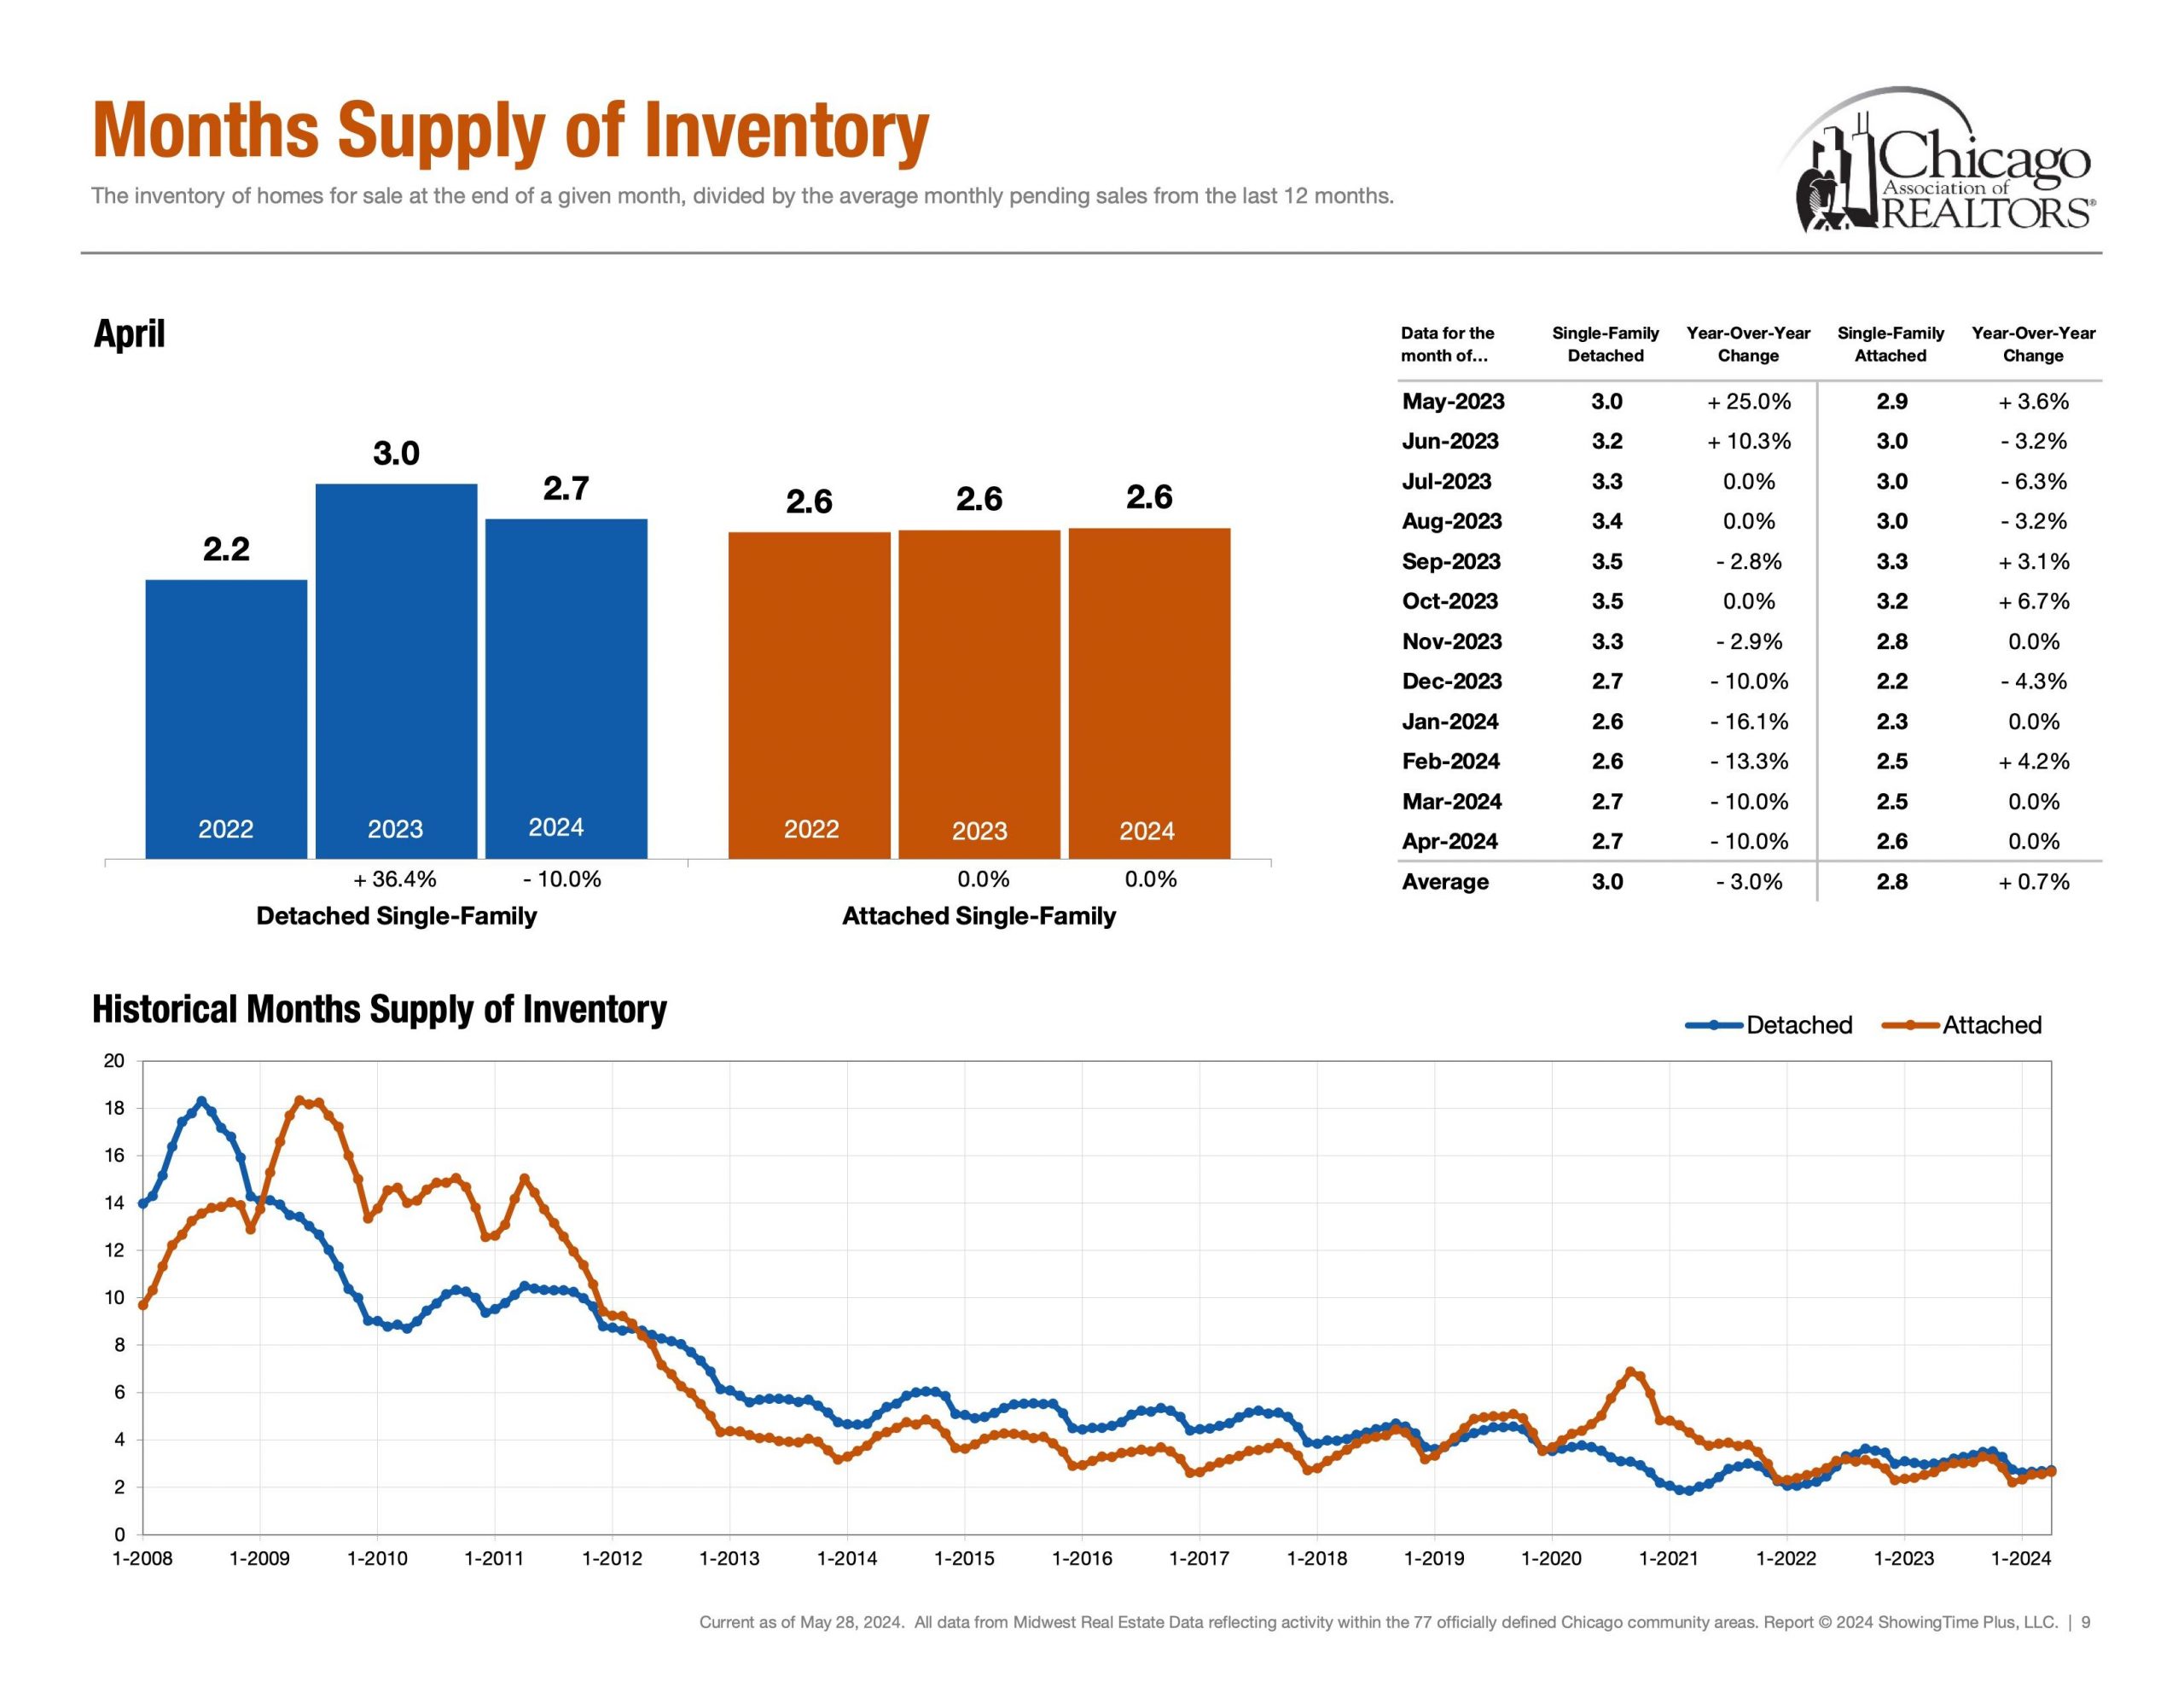
Supply | Inventory of Homes for Sale


Detached Single = 2,004 Properties (May 19th – May 25th)

Attached Single = 3,114 Properties (May 19th – May 25th)

Next, supply showcases how much inventory is available for buyers and how much competition sellers are up against. Additionally, Months of Inventory, Homes for Sale, New Listings and Absorption Rate are also other key metrics in the conversation of supply.


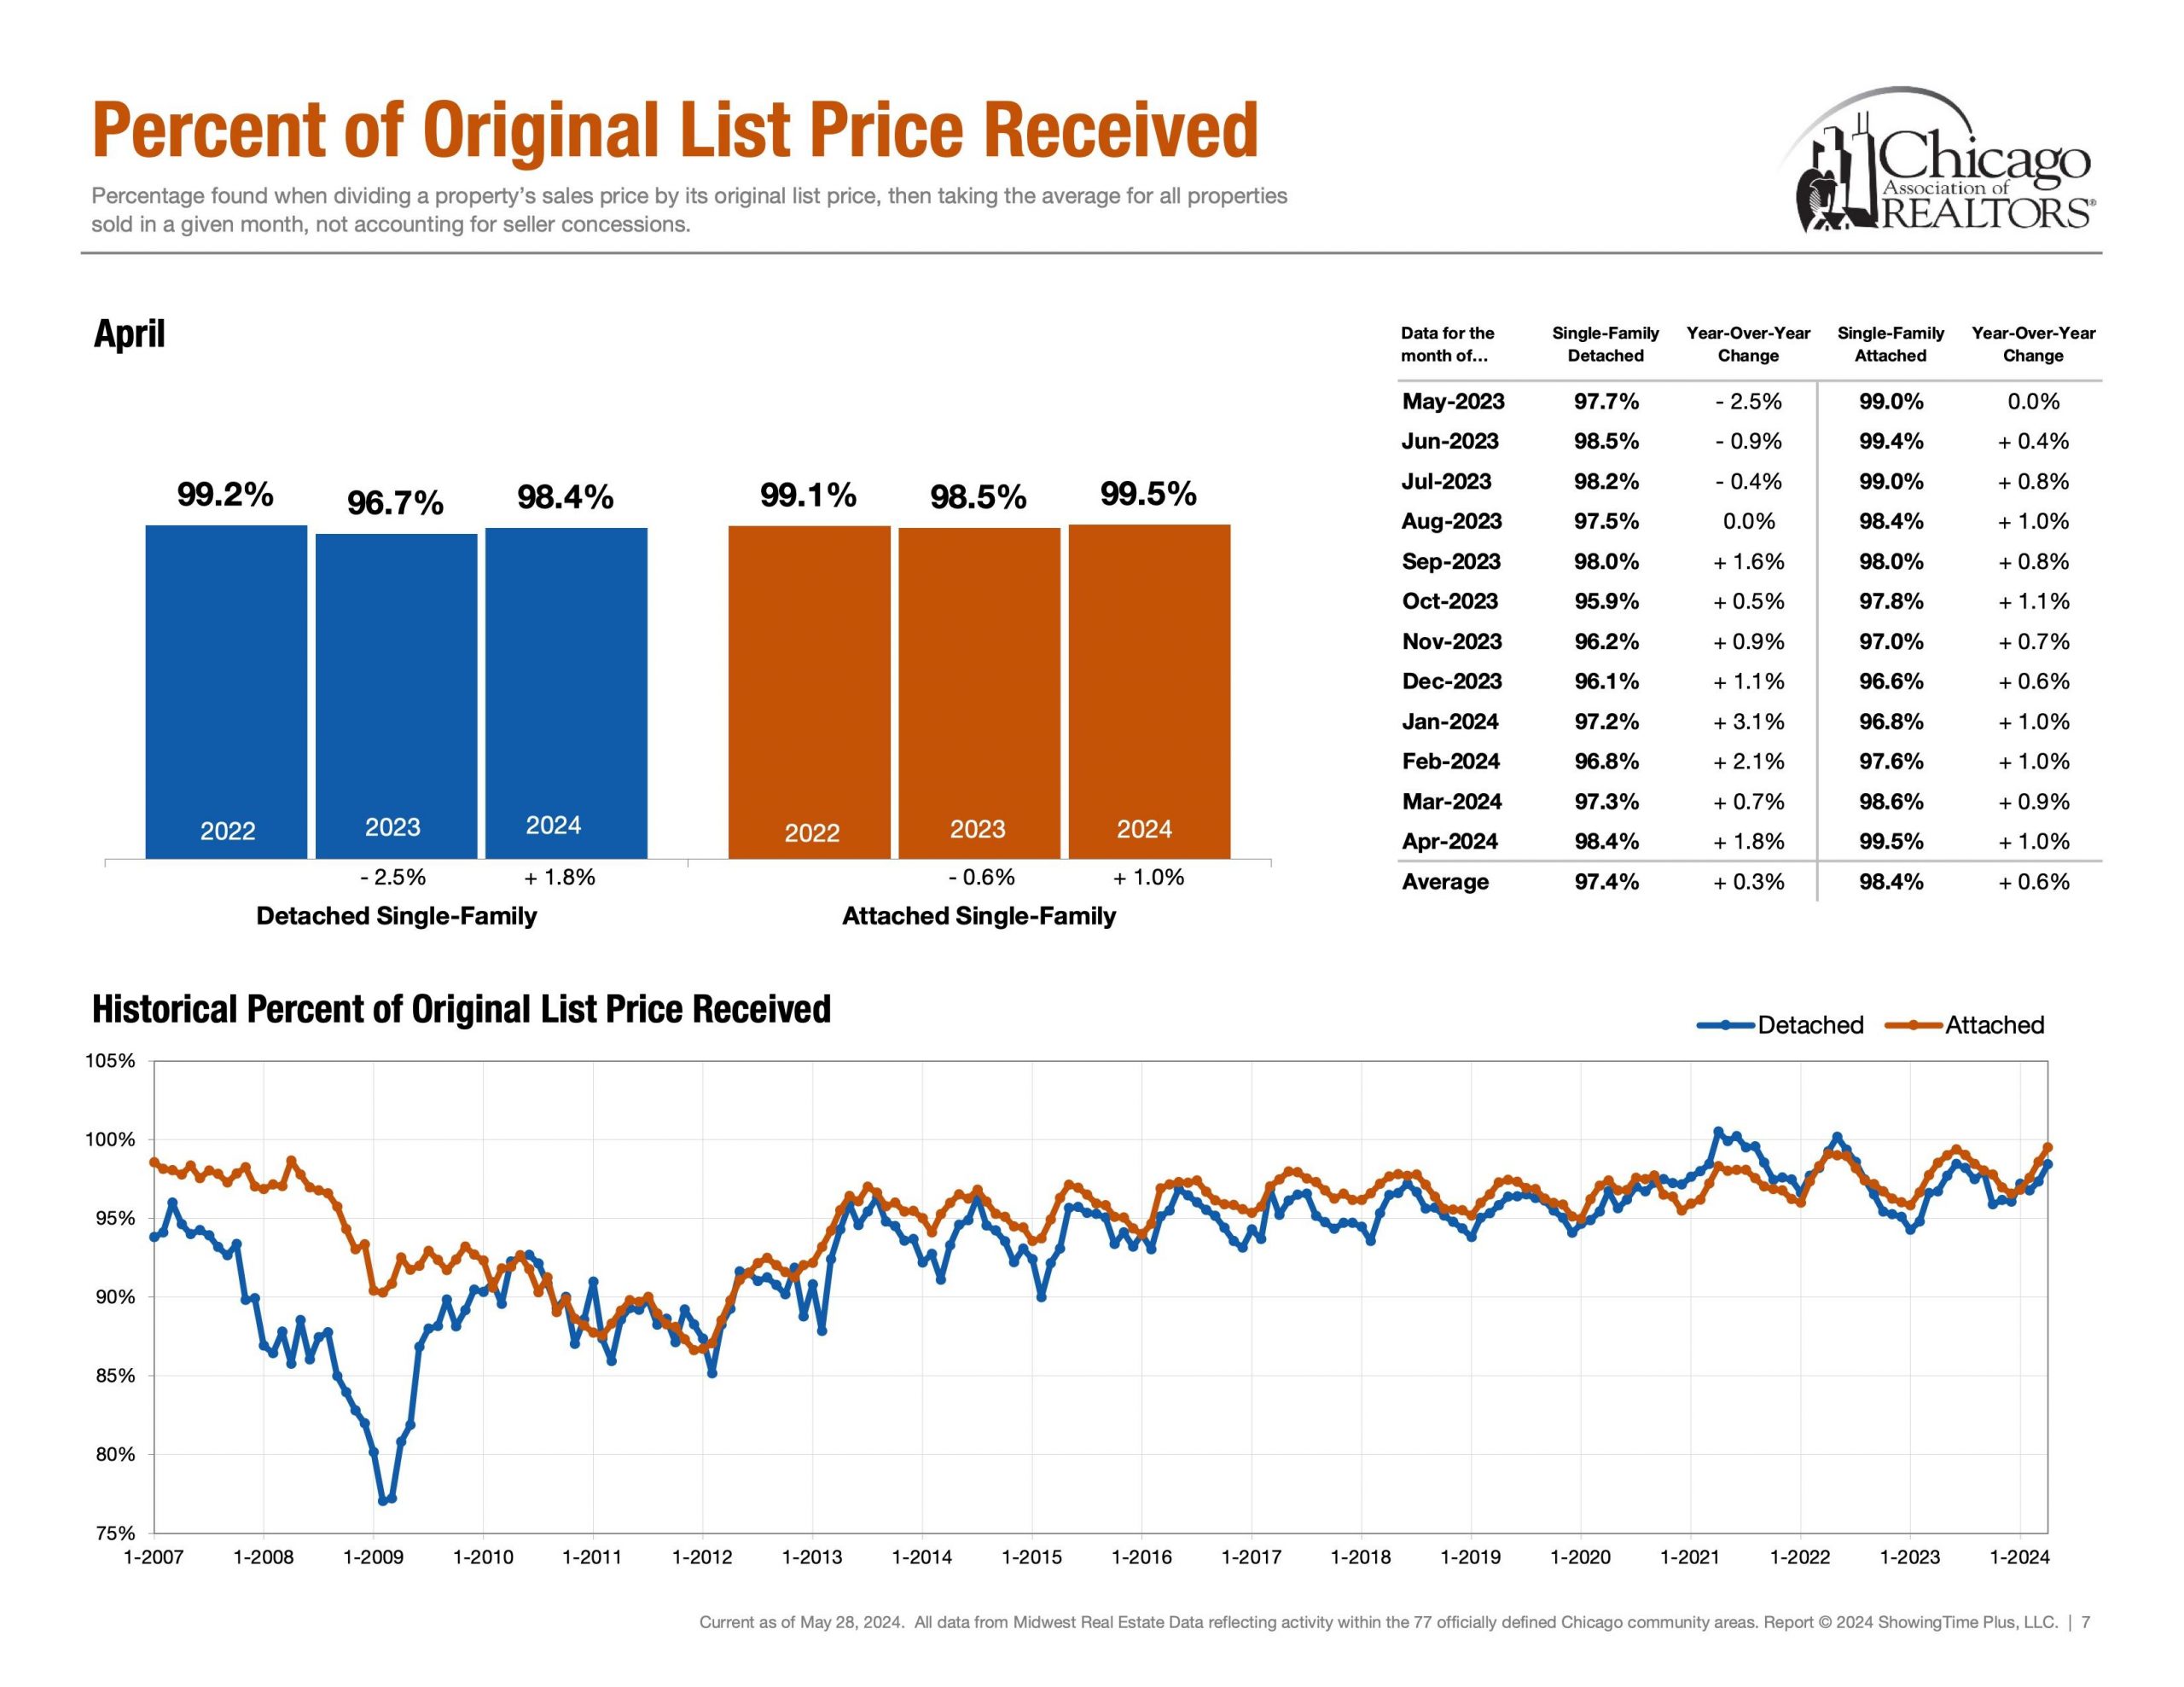
Negotiations | Percentage of Original List Price Received


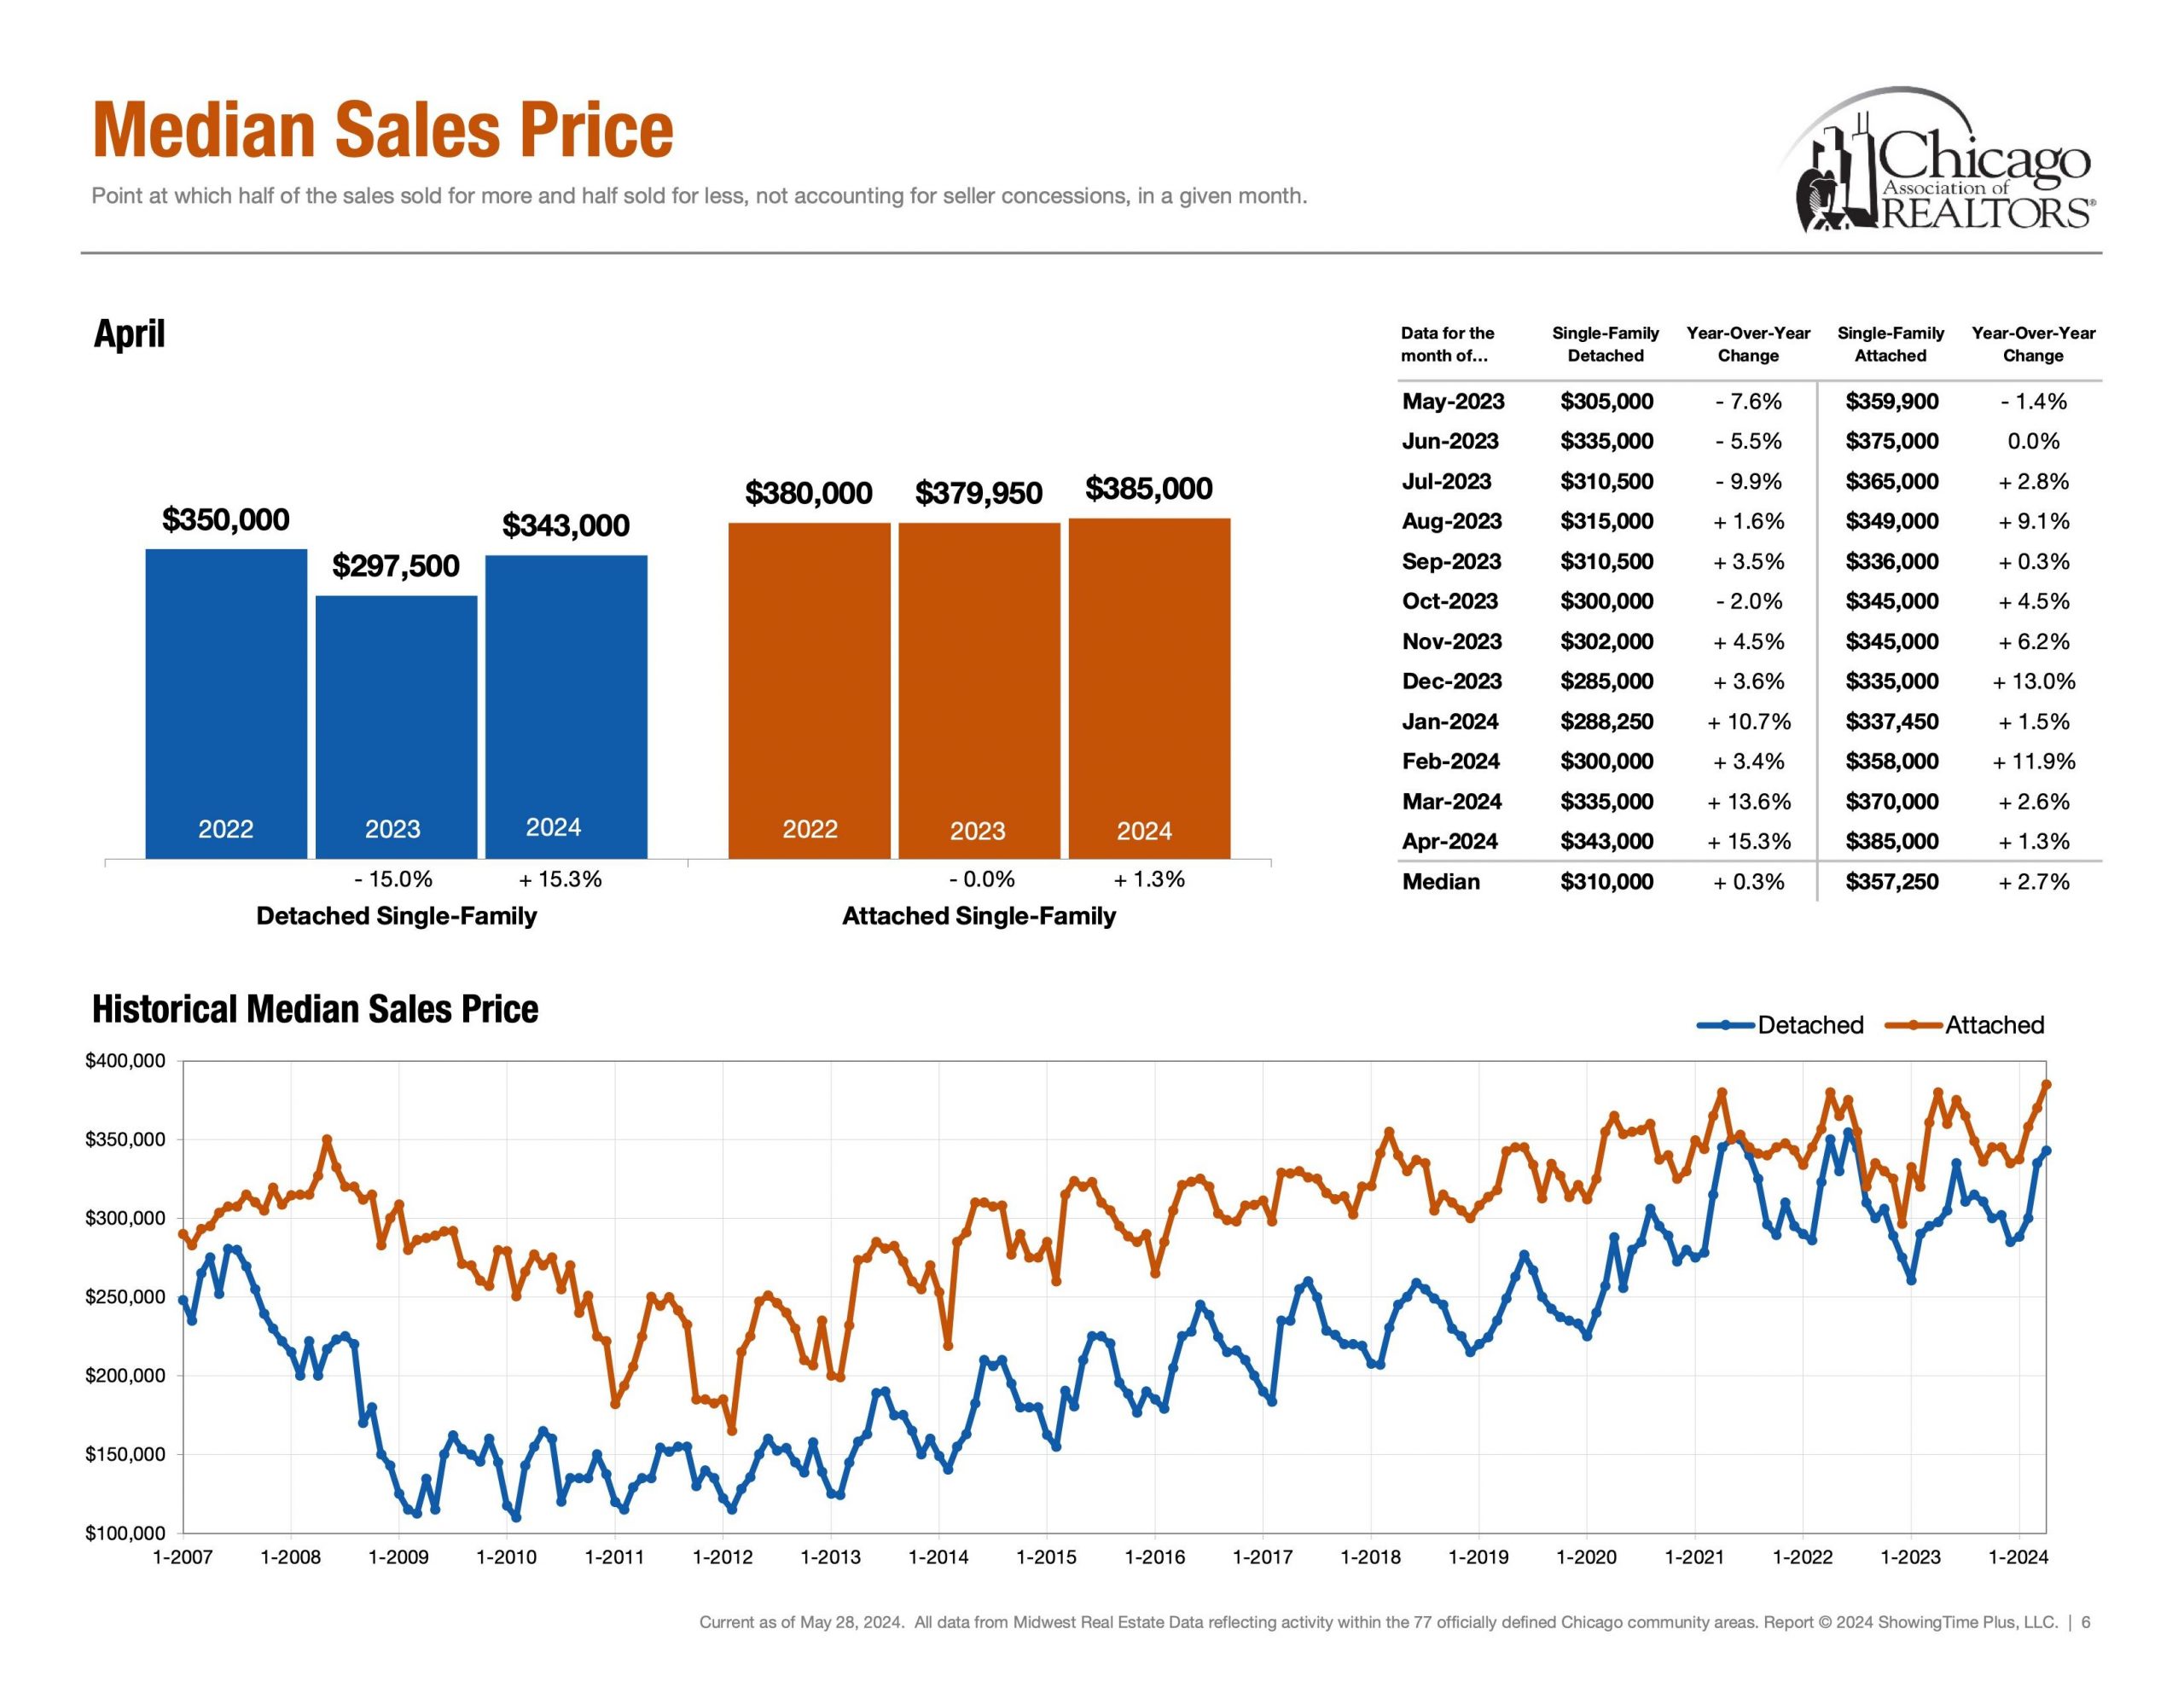
Detached Single ~ 97.4% (Rolling 12 Months Avg) & ~ 98.4% (April 24′)

Attached Single ~ 98.4% (Rolling 12 Months Avg) & ~ 99.5% (April 24′)

Lastly, Percentage of Original List Price Received to Closed Price is a metric that showcases what the average accepted purchase price is relative to the list price. How much below asking price can an offer go while still getting accepted? How much would one have to offer above ask in order to be an above average purchase price?


The End | Have A Great Day!

Please note all of these metrics are along a spectrum as opposed to a specific number. Below is “The Weekly Market Activity Report” which is a research tool reflecting residential real estate activity within the 77 officially defined Chicago community areas provided by the Chicago Association of Realtors®. It is essential to keep in mind that real estate markets can vary across neighborhoods and property types within a city. In conclusion, economic conditions and external factors can influence market trends. Staying updated on these metrics and trends is crucial for making informed decisions. 


How Is The Chicago Real Estate Market? May 18, 2024

How Is the Chicago Real Estate Market? Week 20
May 2024 Week 20

Matthew Litzenberger a third generation Realtor with Coldwell Banker Realty helps buyers and sellers understand Chicago Real Estate Market metrics. Follow along for weekly updates on all things Chicago Real Estate by clicking here.


Introduction

Hello and welcome back to the 20th installment in our weekly series aimed to help understand current Chicago Real Estate Market Metrics. While there are many metrics to talk about in the world of real estate, today we are going to look at only four: speed, demand, supply and negotiations. Let’s get started!


Speed | Healthy Market Time Range


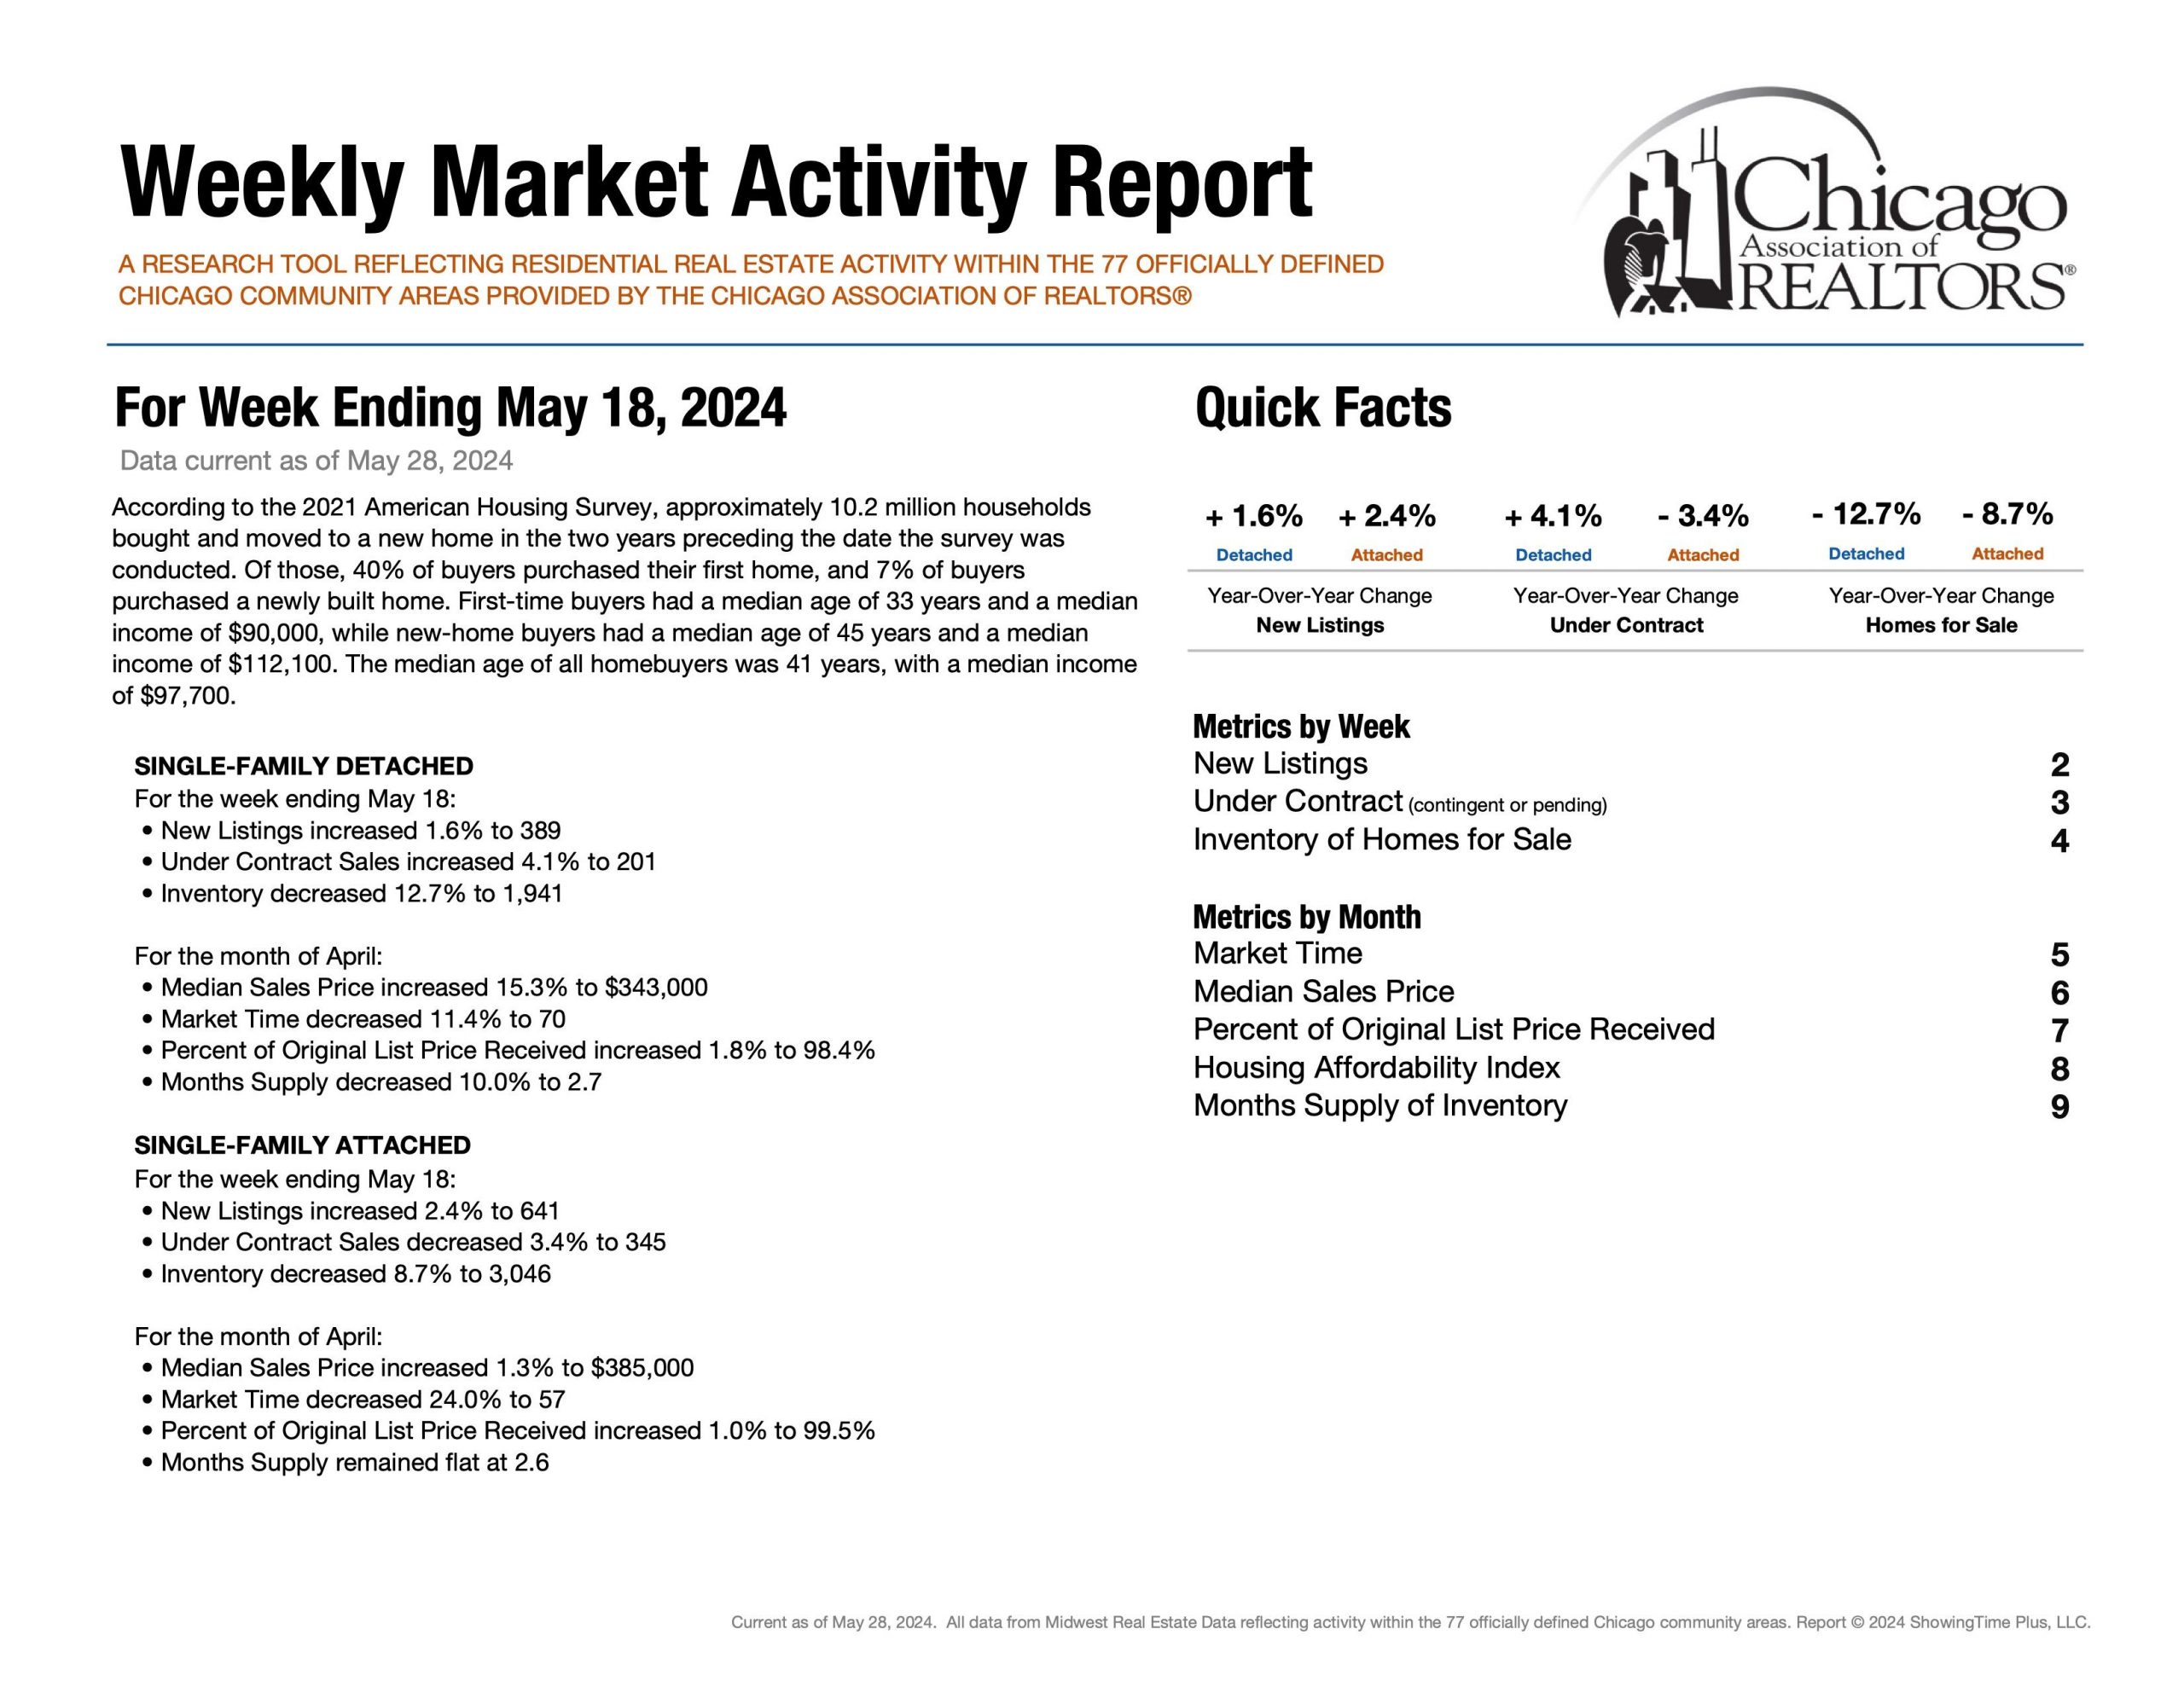
Detached Single ~ 70 Days (April 24′)

Attached Single ~ 57 Days (April 24′)


First, market time is metric that showcases speed and whether a listing was priced too low, priced properly or priced too high. If a listing surpasses average days on market, it is a check engine light that your listing maybe overpriced.


Demand | Under Contract


Detached Single = 201 Properties (May 12th – May 18th)

Attached Single = 345 Properties (May 12th – May 18th)

Secondly, under contract helps answer the question, “In our current market, how many buyers are buying?” Showcasing the heartbeat of the real estate market. Interestingly, demand metrics become more insightful when compared and contrasted with supply/inventory metrics.


Supply | Inventory of Homes for Sale


Detached Single = 1,941 Properties (May 12th – May 18th)

Attached Single = 3,046 Properties (May 12th – May 18th)

Next, supply showcases how much inventory is available for buyers and how much competition sellers are up against. Additionally, Months of Inventory, Homes for Sale, New Listings and Absorption Rate are also other key metrics in the conversation of supply.


Negotiations | Percentage of Original List Price Received


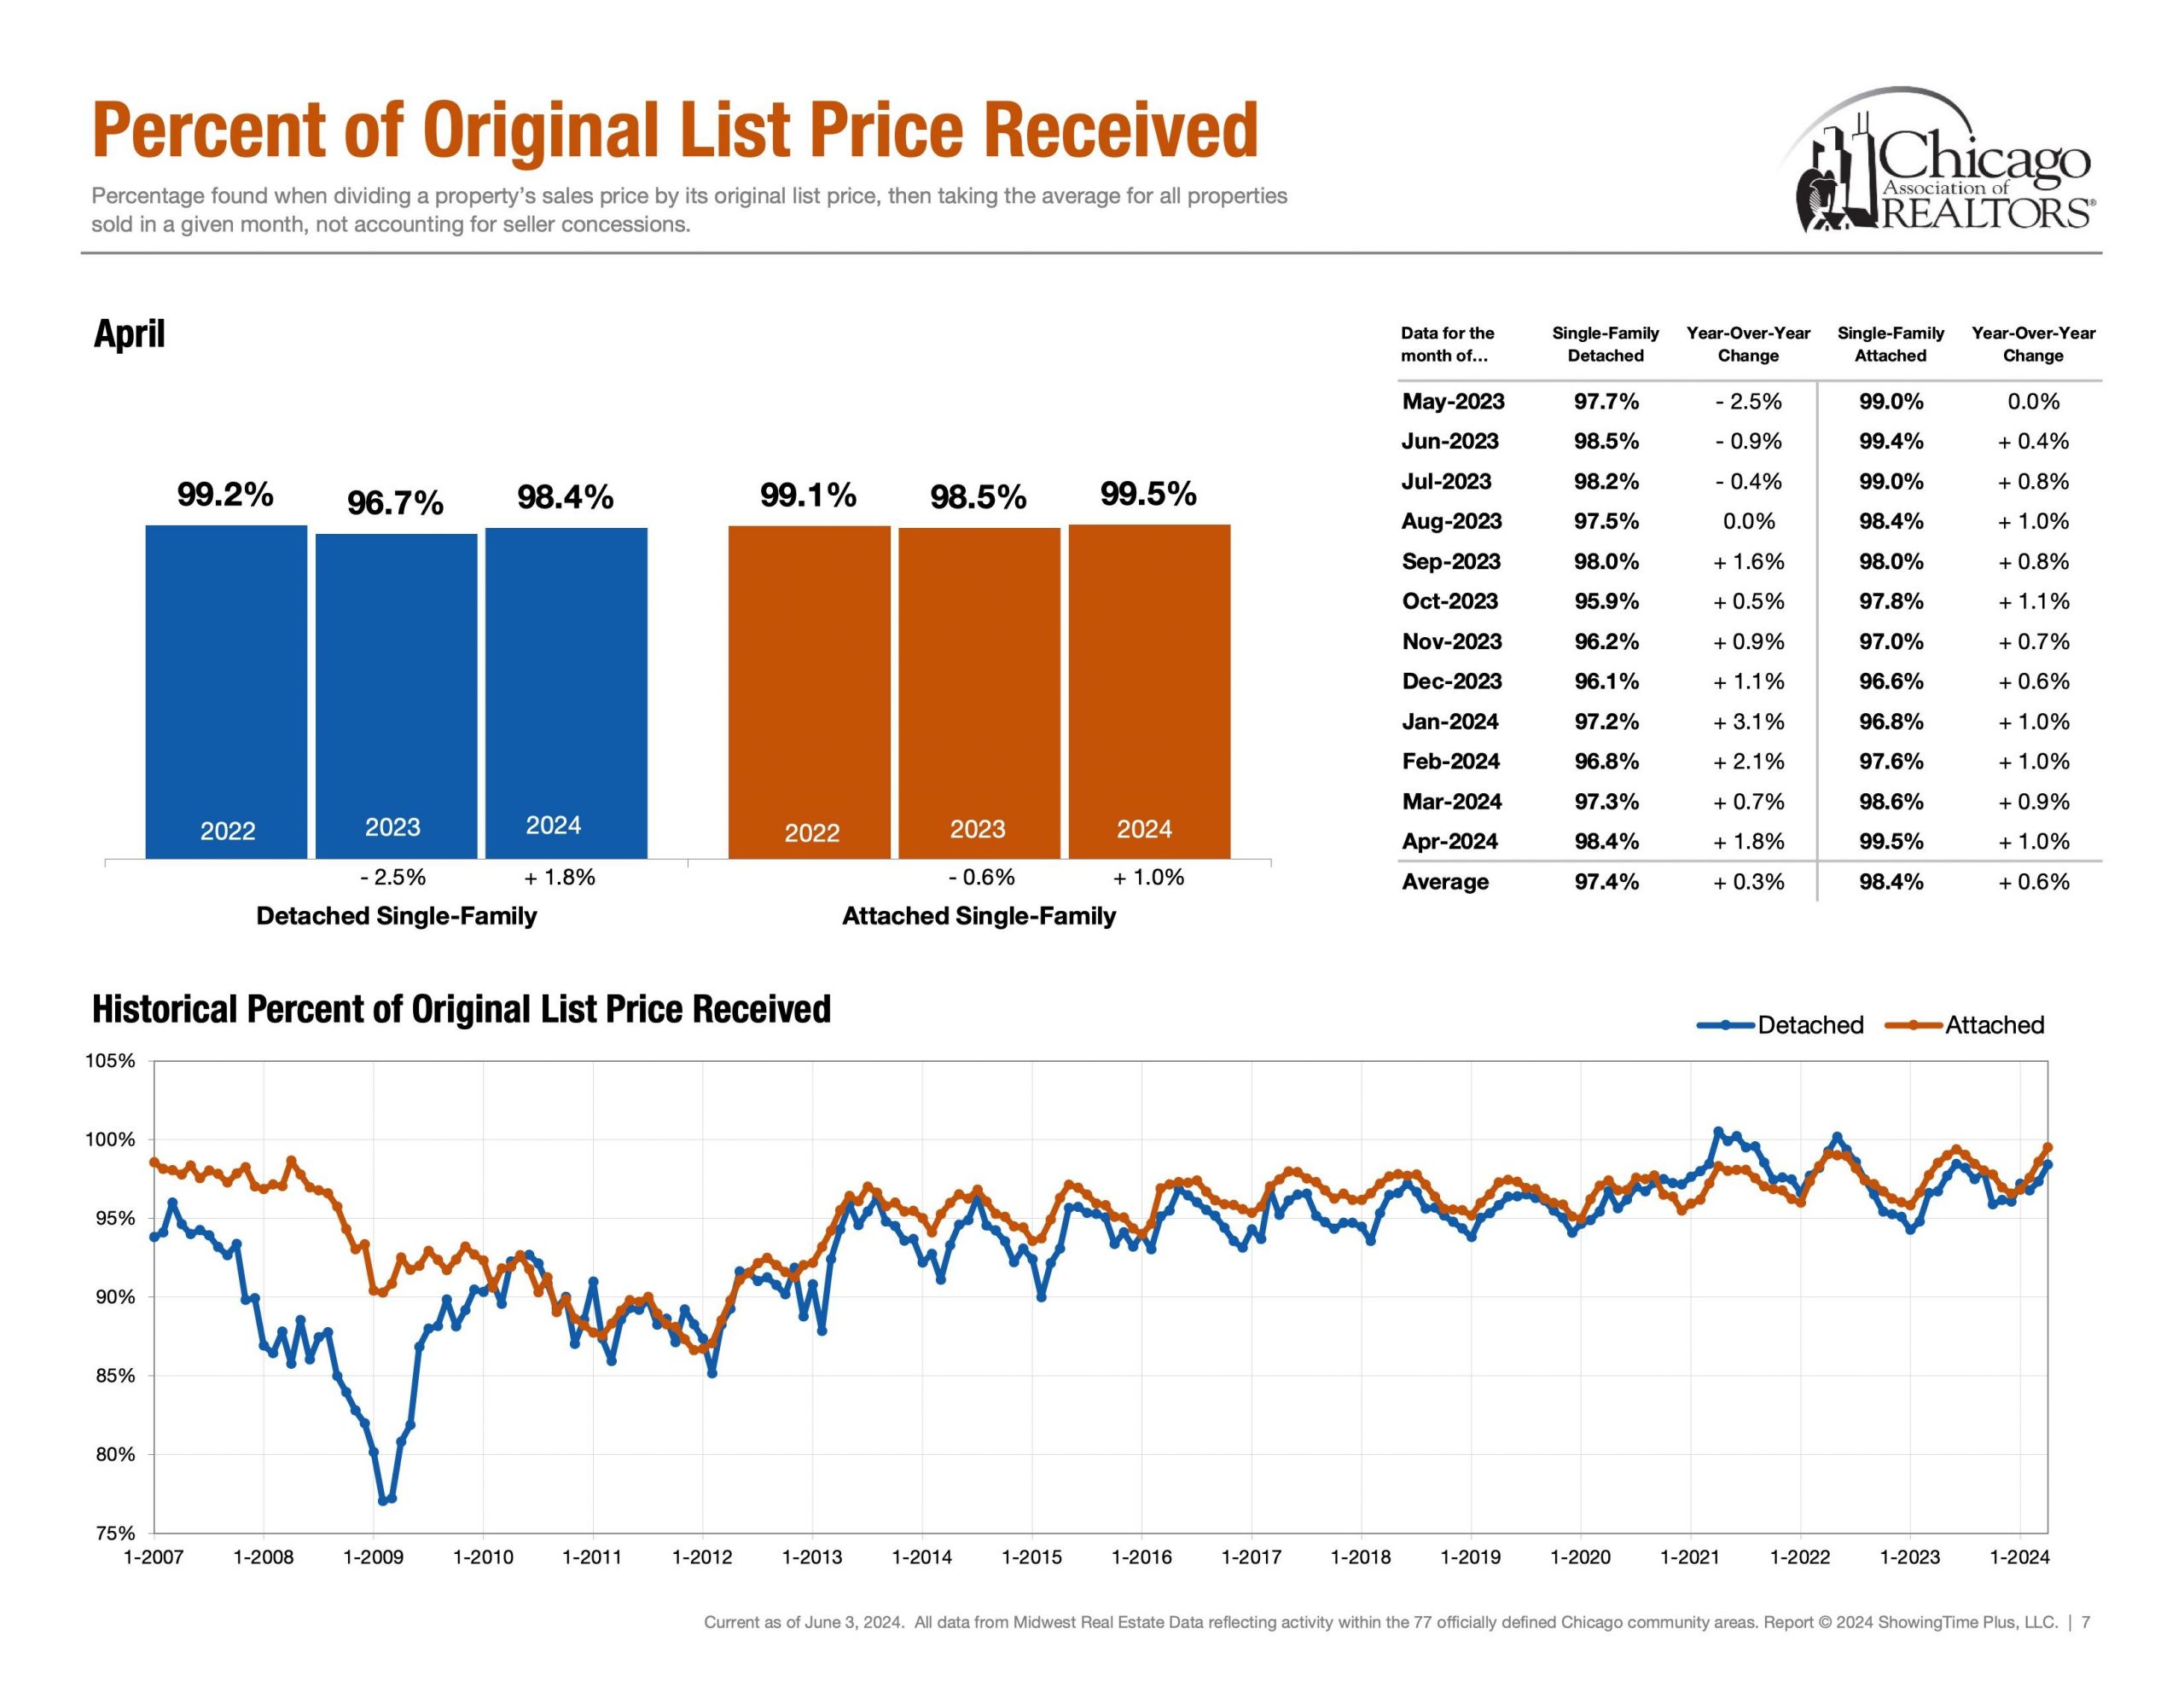
Detached Single ~ 97.4% (Rolling 12 Months Avg) & ~ 98.4% (April 24′)

Attached Single ~ 98.4% (Rolling 12 Months Avg) & ~ 99.5% (April 24′)

Lastly, Percentage of Original List Price Received to Closed Price is a metric that showcases what the average accepted purchase price is relative to the list price. How much below asking price can an offer go while still getting accepted? How much would one have to offer above ask in order to be an above average purchase price?


The End | Have A Great Day!

Please note all of these metrics are along a spectrum as opposed to a specific number. Below is “The Weekly Market Activity Report” which is a research tool reflecting residential real estate activity within the 77 officially defined Chicago community areas provided by the Chicago Association of Realtors®. It is essential to keep in mind that real estate markets can vary across neighborhoods and property types within a city. In conclusion, economic conditions and external factors can influence market trends. Staying updated on these metrics and trends is crucial for making informed decisions.