Facebook
 X
X
 Pinterest
 Copy Link

January 2025 | Week 4
Matthew Litzenberger a third generation Realtor with Coldwell Banker Realty helps buyers and sellers understand Chicago Real Estate Market metrics. Follow along for weekly updates on all things Chicago Real Estate by clicking here.
Introduction
Hello and welcome. This weekly series is aimed to help understand current Chicago Real Estate Market Metrics. While there are many metrics to talk about in the world of real estate, today we are going to look at four: speed, demand, supply and negotiations. Let’s get started!
Summary | TLDR
If you want to skip this week. Go ahead. Week 4. Market Cooled off.
Hope everyone is well out there. Hope you are doing well. Now, I’m no doctor. However. If you’ve been out and about you may have come across this winter cough and in our week 4 installment it seems like the real estate market also caught it.
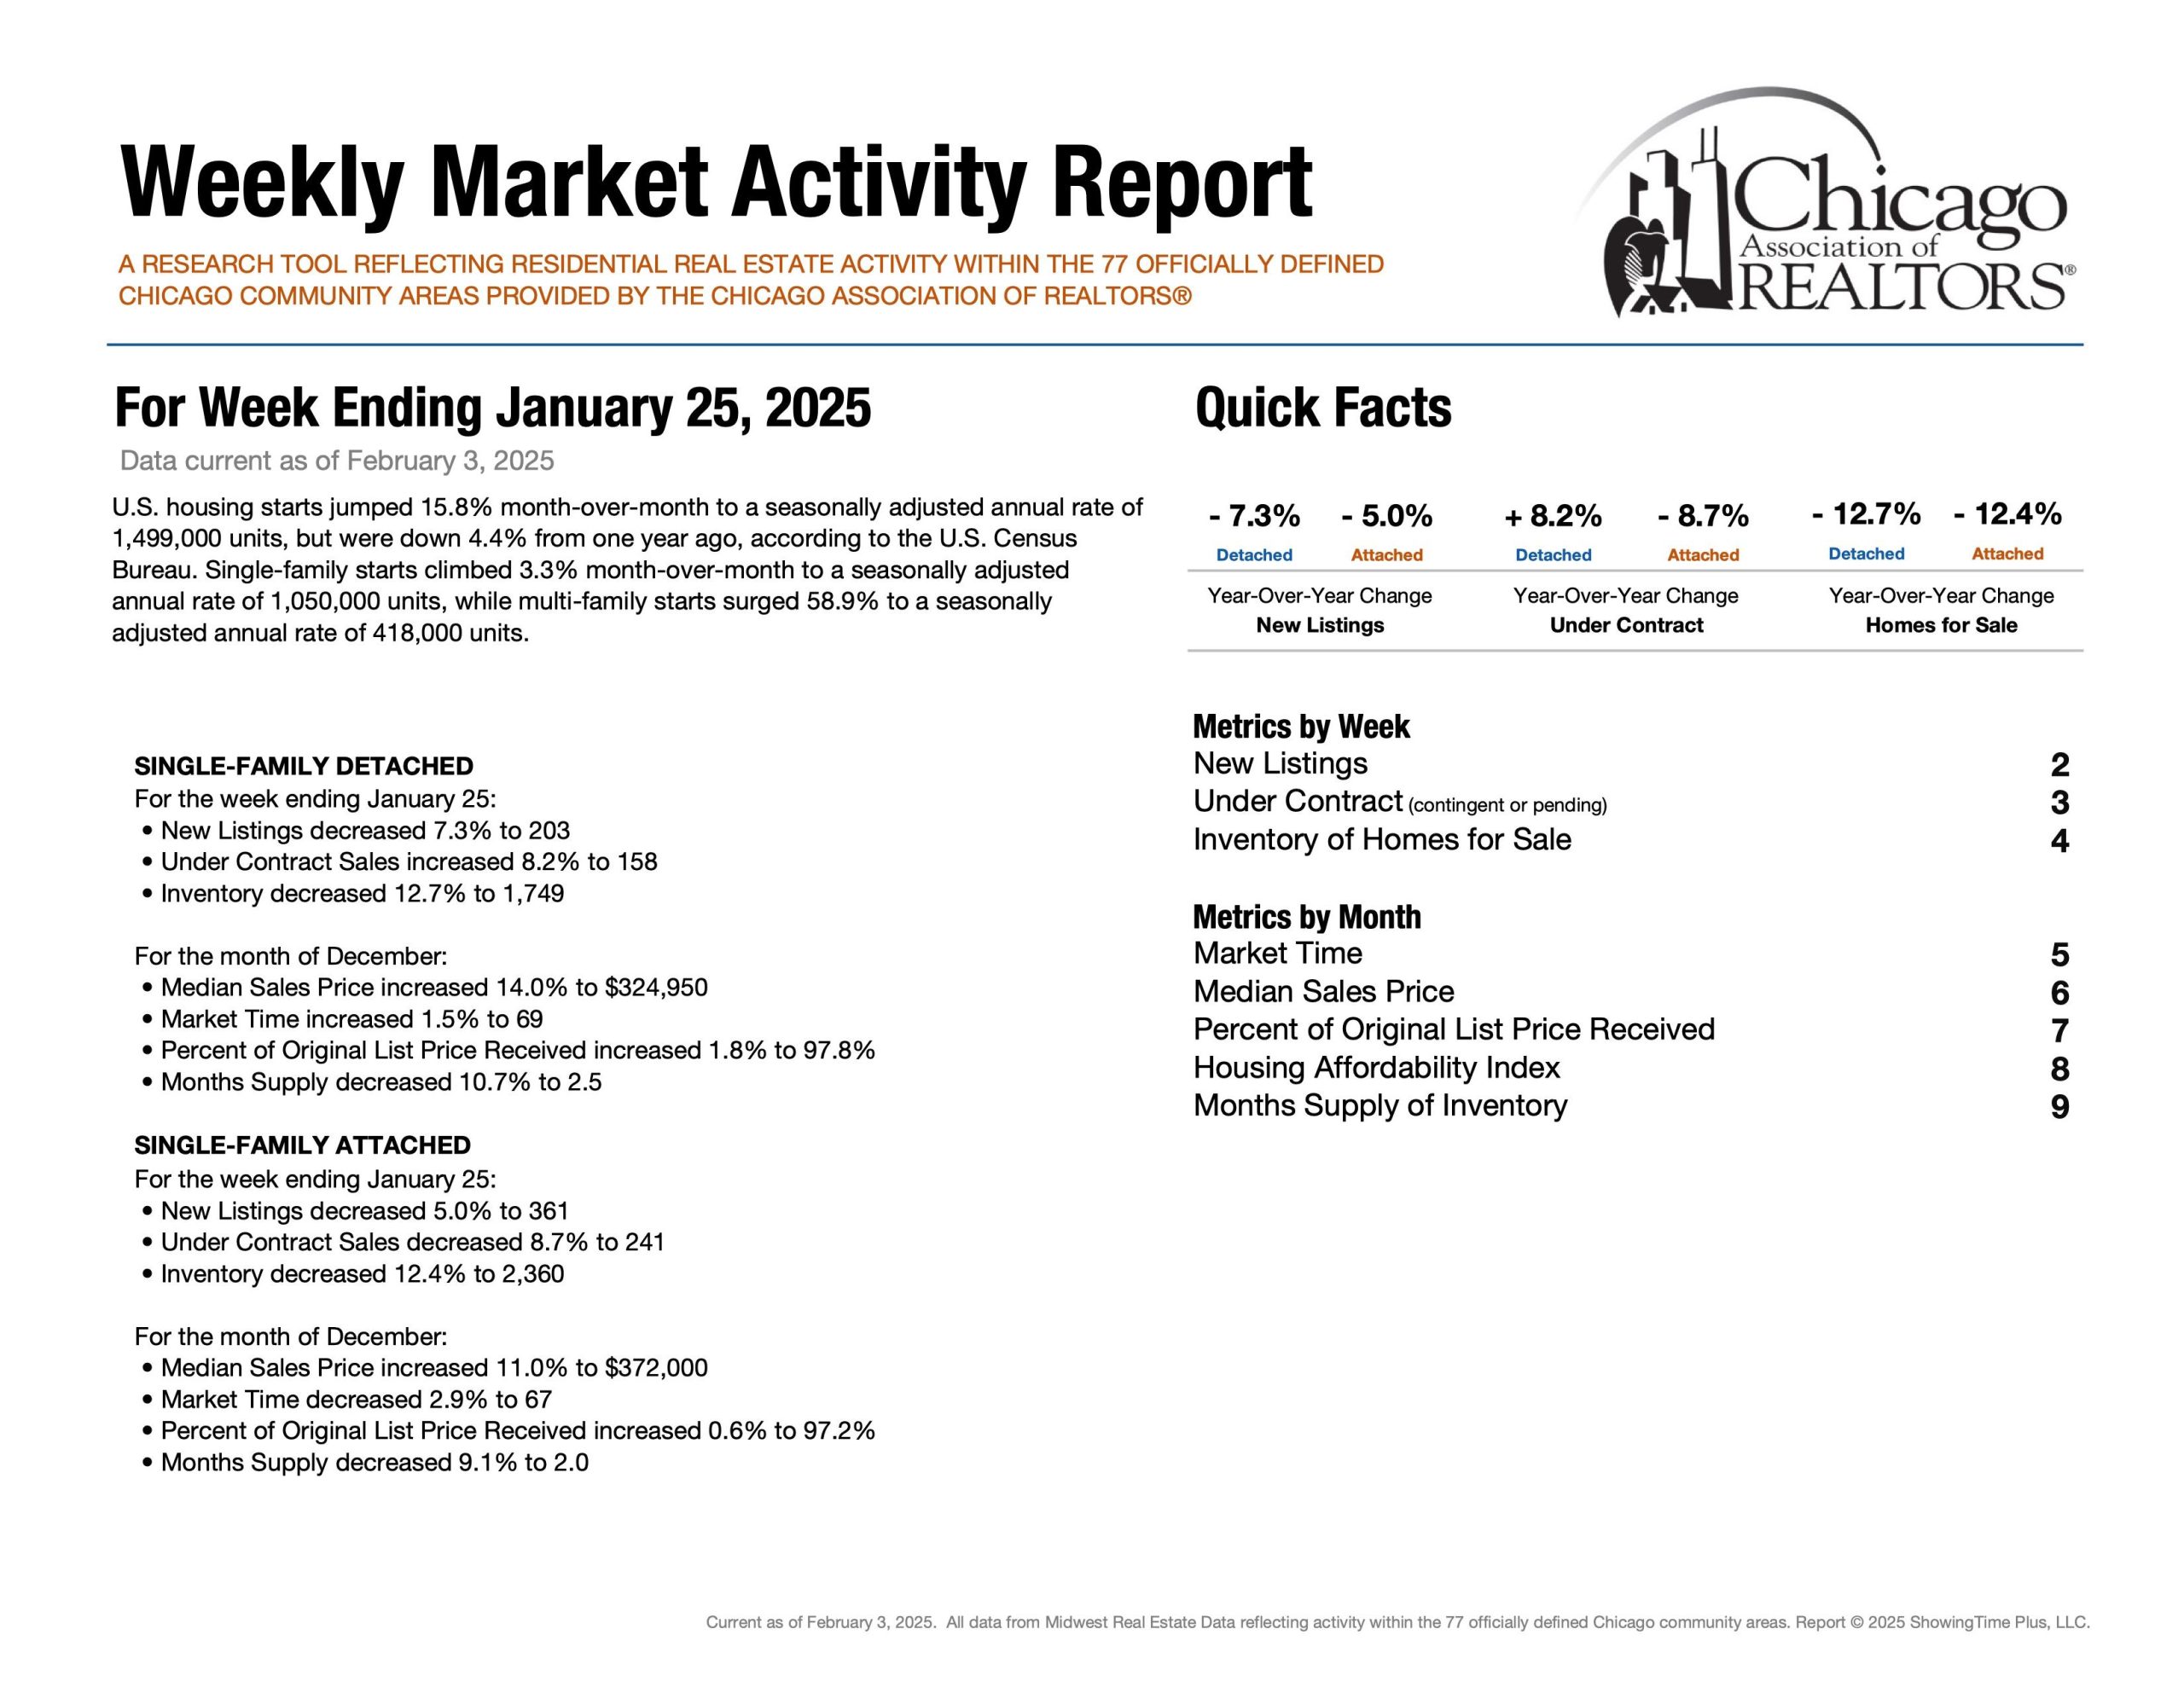
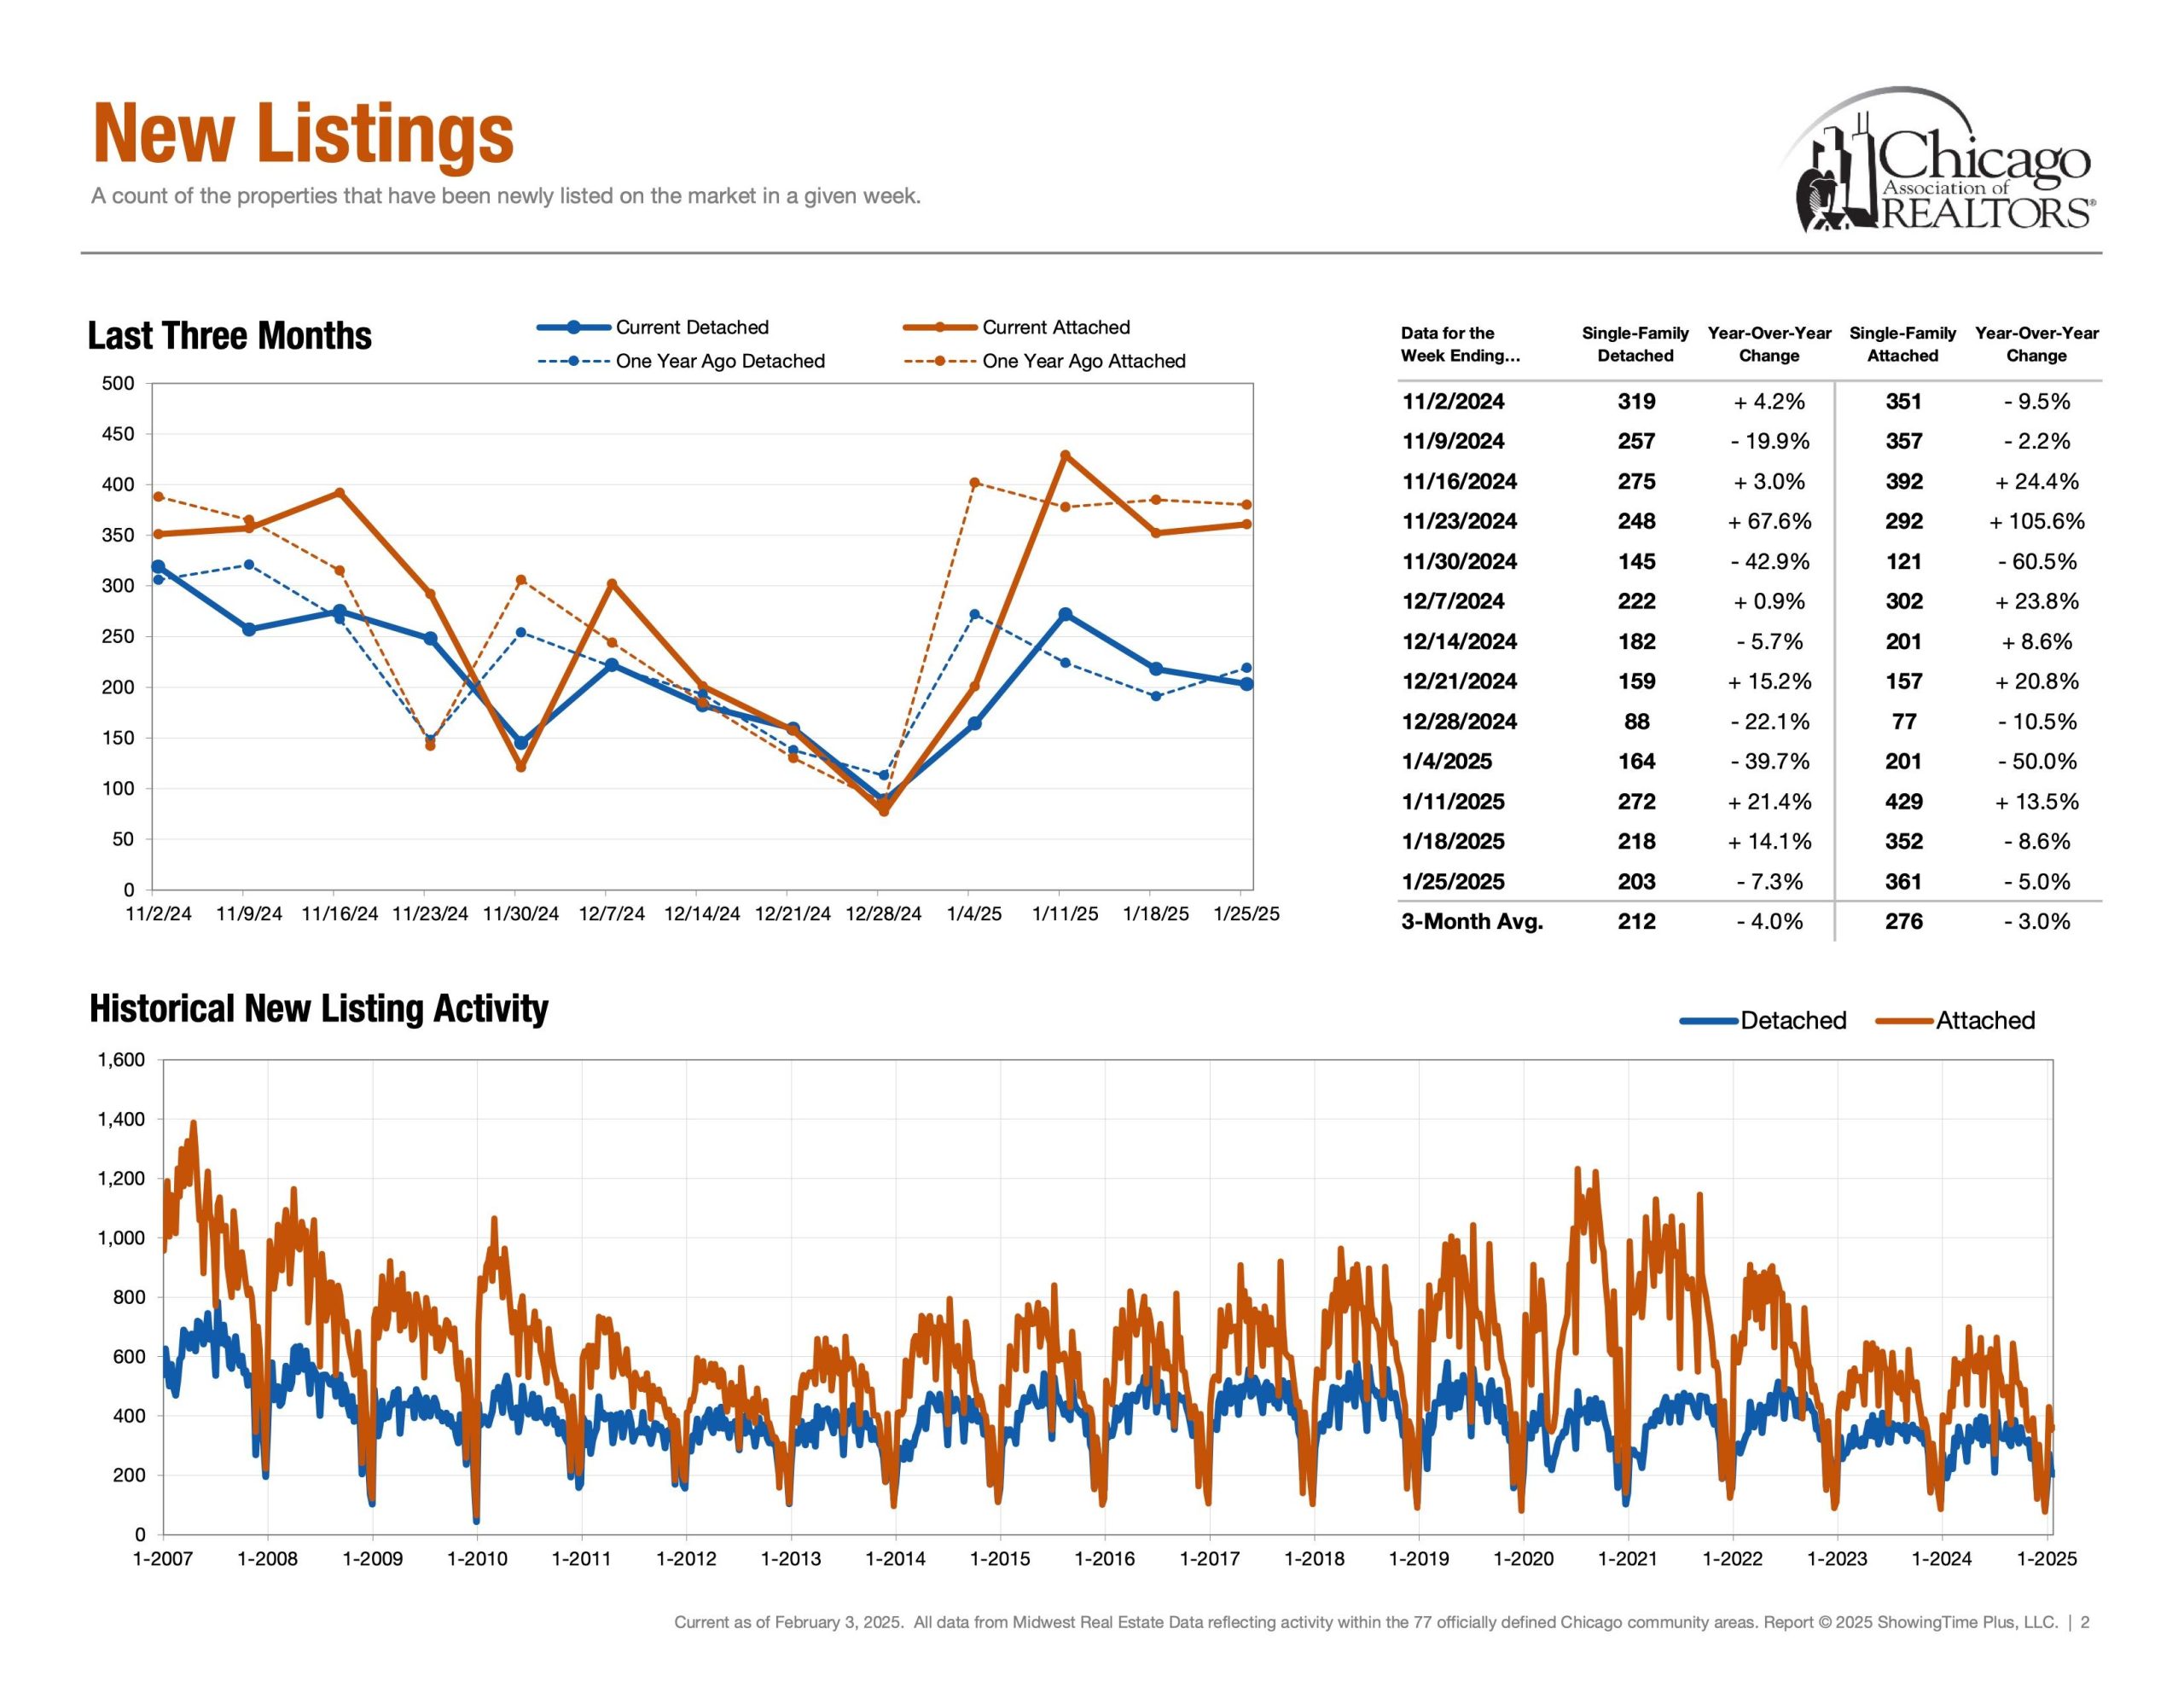
Supply | New Listings: Detached -7.3% & Attached -5.0%.
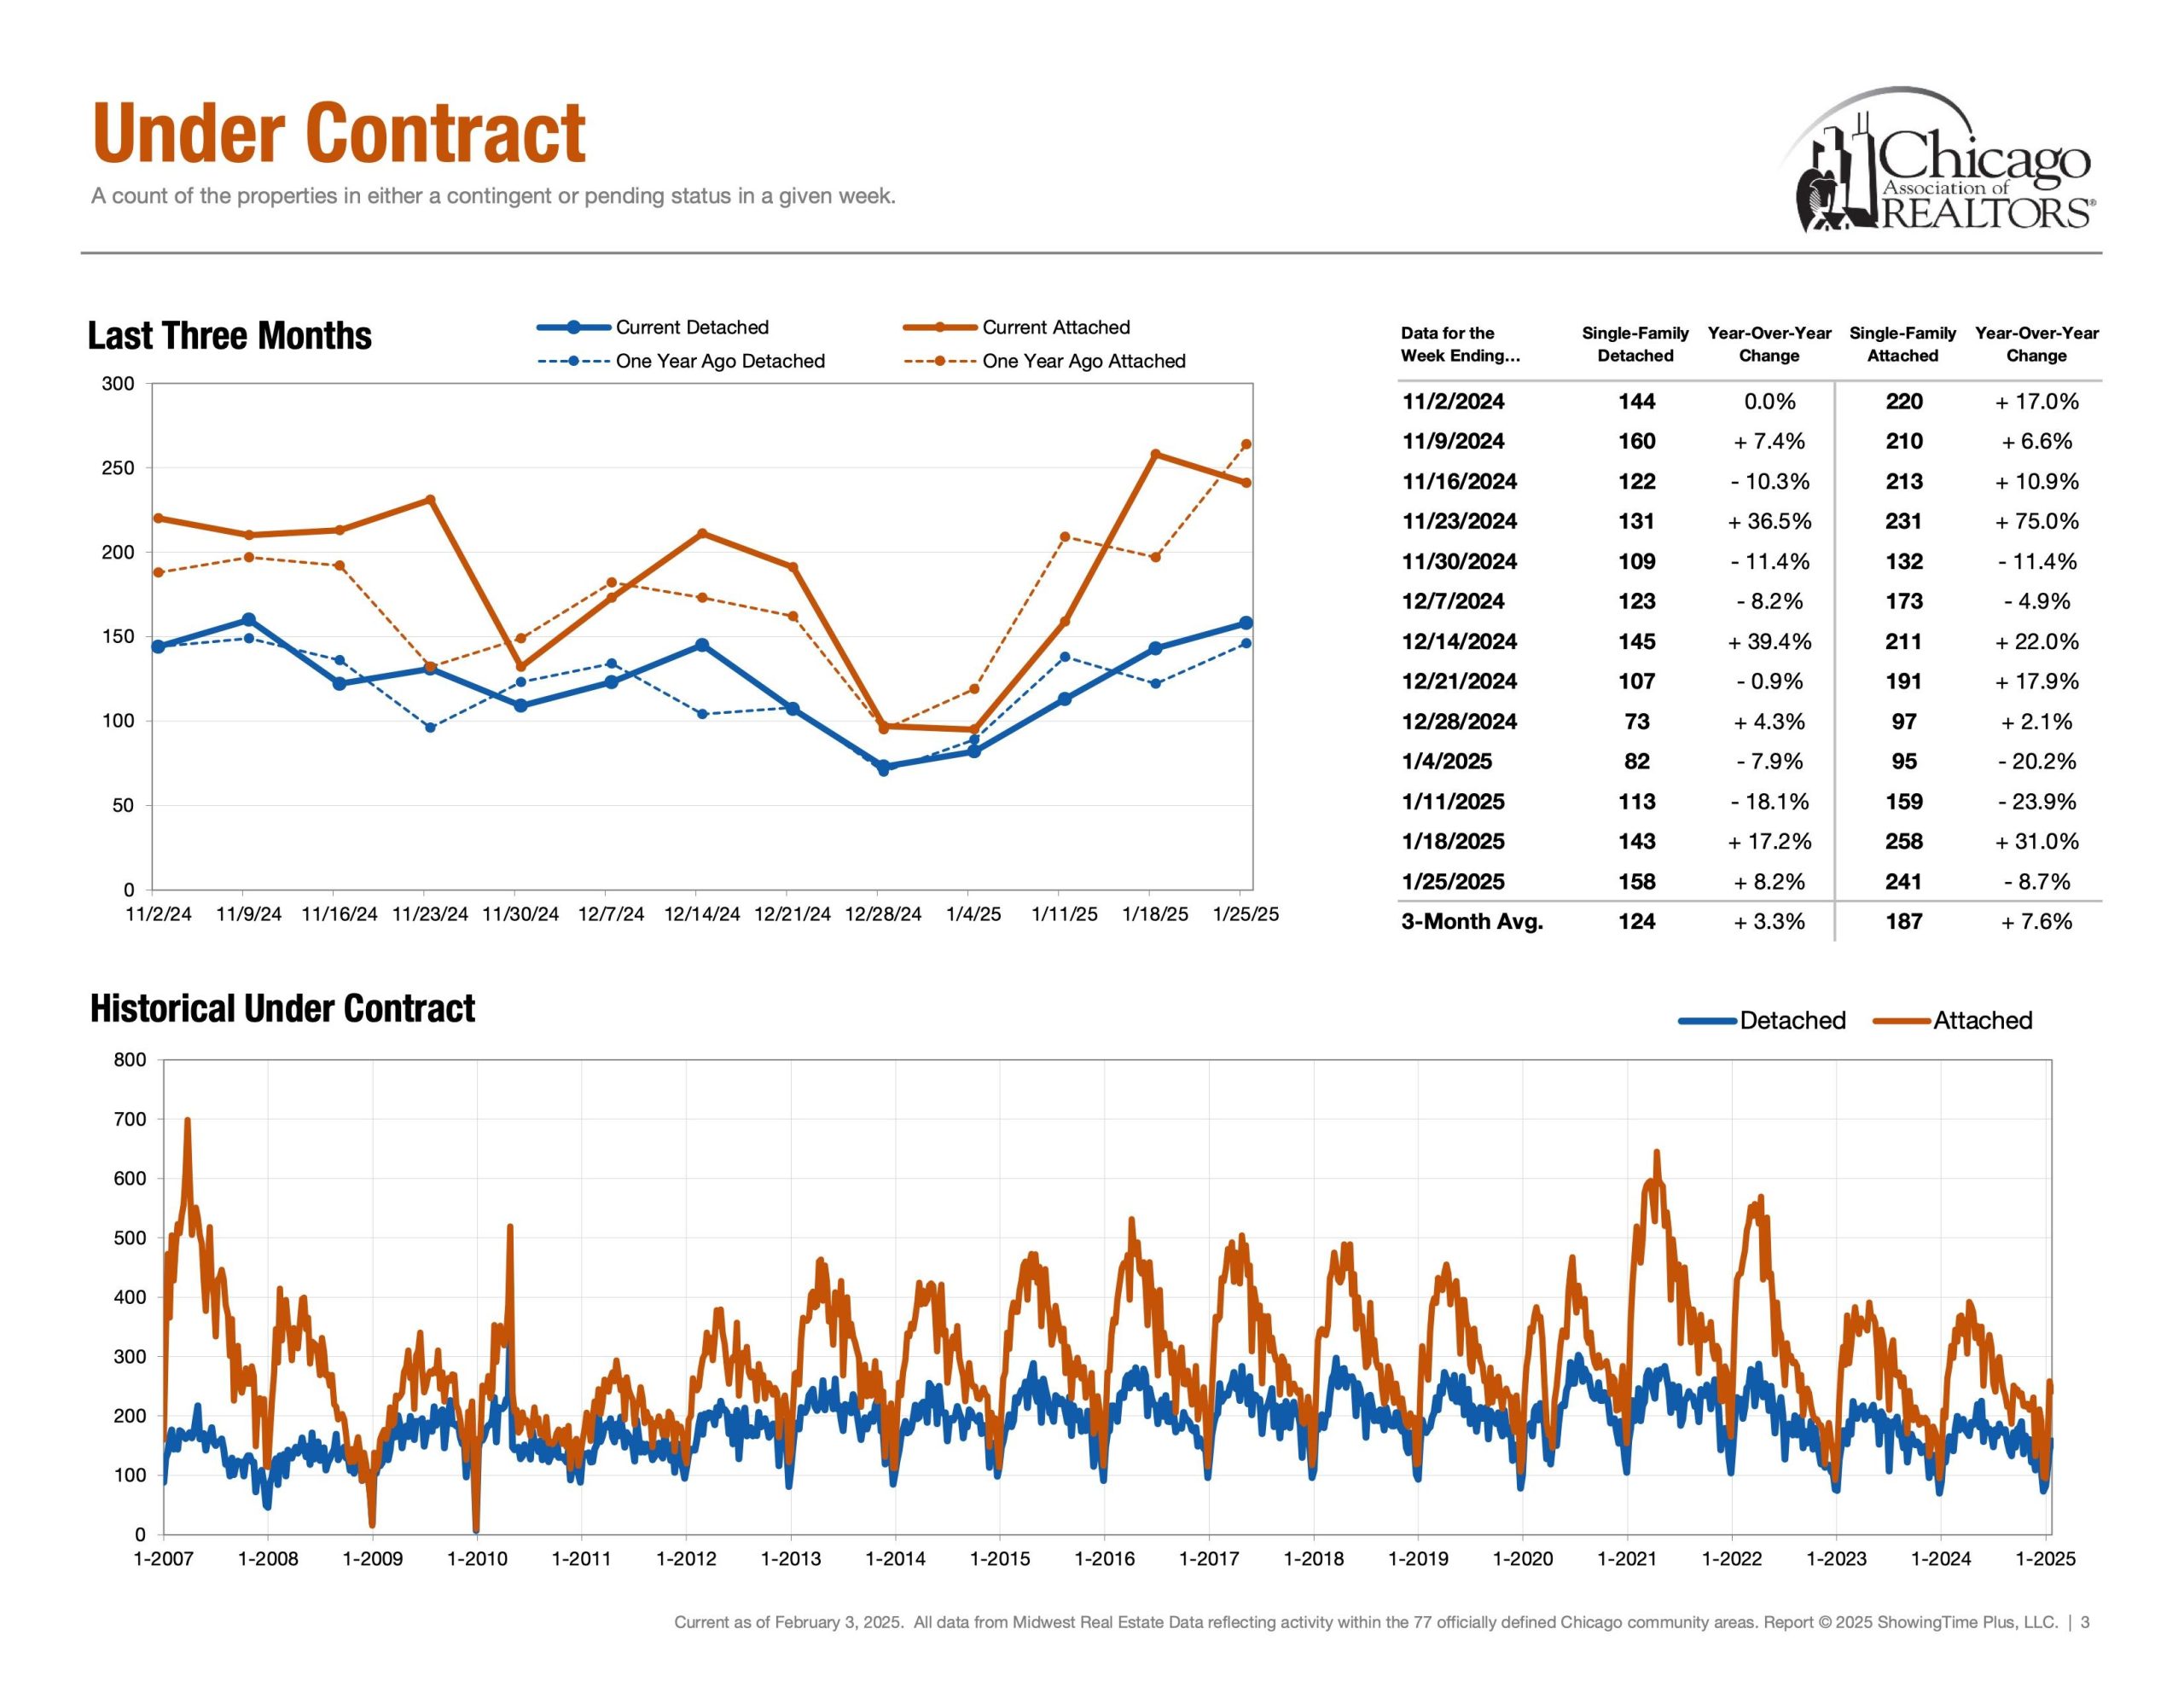
Demand | Under Contract: Detached +8.2% & -8.7%.
The percentages are fun to talk about and yet the issue is the number of units. Its low. Historically low. The Market is not out preforming 2024. Four weeks into the year. 2024 vs 2025. The 2025 Chicago Real Estate Market is looking alot 2024.
As discussed in previous weeks. Heartbroken buyers would like to see New Listings increase at a rate that outpaces Under Contract. The issue is the Chicago Real Estate Market is saturated with ready, willing and able buyers. Additionally, when a seller goes to sell, unless they are relocating out of the city; that seller now becomes – another – buyer. Futher compounding the over saturation of demand.
The Question is How does the Chicago Real Estate Market see an increase, an injection of inventory? The answer may just be it wont. It takes time. But who knows. No one knows the future.
Other additionally leading theories: 1. Build new construction. 2. Goverment grants. 3. Work on improving growth in Median Income. 4. Nothing changes & witness America enter into a renters economy.
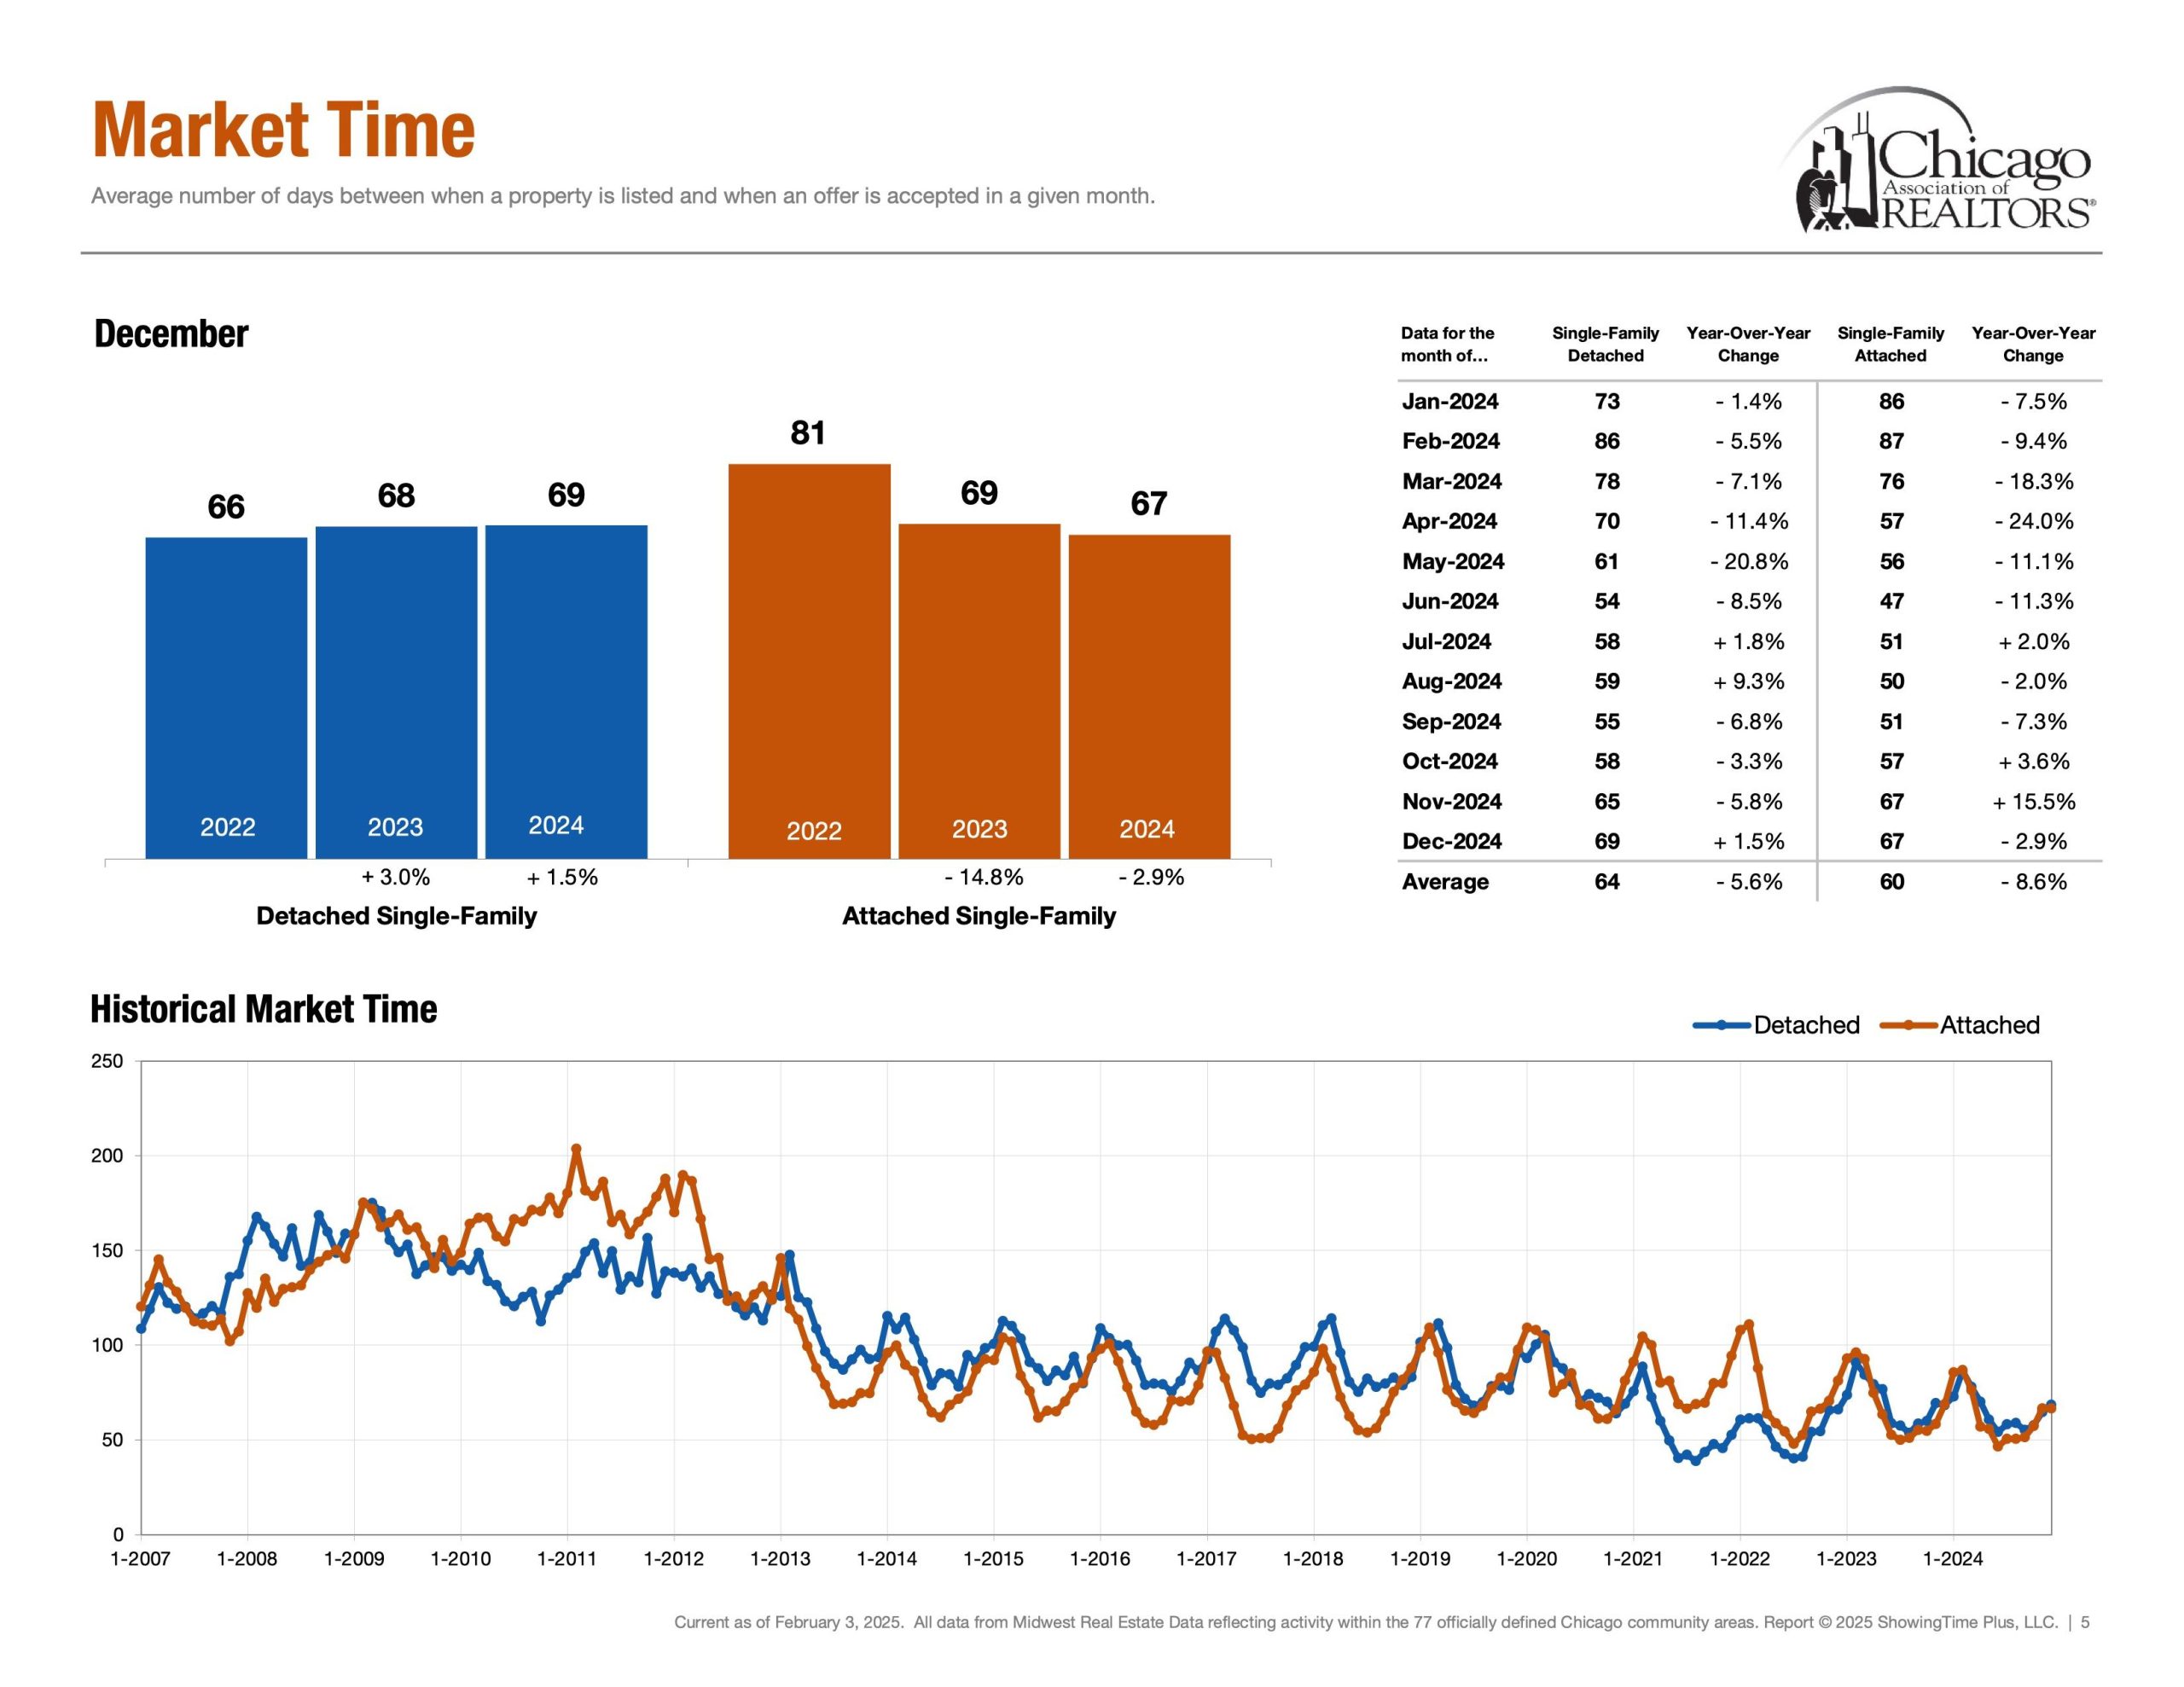
Speed | Healthy Market Time Range
Detached Single ~ 68 Days (Dec 24′)
Attached Single ~ 67 Days (Dec 24′)
First, market time is metric that showcases speed and whether a listing was priced too low, priced properly or priced too high. If a listing surpasses average days on market, it is a check engine light that your listing maybe overpriced. Interestingly, Dec 2024 Year over Year change for Market time was 0.0%, 68 days on Market. Please note that Market Time in our context measures the distance from when a property was listed and when an offer was accepted in a given month.
Demand | Under Contract
Detached Single = 158 Properties (Jan 19th – Jan 25th)
Attached Single = 265 Properties (Jan 19th – Jan 25th)
Secondly, under contract helps answer the question, “In our current market, how many buyers are buying?” Showcasing the heartbeat of the real estate market. Interestingly, demand metrics become more insightful when compared and contrasted with supply/inventory metrics. Demand spiked this week. Suppassing last year. Detached +27.0%. Attached +34.5%.
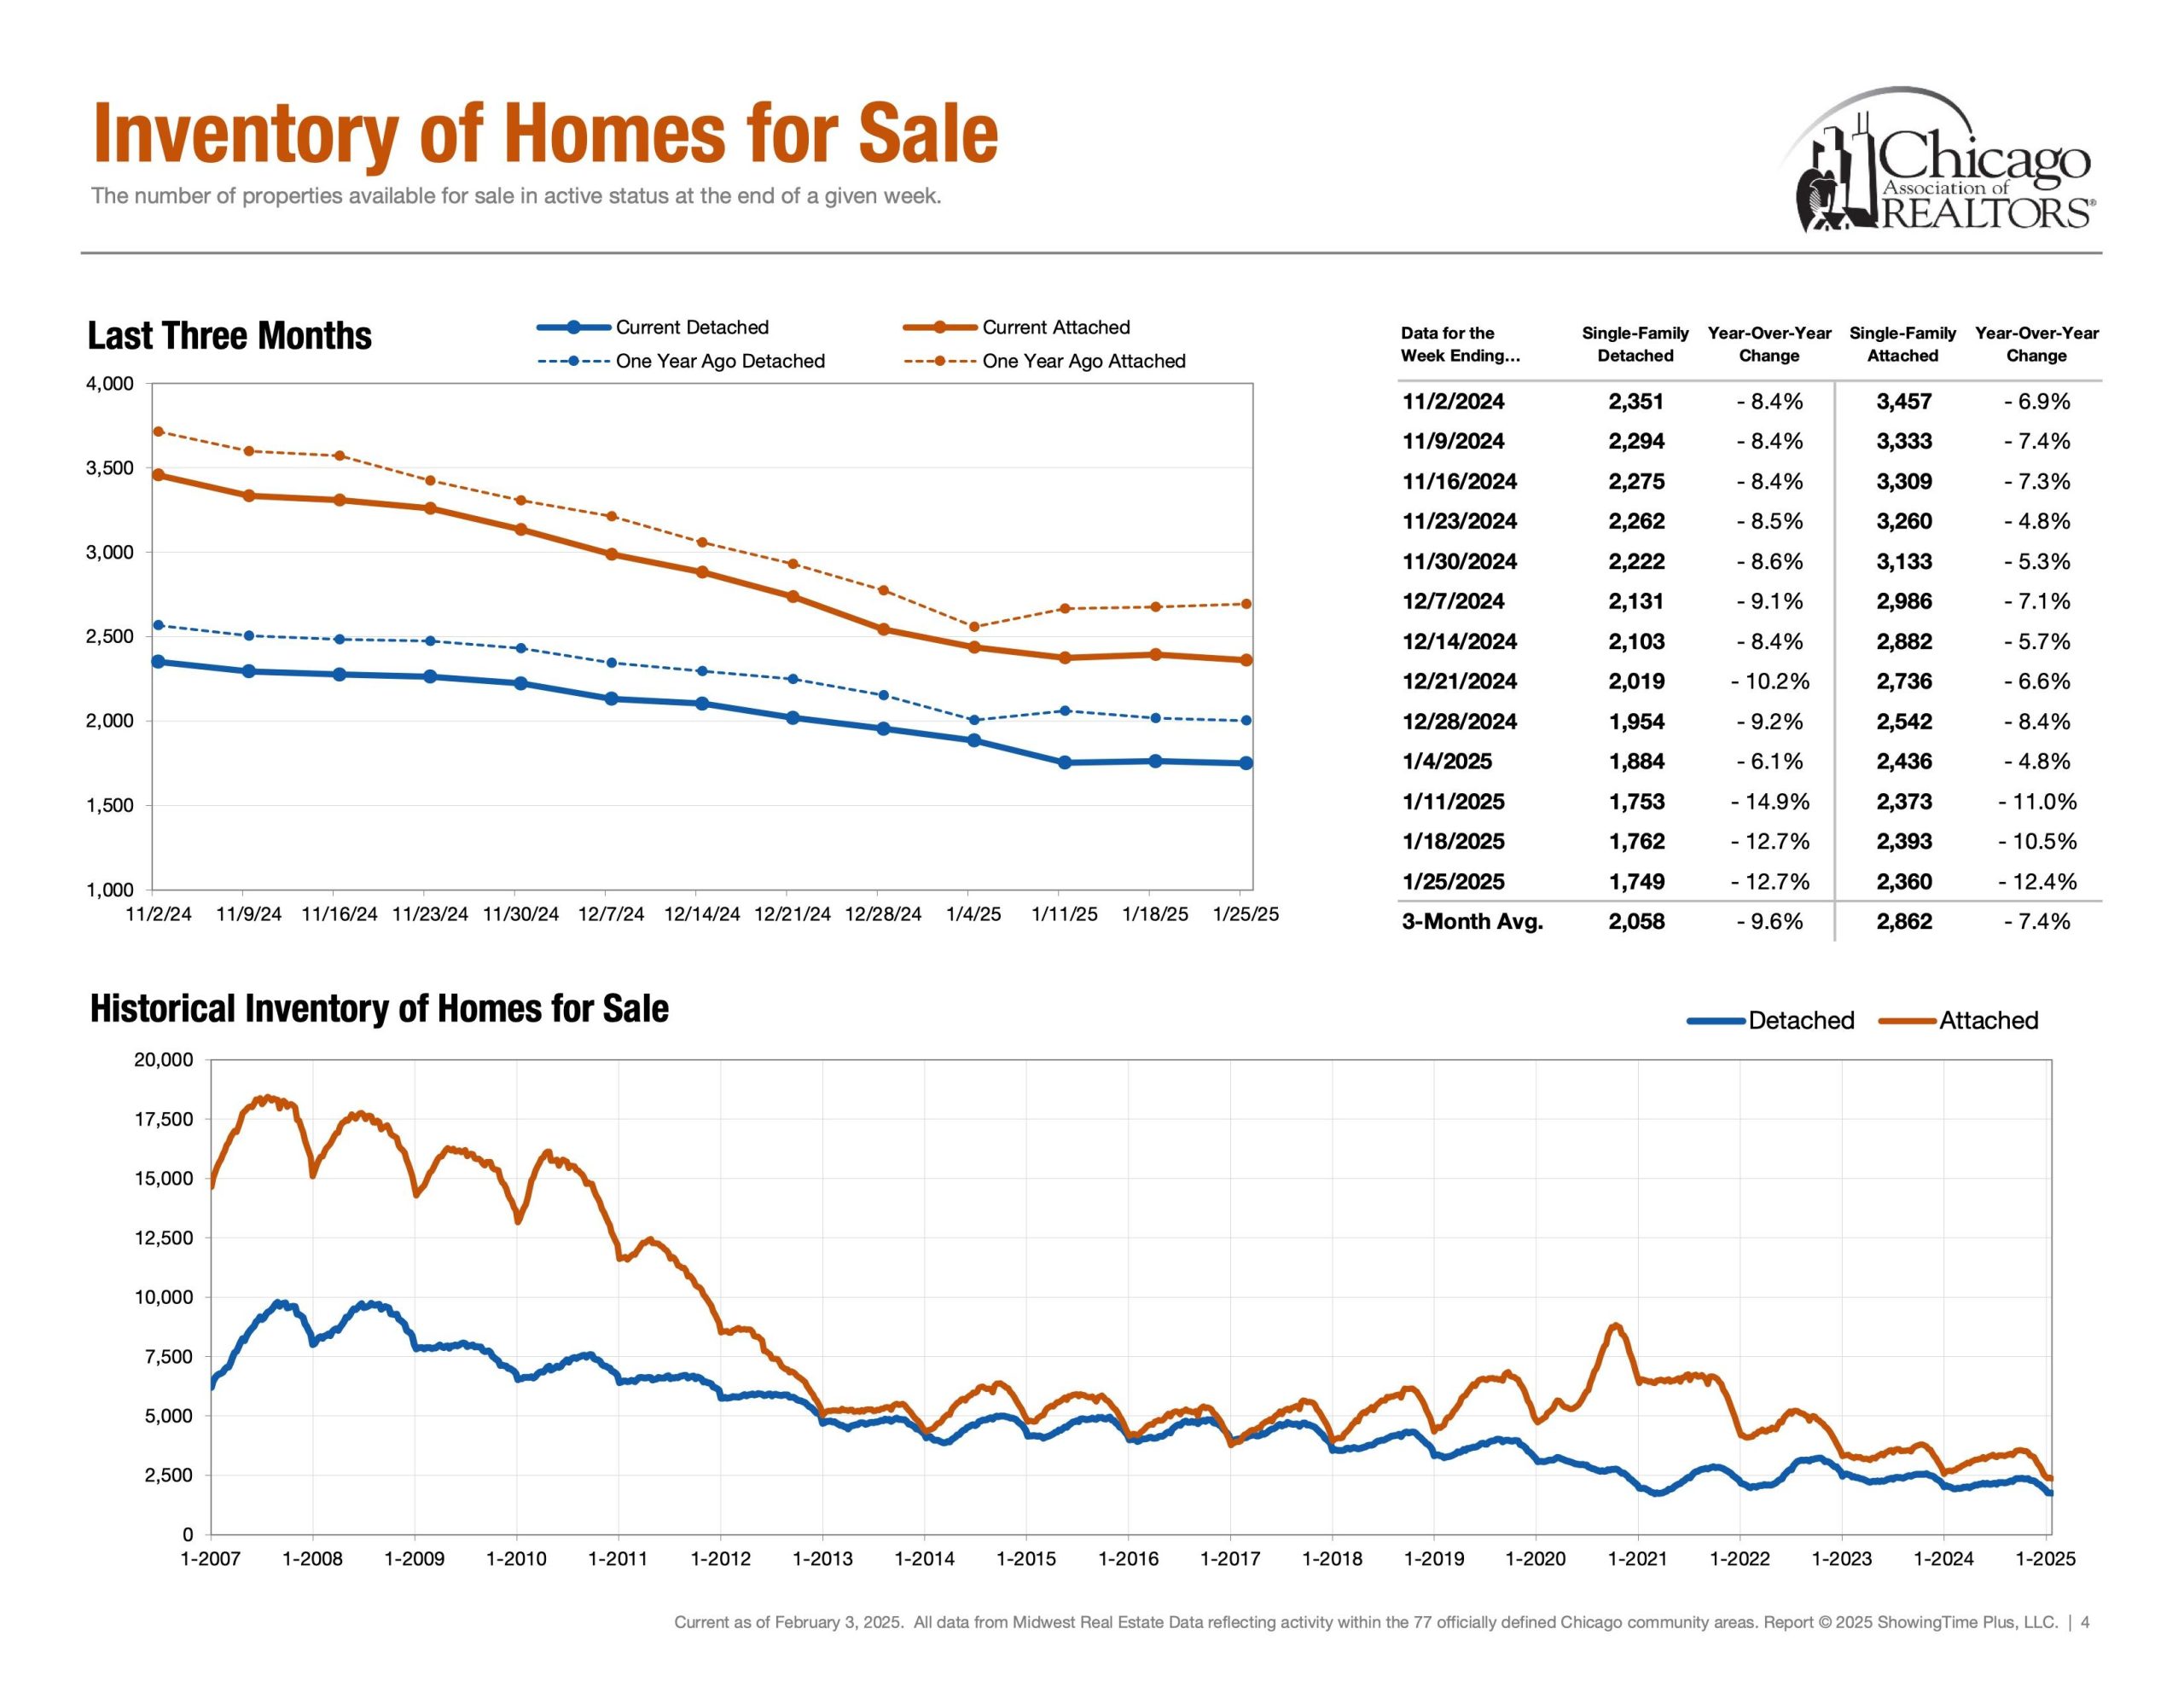
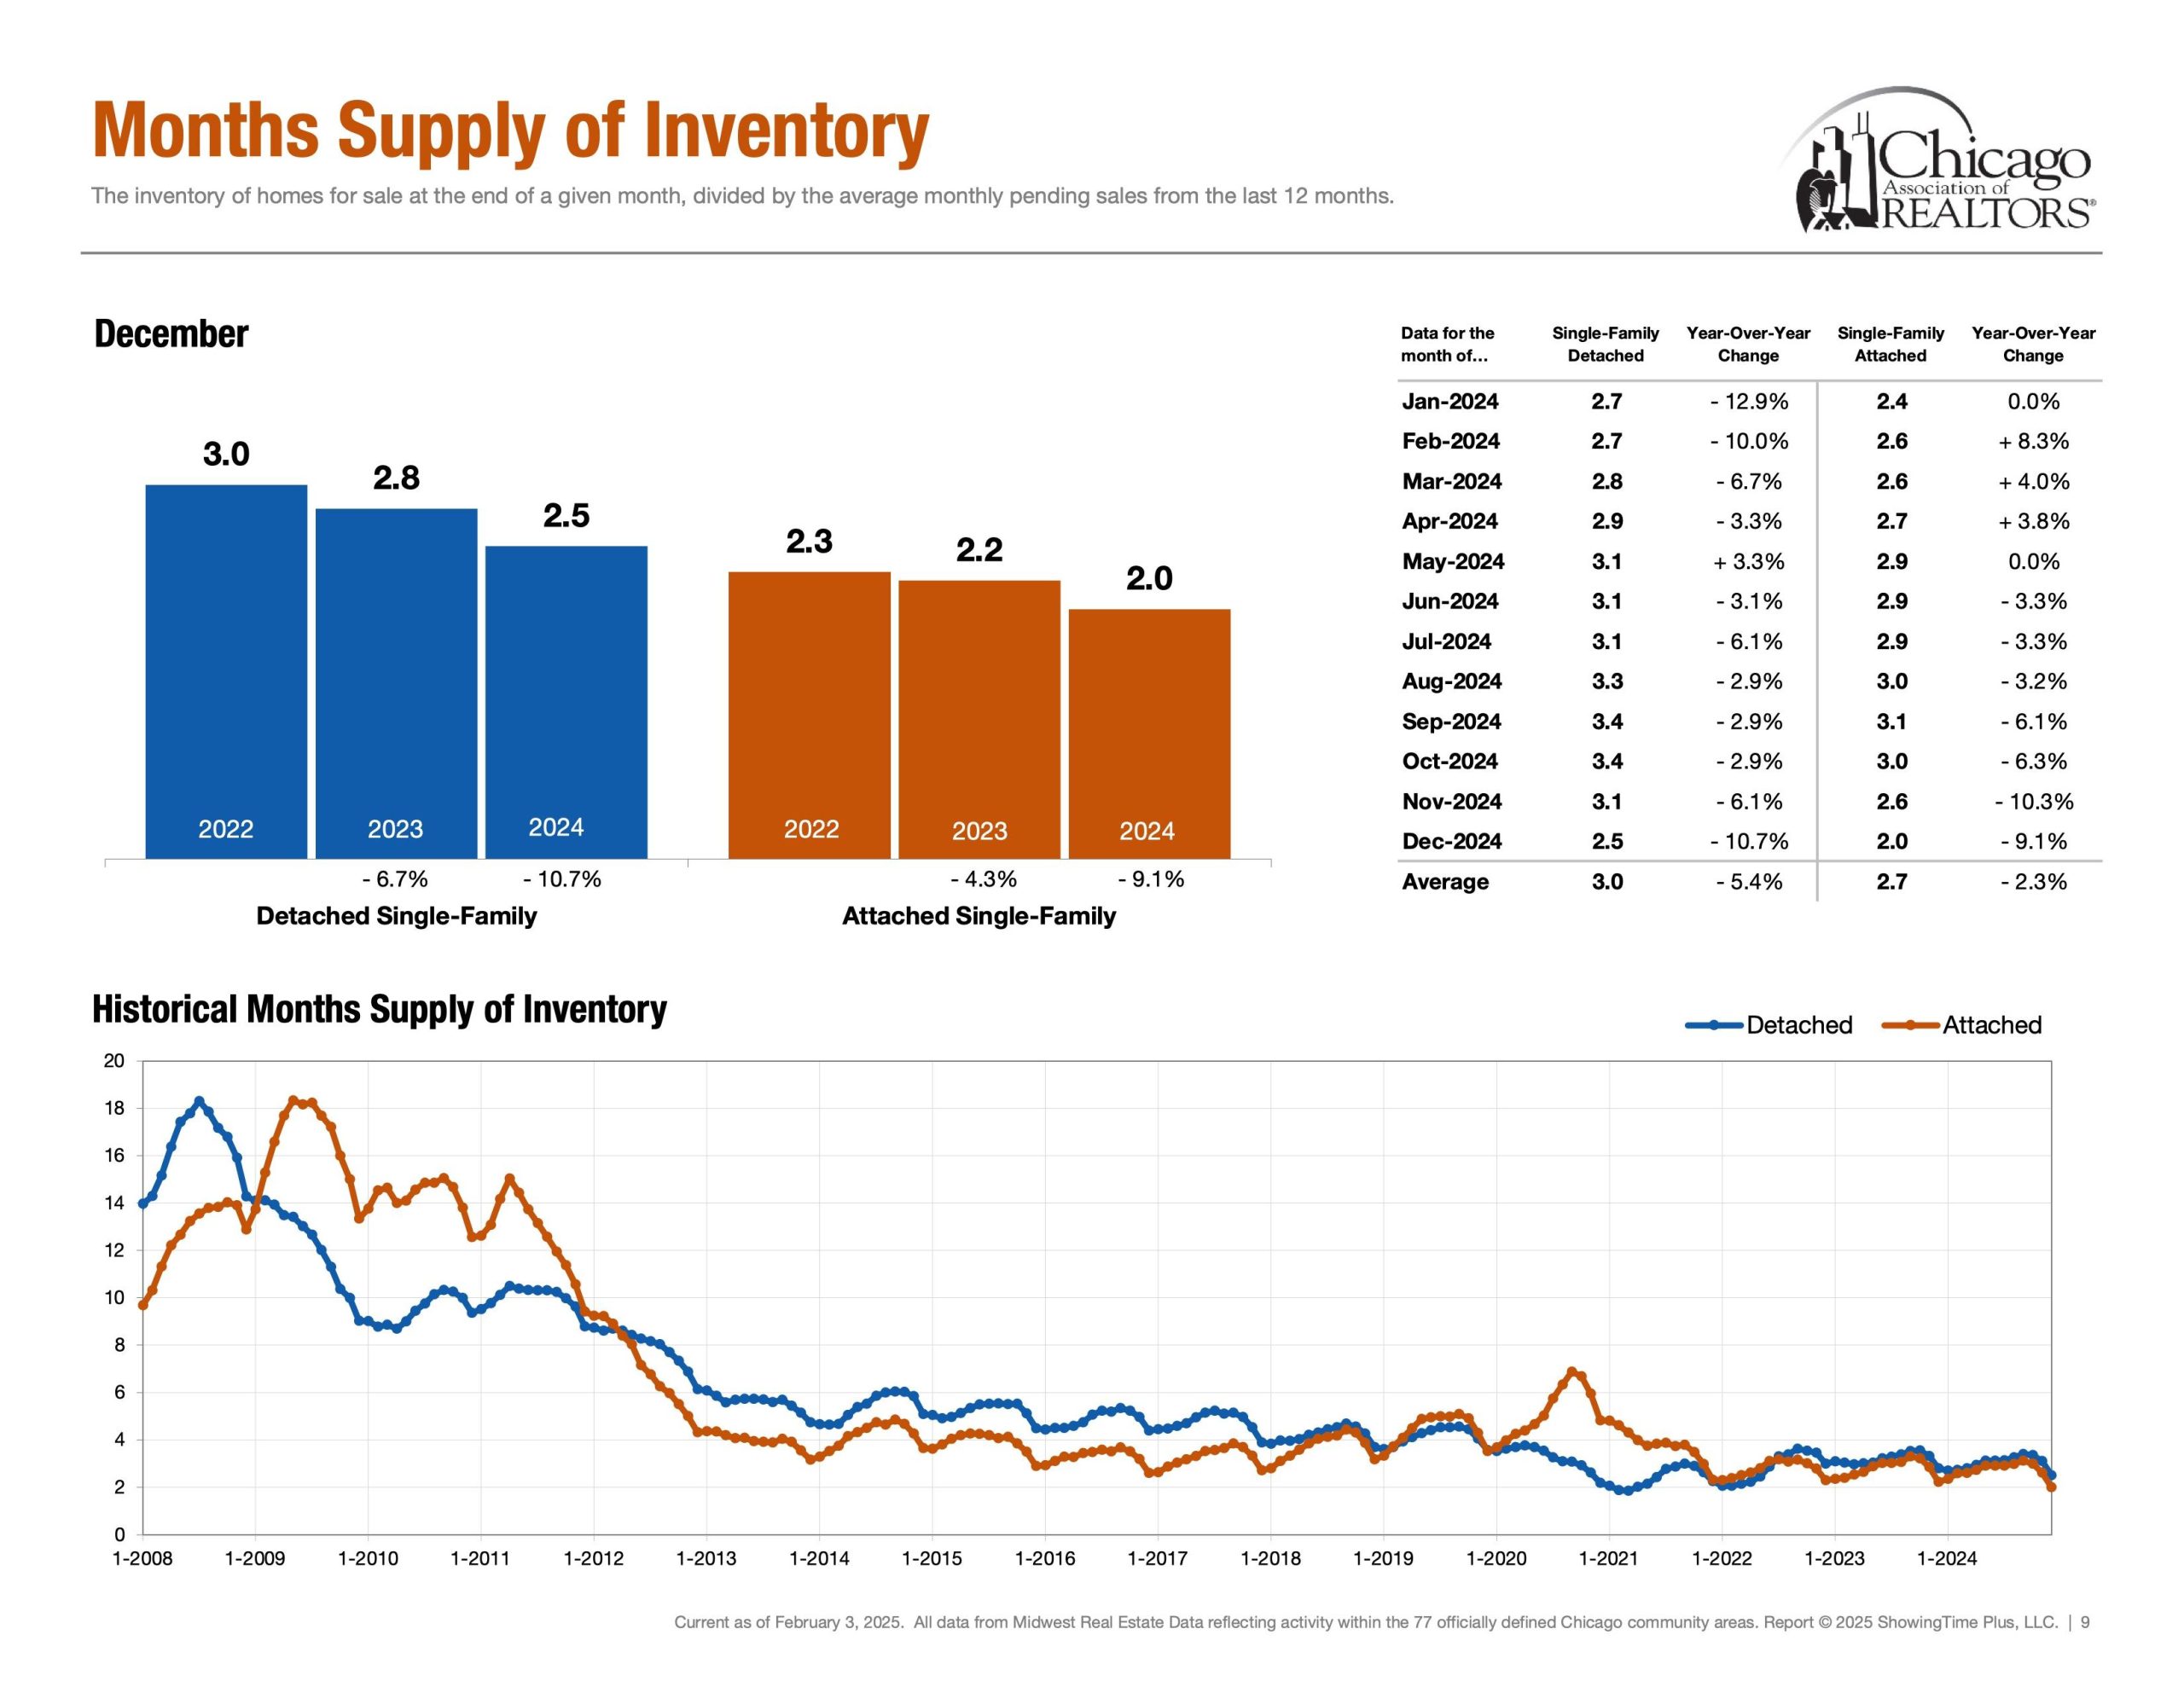
Supply | Inventory of Homes for Sale
Detached Single = 1,749 Properties (Jan 19th – Jan 25th)
Attached Single = 2,360 Properties (Jan 19th – Jan 25th)
Next, probably the metric of the year. Inventory of homes for sale showcases supply and answers the question, “How much inventory is available for buyers and how much competition sellers are up against?” Additionally, Months of Inventory, Homes for Sale, New Listings and Absorption Rate are also other key metrics in the conversation of supply.
Supply | New Listings
Detached Single = 203 Properties (Jan 19th – Jan 25th)
Attached Single = 361 Properties (Jan 19th – Jan 25th)
New Listings is a foreshadowing metric and helps visualize when inventory enters the market. Looking at the week of Jan 12th to Jan 18th. Detached Single just narrowly suppassed last year levels. +13.6% While Attached Single fell below last years preformance. -9.1%. These percentages should be taken in context with the amount of units. Which I will refer you to page 2 of the report below.
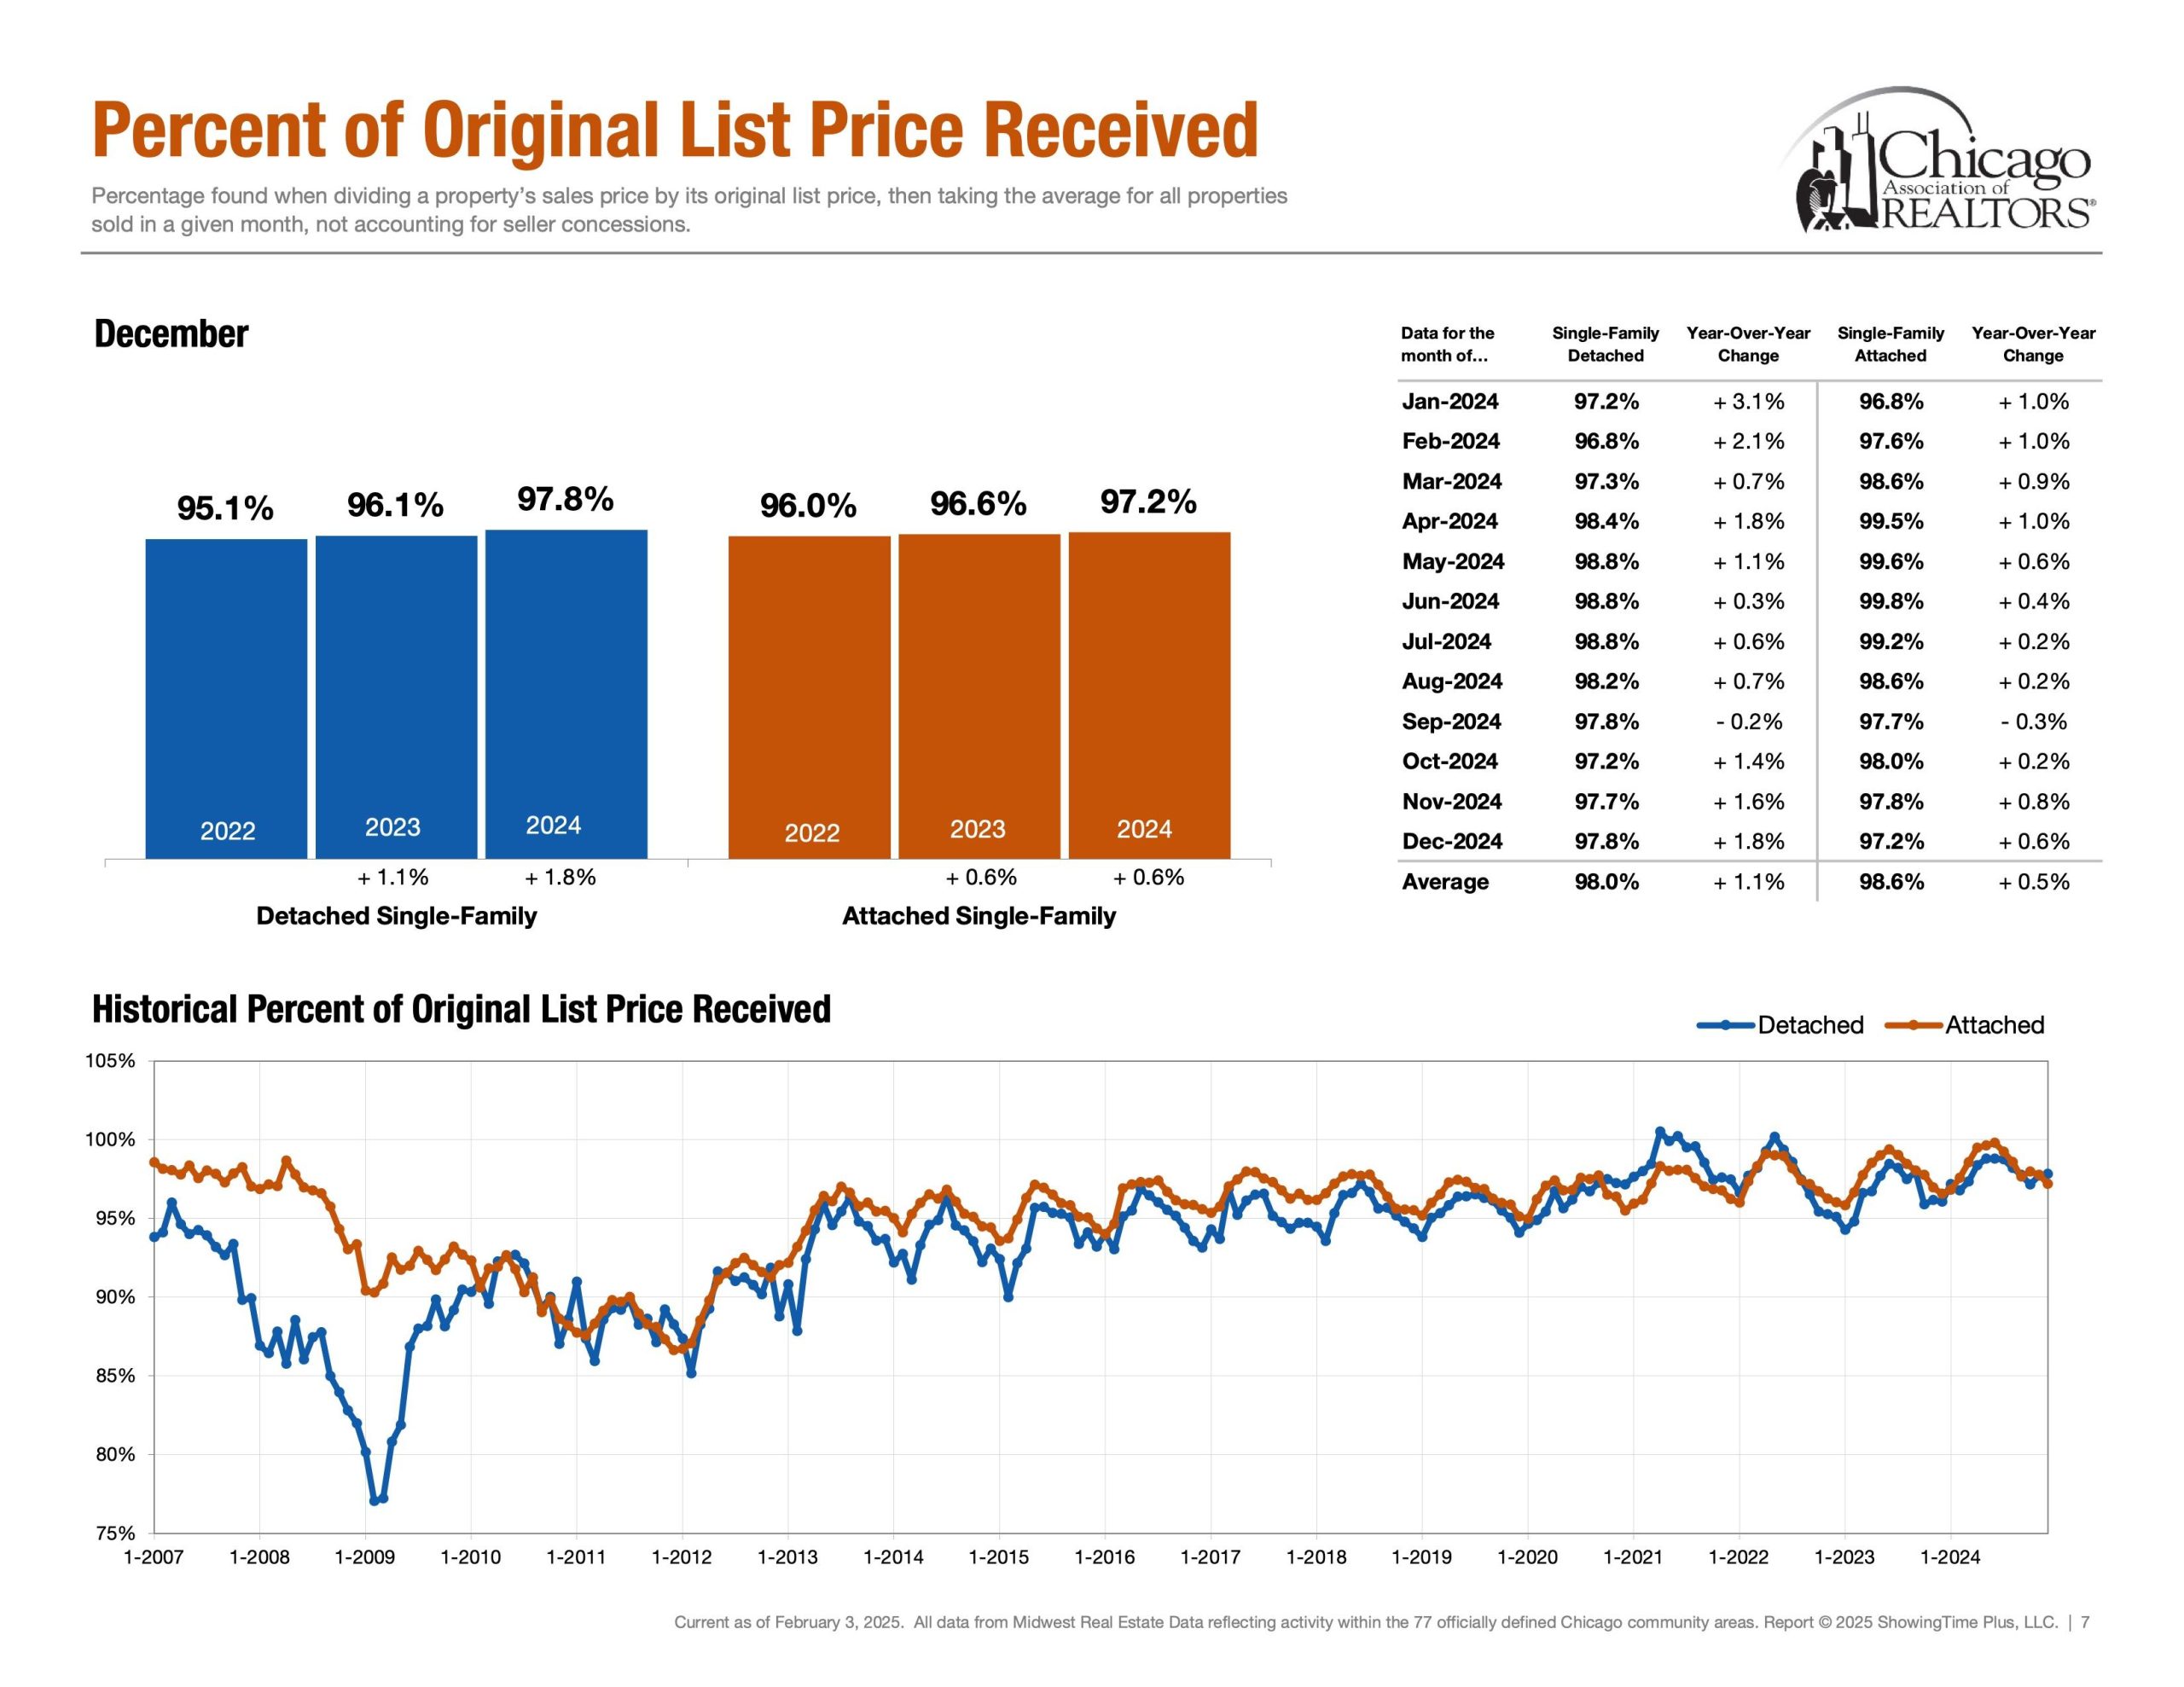
Negotiations | Percentage of Original List Price Received
Detached Single ~ 98% (Rolling 12 Months Avg) & ~ 97.8% (Dec 24′)
Attached Single ~ 98.6% (Rolling 12 Months Avg) & ~ 97.2% (Dec 24′)
Lastly, Percentage of Original List Price Received to Closed Price is a metric that showcases what the average accepted purchase price is relative to the list price. How much below asking price can an offer go while still getting accepted? How much would one have to offer above ask in order to be an above average purchase price?
The End | Have A Great Day!
Please note all of these metrics are along a spectrum as opposed to a specific number. Below is “The Weekly Market Activity Report” which is a research tool reflecting residential real estate activity within the 77 officially defined Chicago community areas provided by the Chicago Association of Realtors®. It is essential to keep in mind that real estate markets can vary across neighborhoods and property types within a city. In conclusion, economic conditions and external factors can influence market trends. Staying updated on these metrics and trends is crucial for making informed decisions.