Facebook
 X
X
 Pinterest
 Copy Link

January 2025 | Week 3
Matthew Litzenberger a third generation Realtor with Coldwell Banker Realty helps buyers and sellers understand Chicago Real Estate Market metrics. Follow along for weekly updates on all things Chicago Real Estate by clicking here.
Introduction
Hello and welcome. This weekly series is aimed to help understand current Chicago Real Estate Market Metrics. While there are many metrics to talk about in the world of real estate, today we are going to look at four: speed, demand, supply and negotiations. Let’s get started!
Summary | TLDR
Demand is outpacing New Listings. This could lead to sharp decreases in Market Time. Increases in SP:LP. Futher salt in the wound, buyers are desperate for new inventory. Continuning this way will also increase prices. However! Are these properites even worth their sales price? If inventory ever tips back towards balance. The hangover for sellers and first homebuyers will be painful as that could result in home equity evaporating. This theory is probably not the likley outcome. New Construction production would need to be near a historic rate. Unlikely to say the lease. The leading outcome we are witnessing America turn into a renters economy.
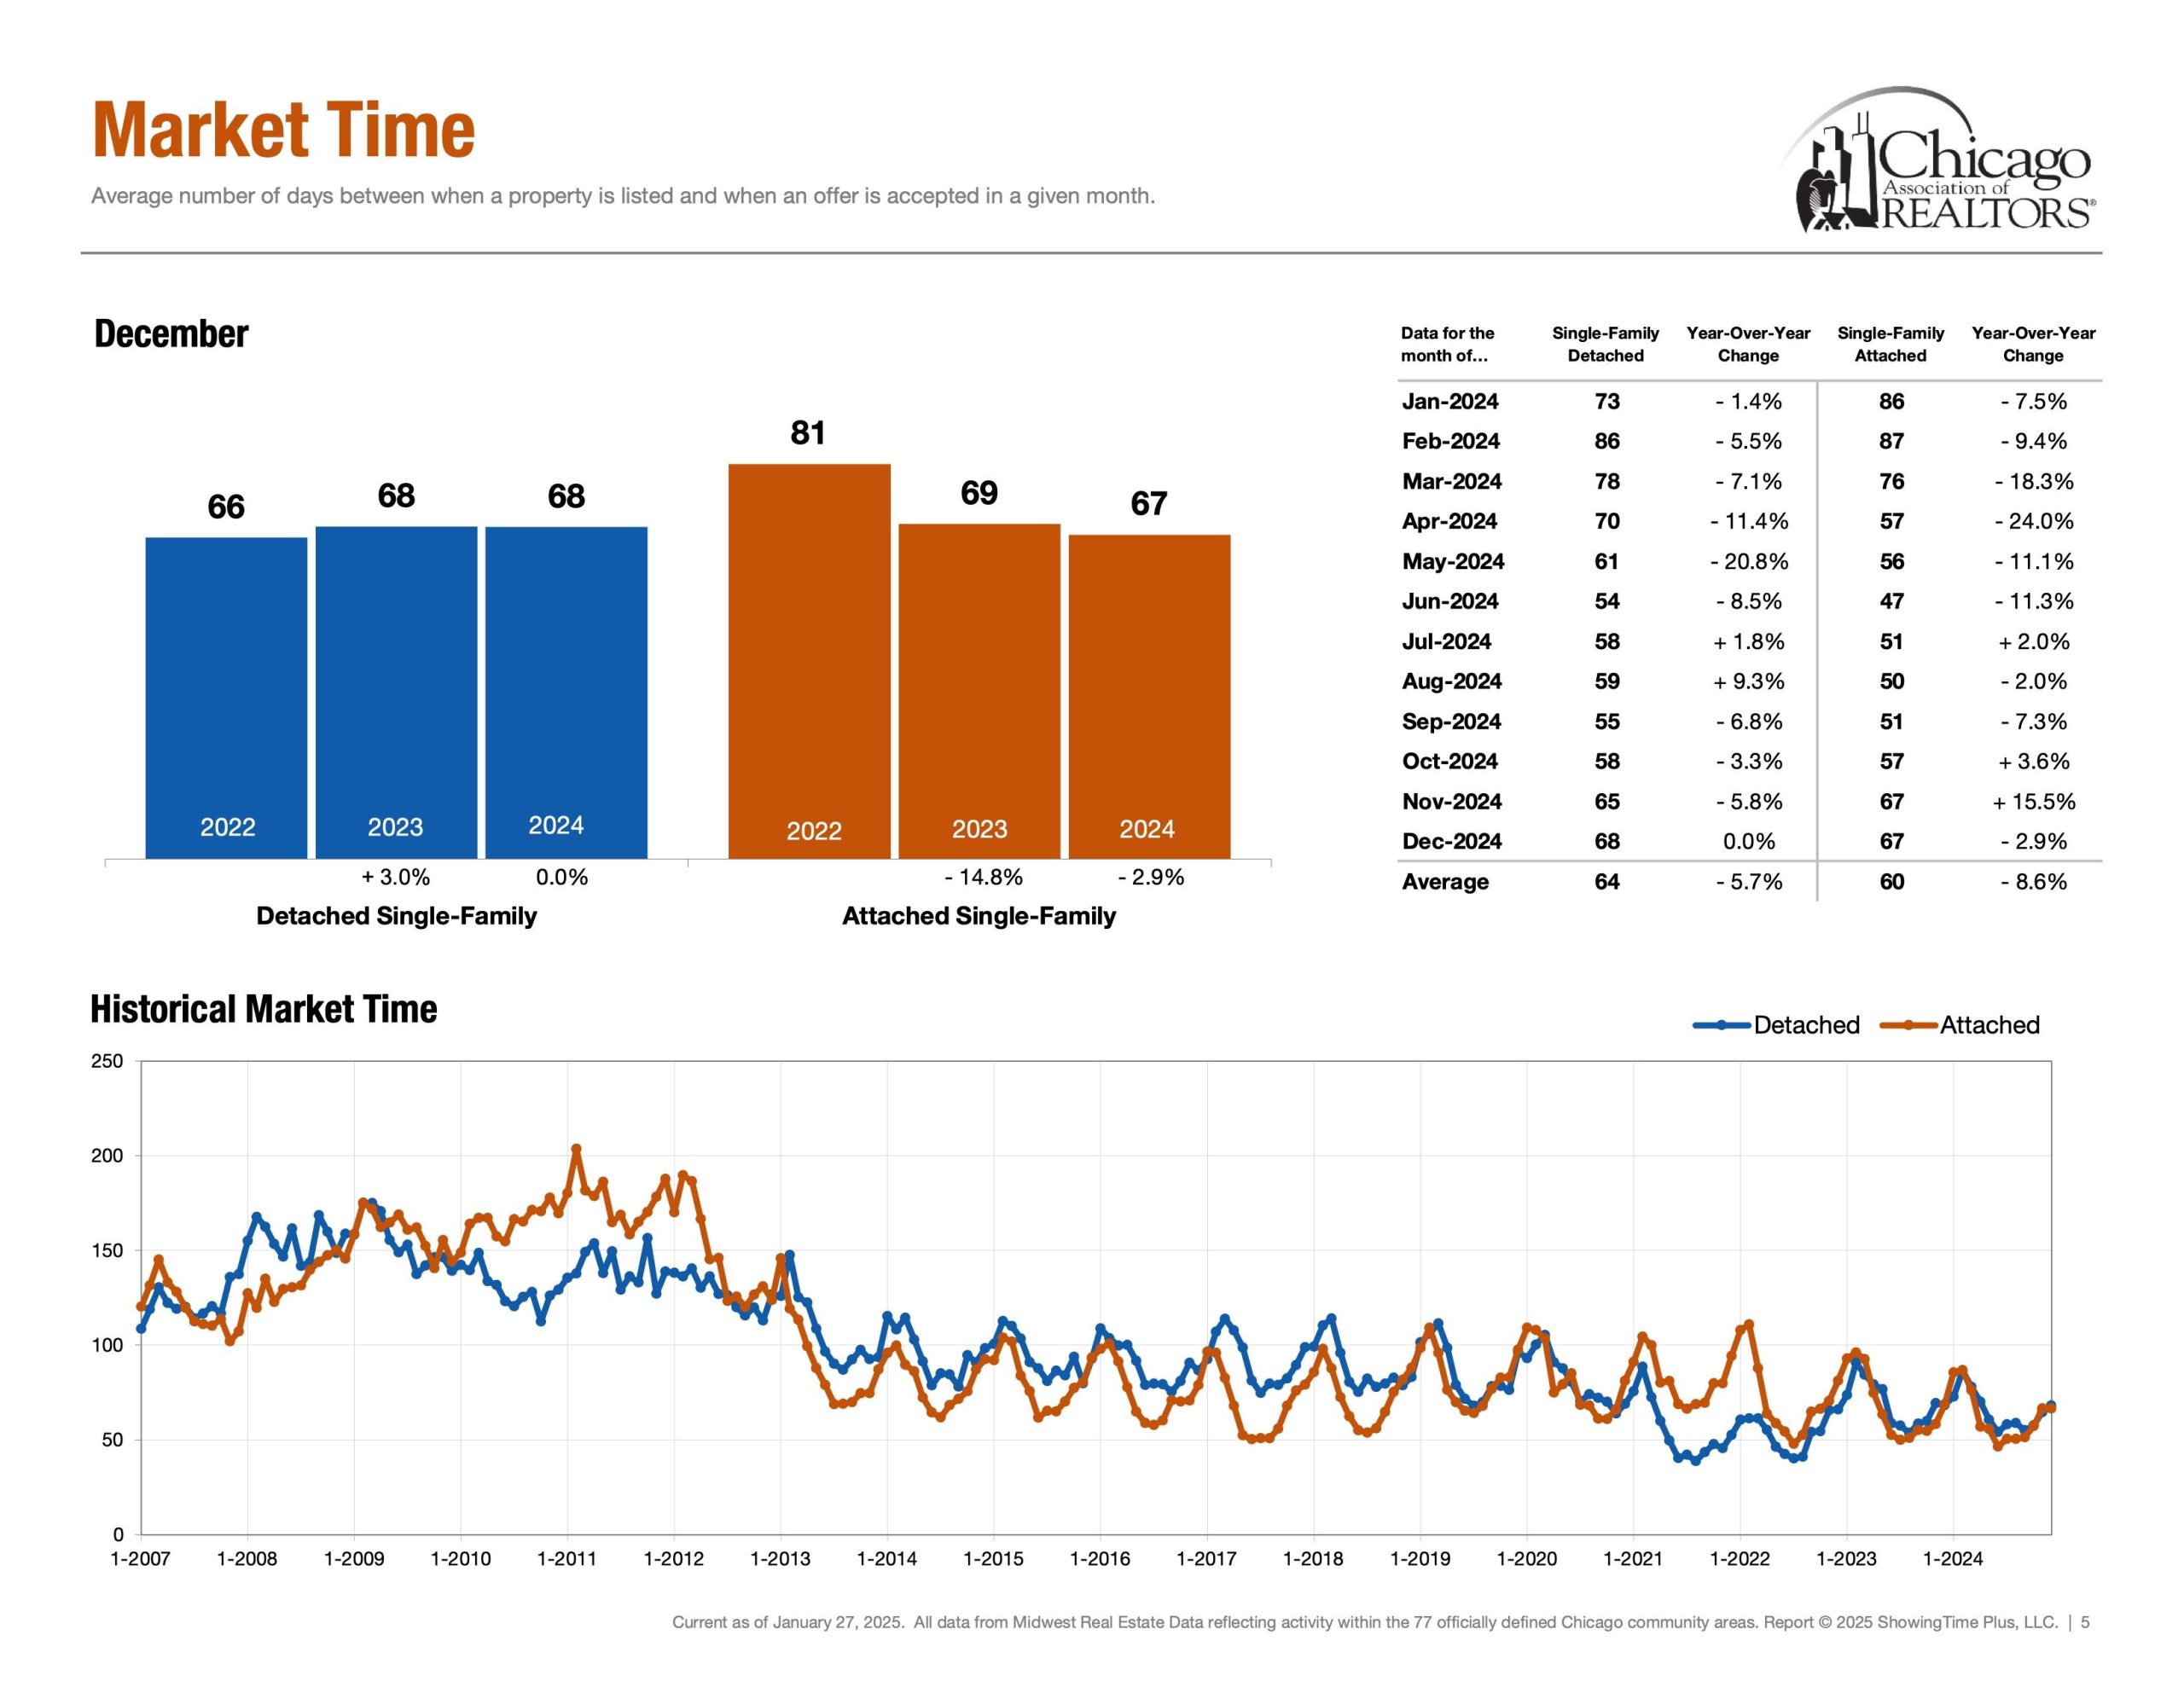
Speed | Healthy Market Time Range
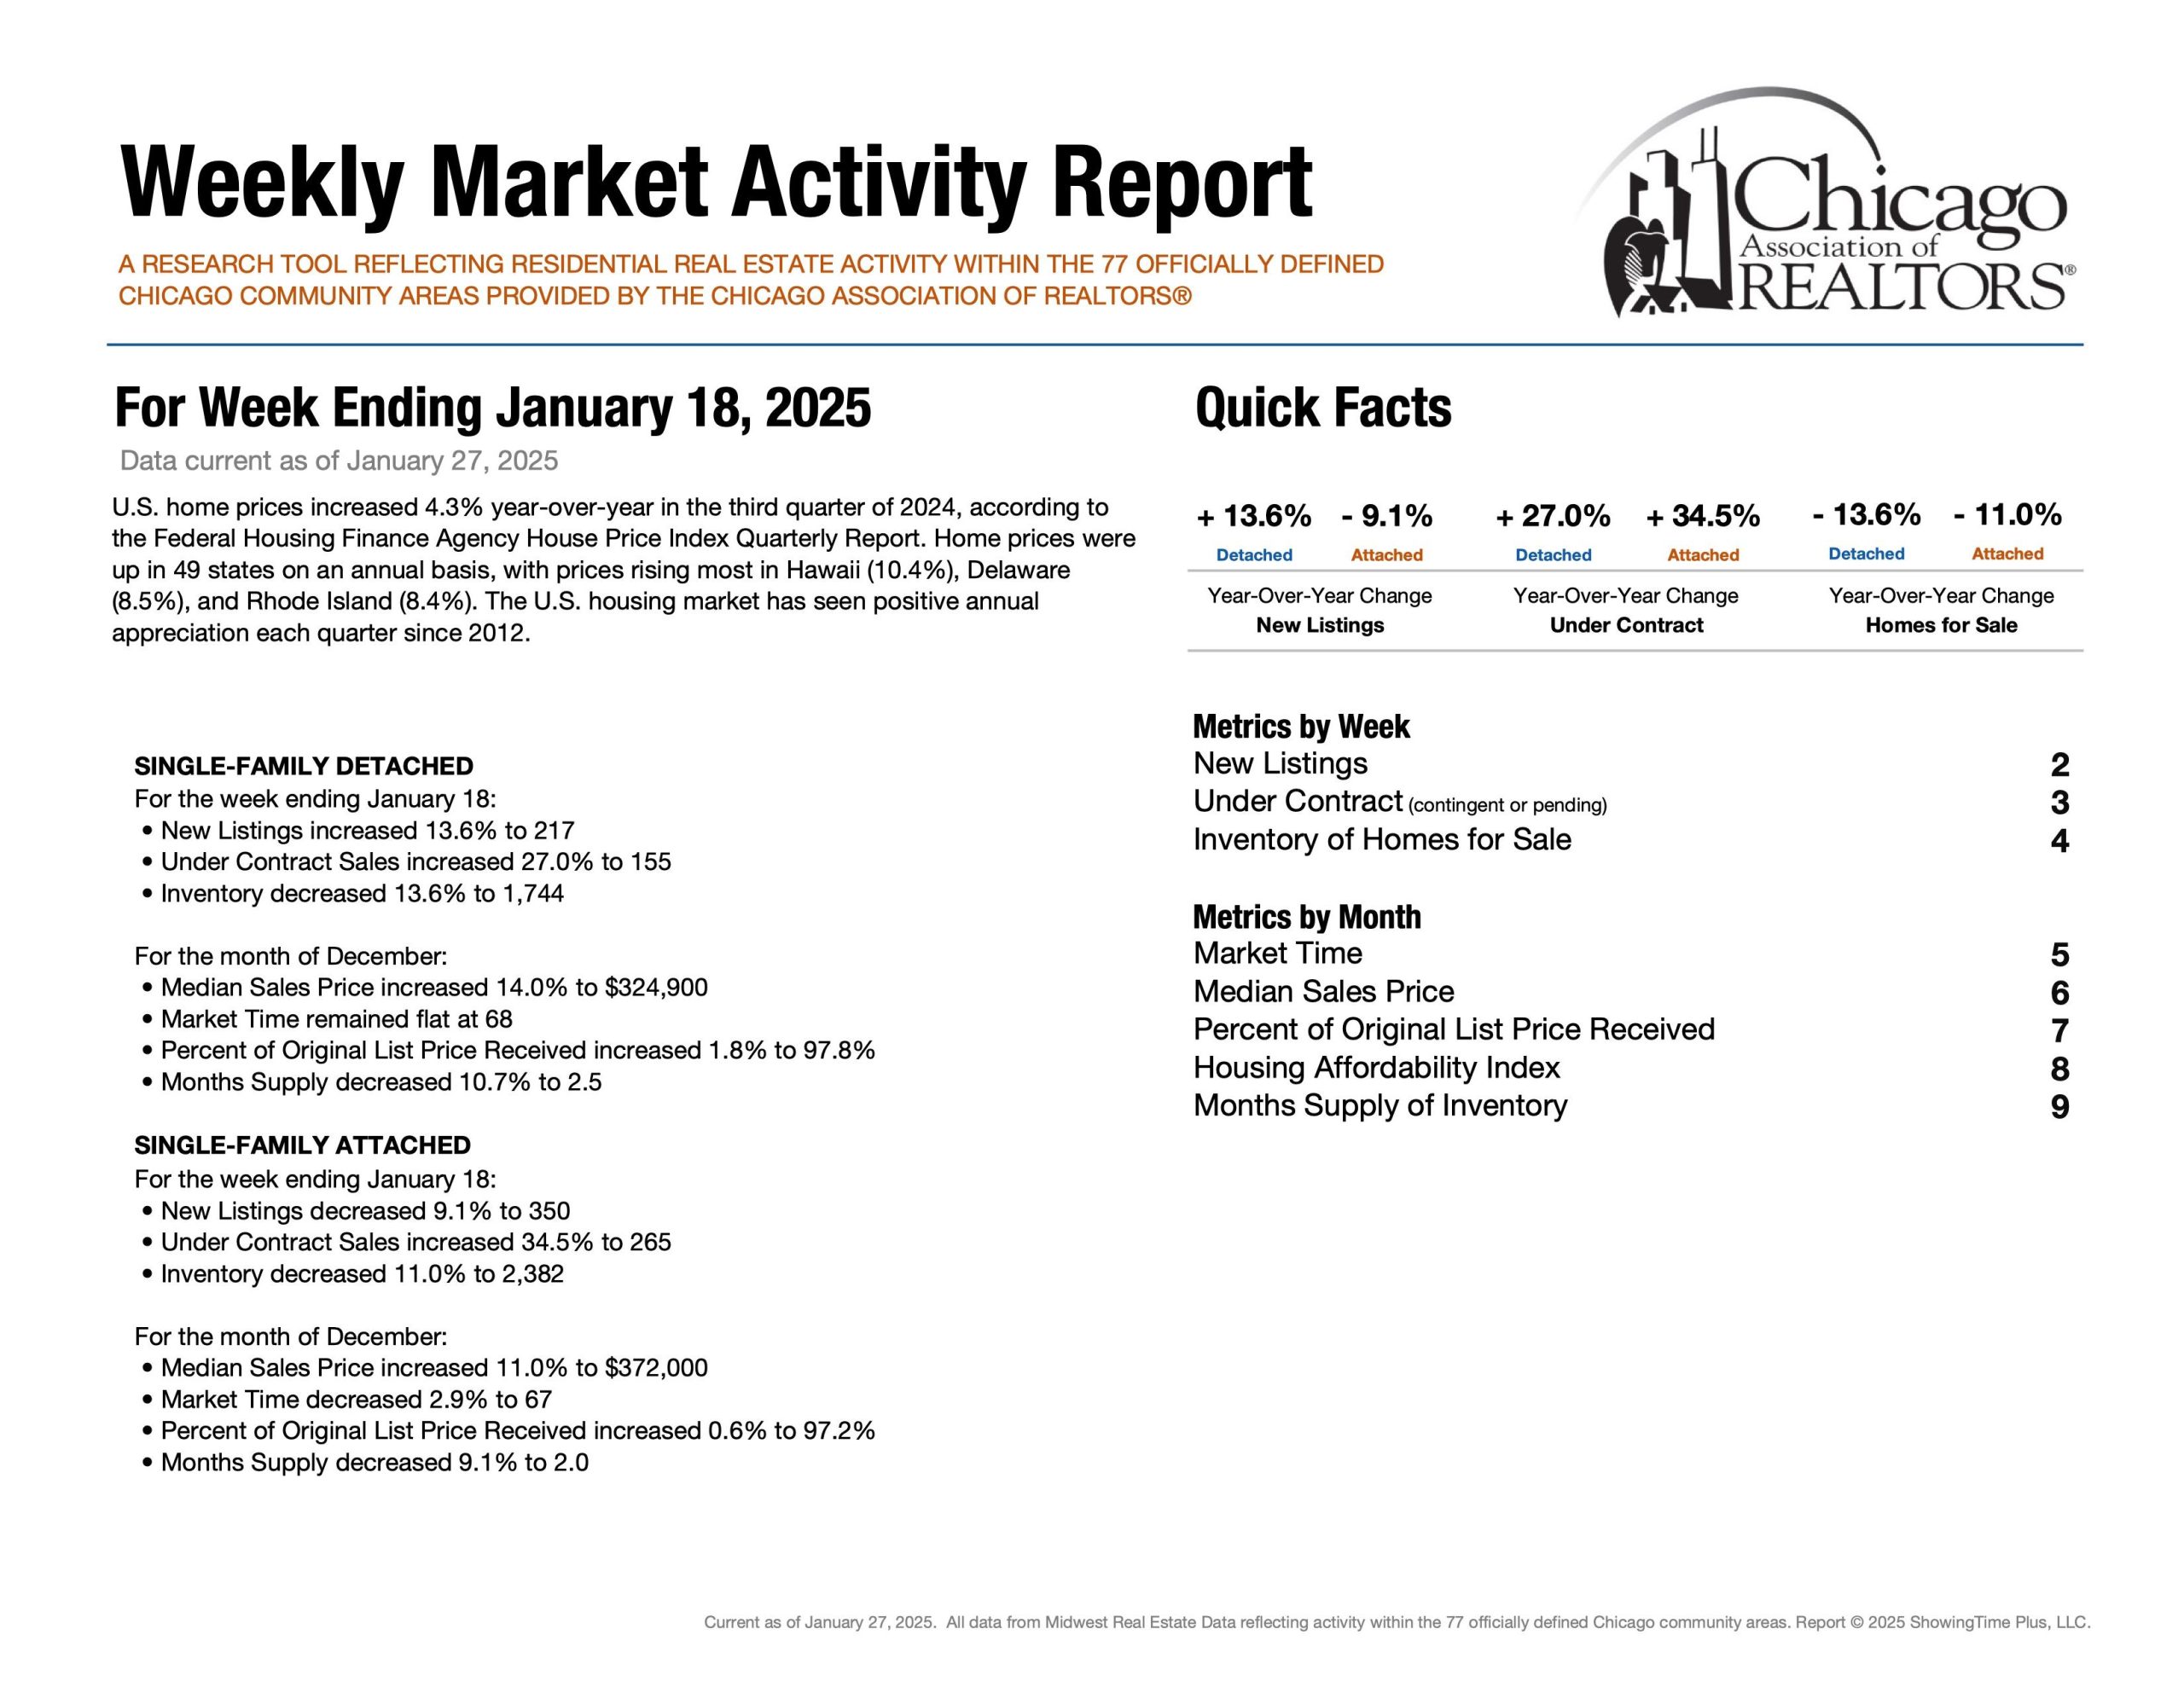
Detached Single ~ 68 Days (Dec 24′)
Attached Single ~ 67 Days (Dec 24′)
First, market time is metric that showcases speed and whether a listing was priced too low, priced properly or priced too high. If a listing surpasses average days on market, it is a check engine light that your listing maybe overpriced. Interestingly, Dec 2024 Year over Year change for Market time was 0.0%, 68 days on Market. Please note that Market Time in our context measures the distance from when a property was listed and when an offer was accepted in a given month.
Demand | Under Contract
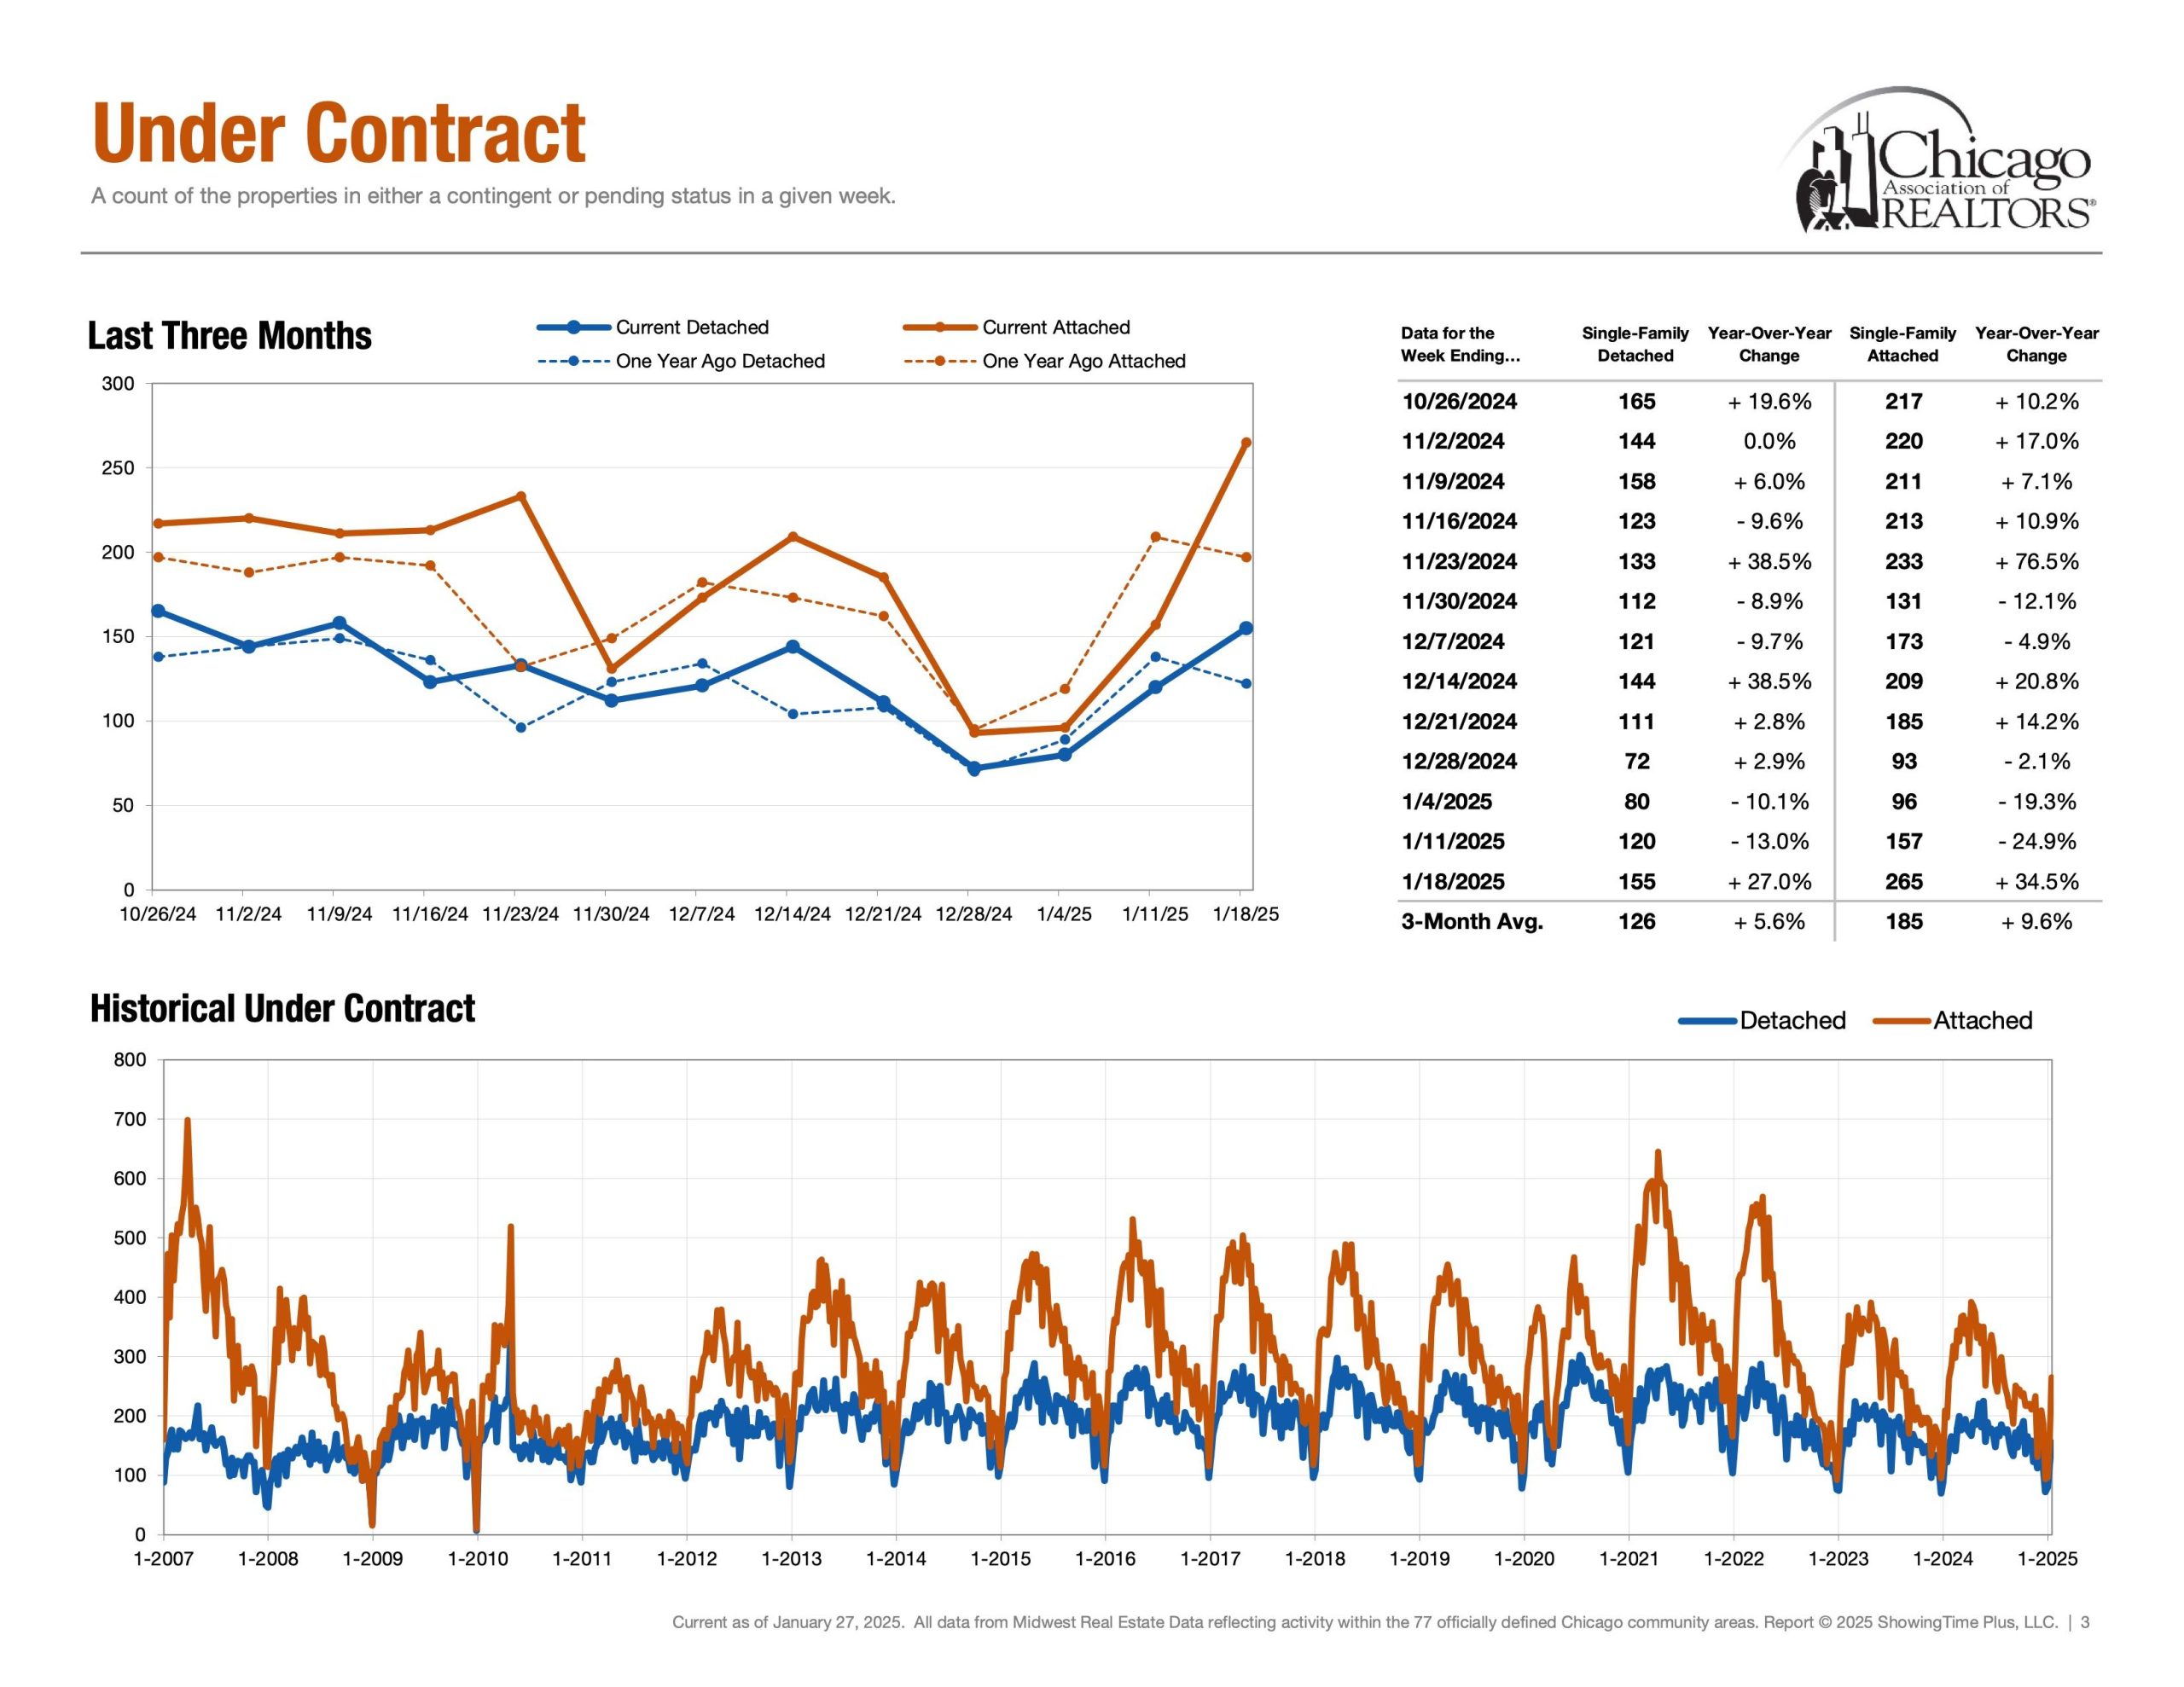
Detached Single = 155 Properties (Jan 12th – Jan 18th)
Attached Single = 265 Properties (Jan 12th – Jan 18th)
Secondly, under contract helps answer the question, “In our current market, how many buyers are buying?” Showcasing the heartbeat of the real estate market. Interestingly, demand metrics become more insightful when compared and contrasted with supply/inventory metrics. Demand spiked this week. Suppassing last year. Detached +27.0%. Attached +34.5%.
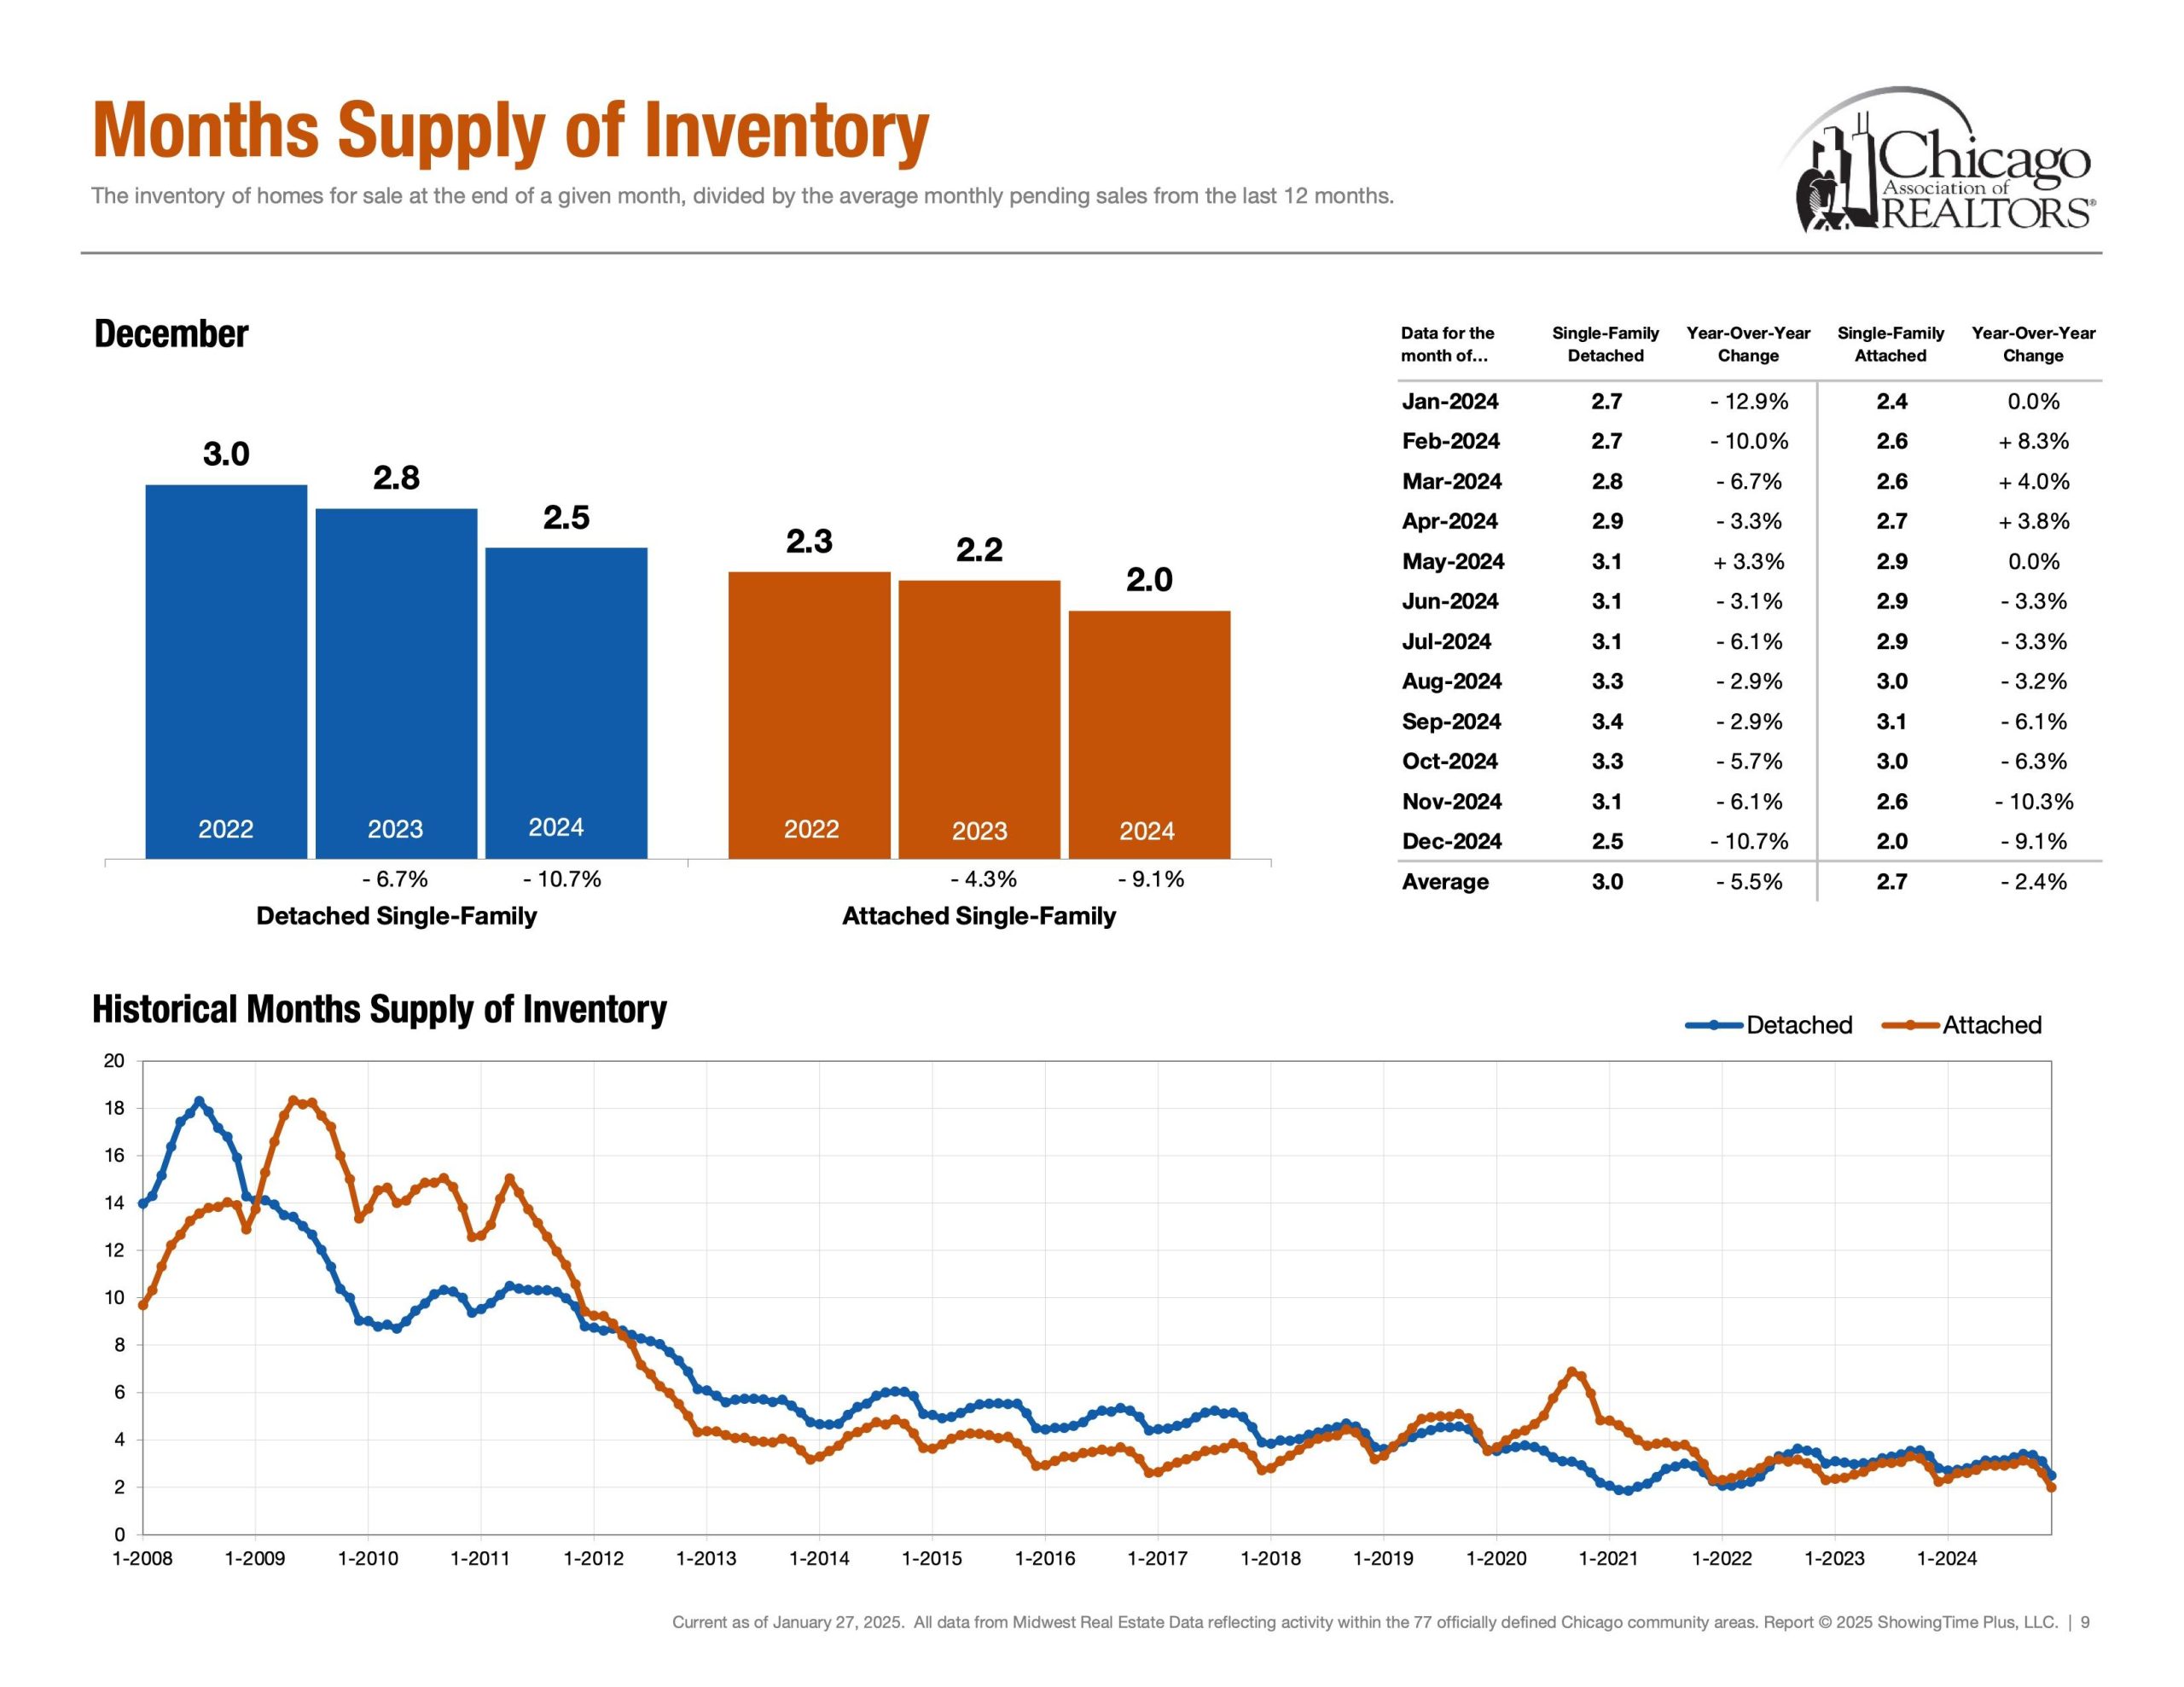
Supply | Inventory of Homes for Sale
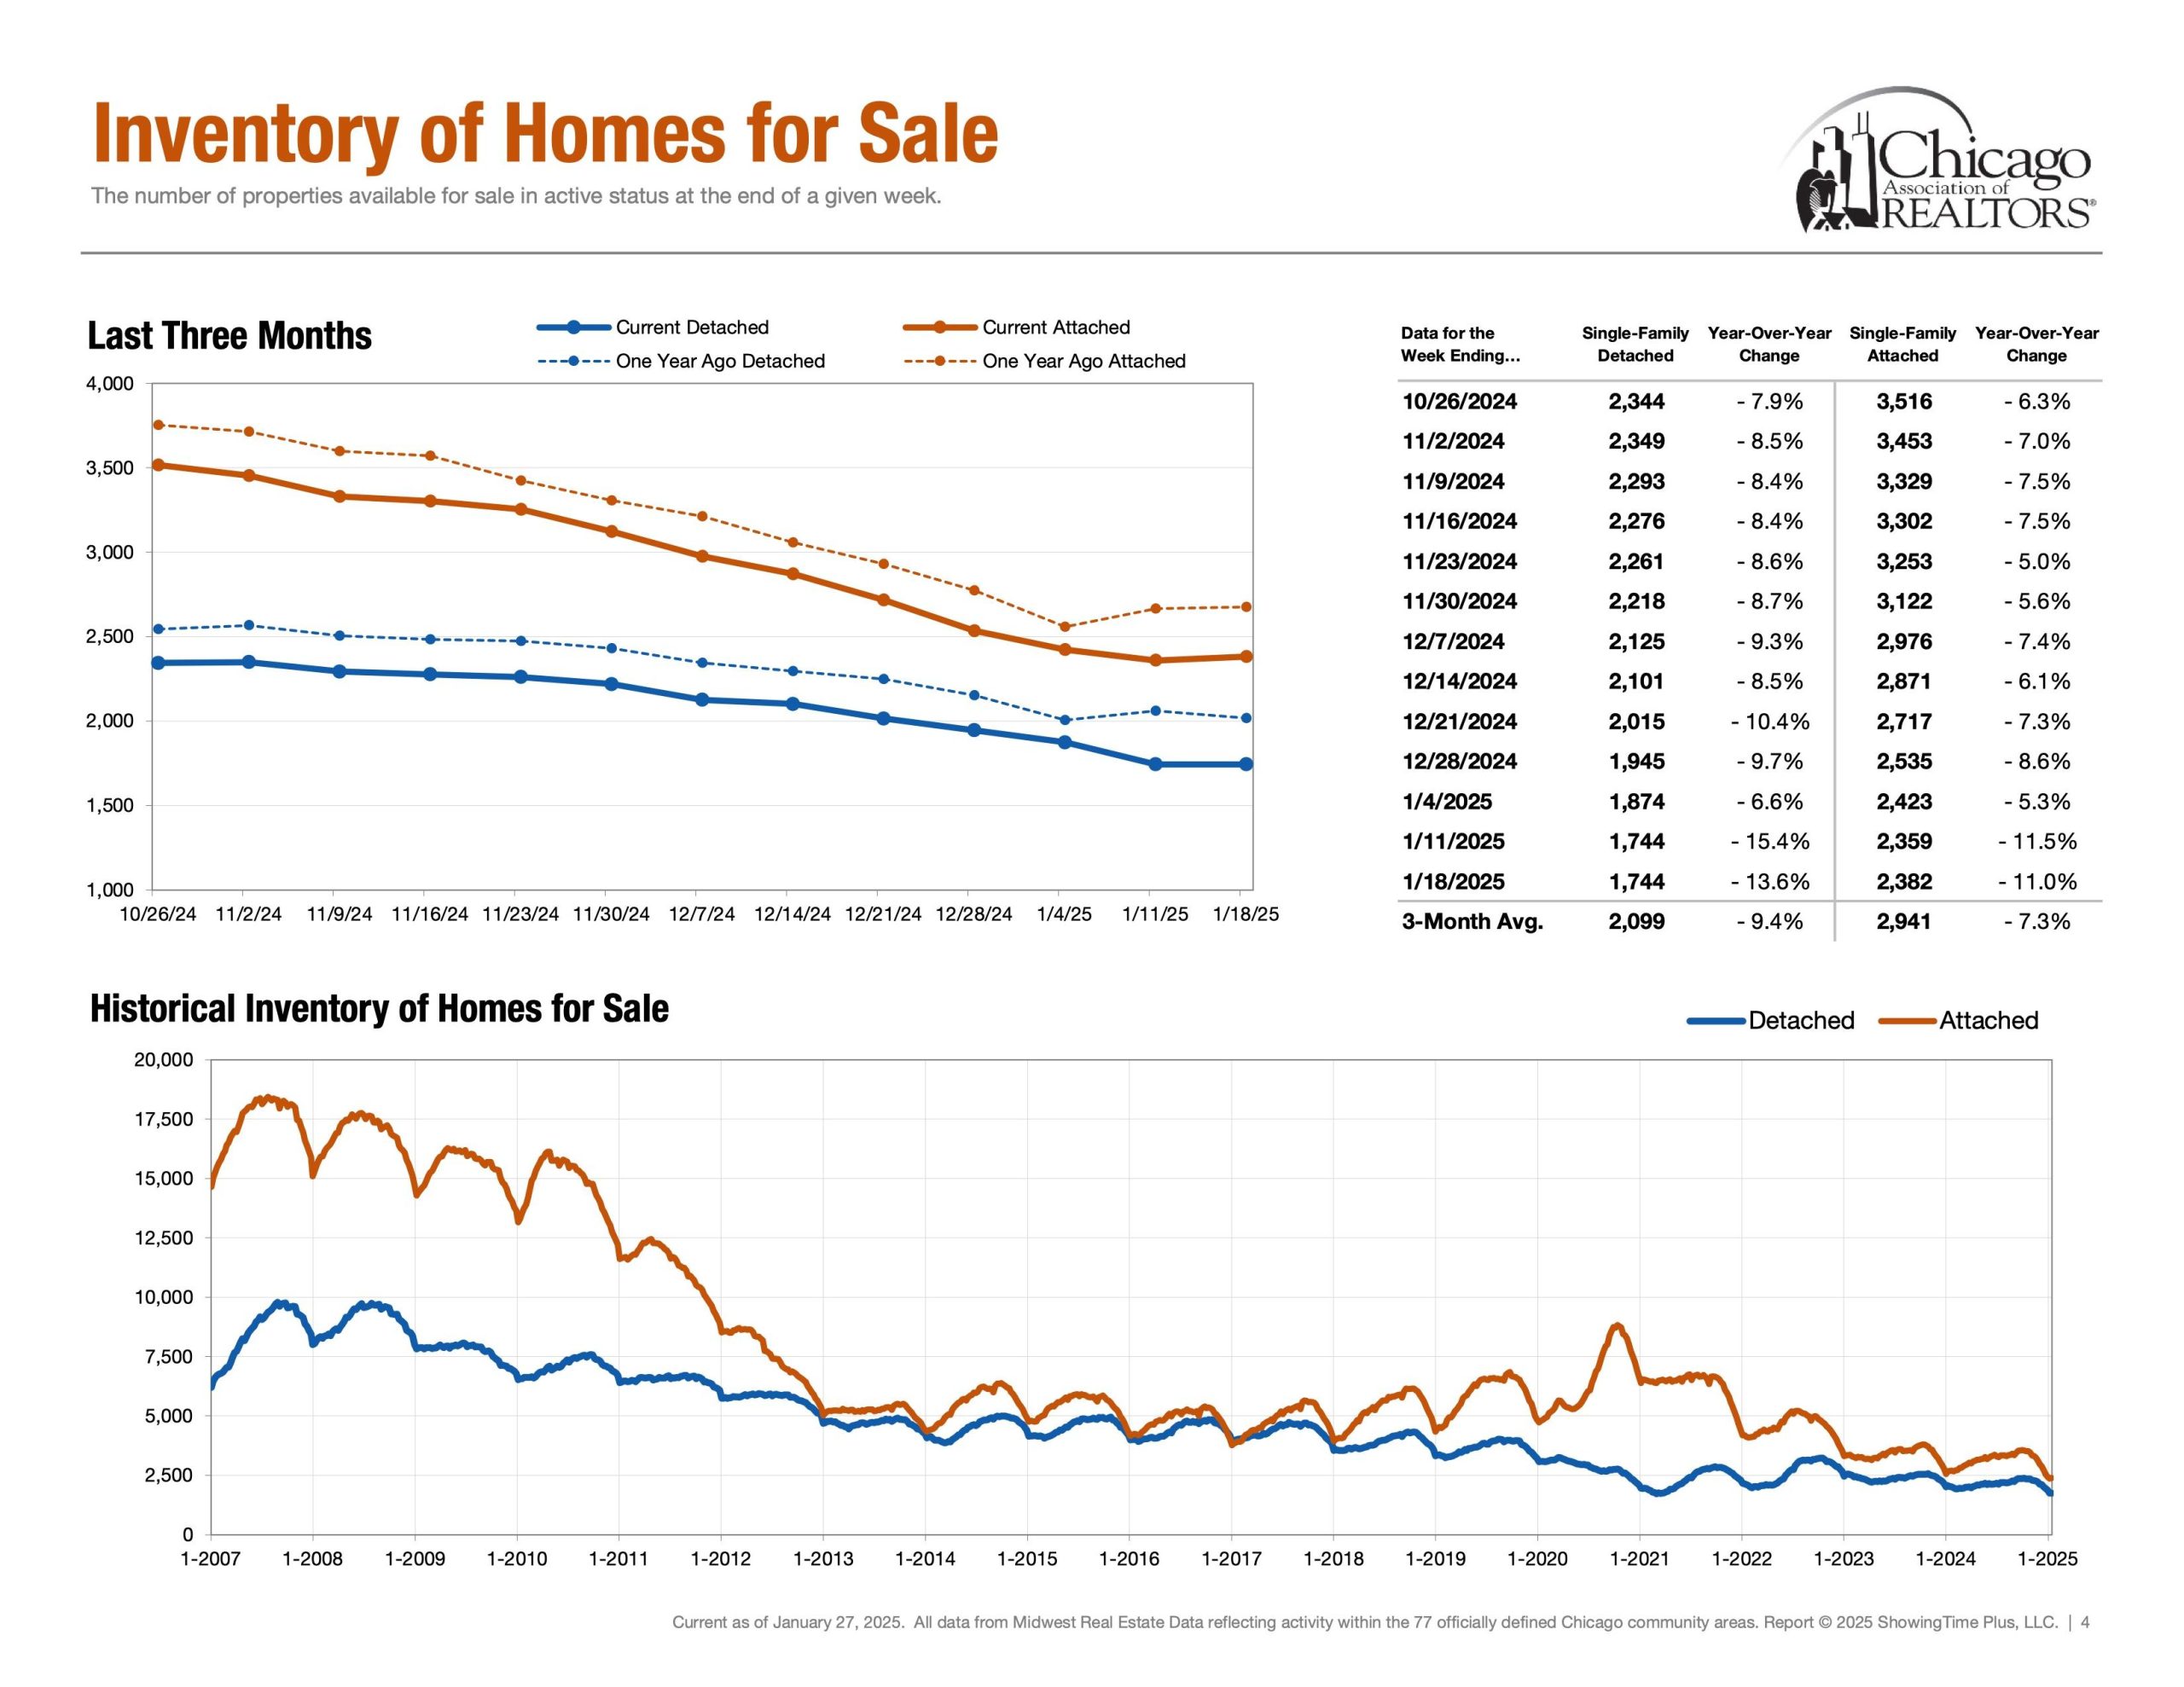
Detached Single = 1,744 Properties (Jan 12th – Jan 18th)
Attached Single = 2,382 Properties (Jan 12th – Jan 18th)
Next, probably the metric of the year. Inventory of homes for sale showcases supply and answers the question, “How much inventory is available for buyers and how much competition sellers are up against?” Additionally, Months of Inventory, Homes for Sale, New Listings and Absorption Rate are also other key metrics in the conversation of supply.
Supply | New Listings
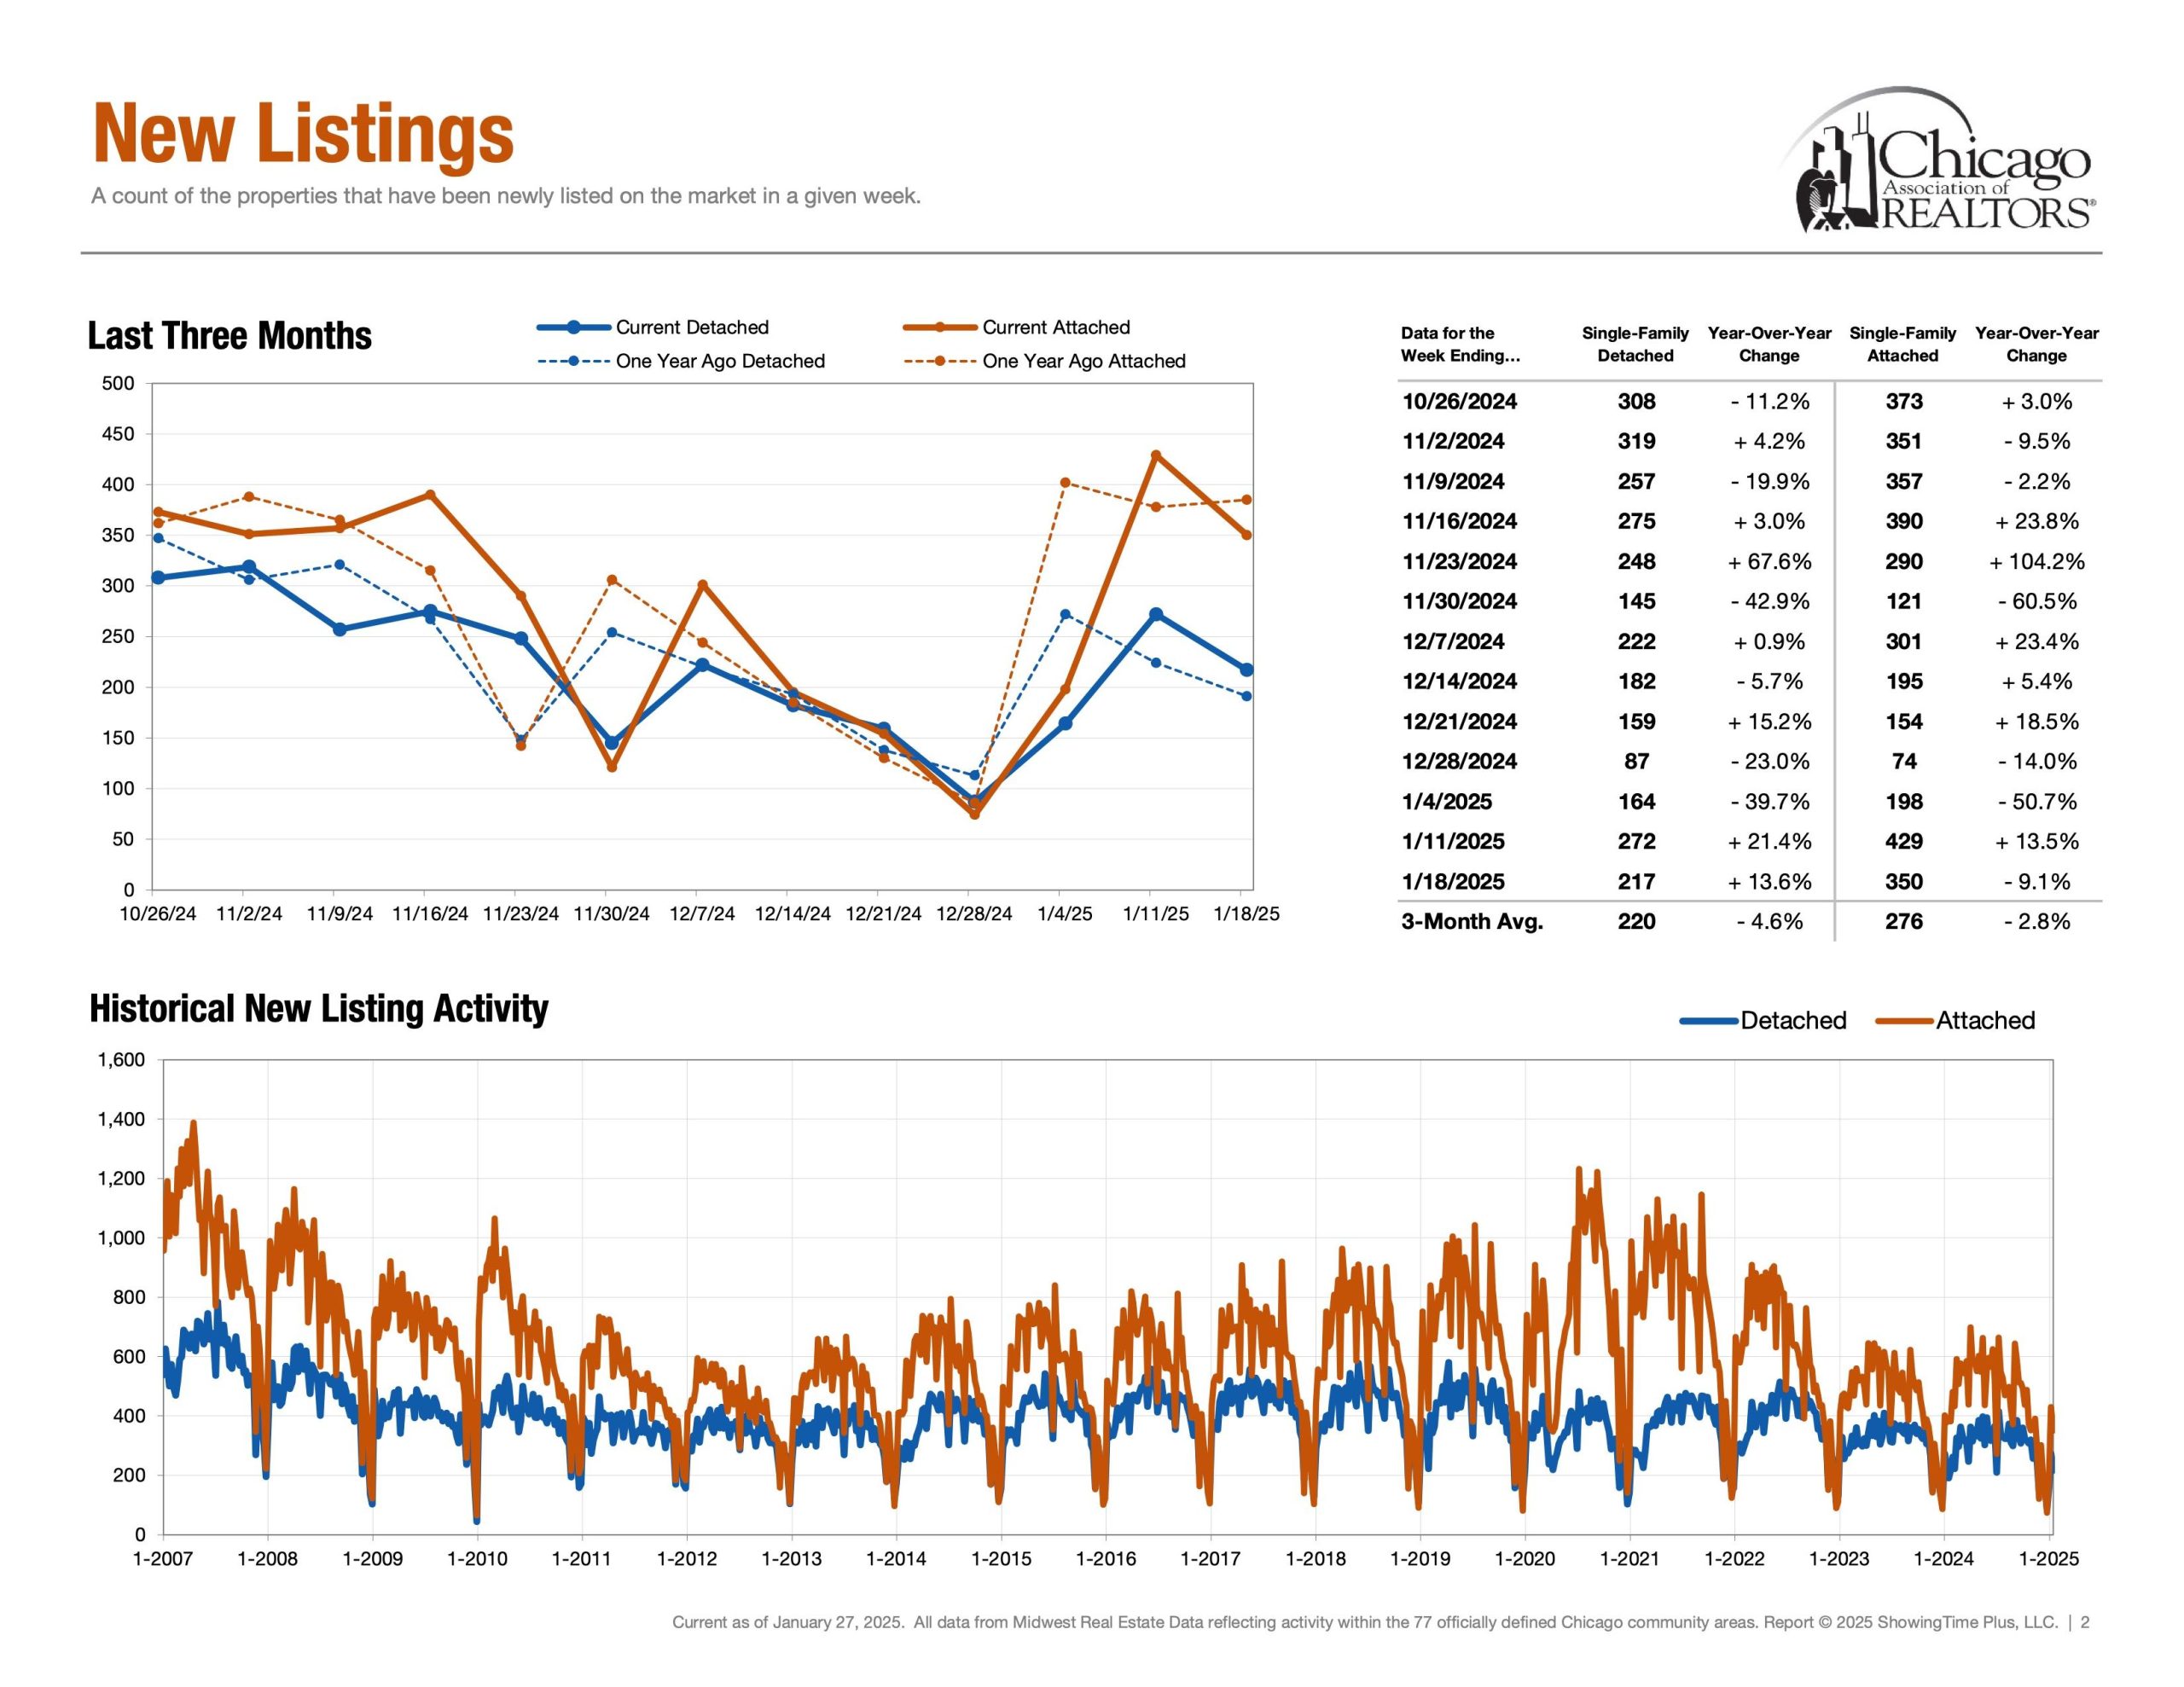
Detached Single = 217 Properties (Jan 12th – Jan 18th)
Attached Single = 350 Properties (Jan 12th – Jan 18th)
New Listings is a foreshadowing metric and helps visualize when inventory enters the market. Looking at the week of Jan 12th to Jan 18th. Detached Single just narrowly suppassed last year levels. +13.6% While Attached Single fell below last years preformance. -9.1%. These percentages should be taken in context with the amount of units. Which I will refer you to page 2 of the report below.
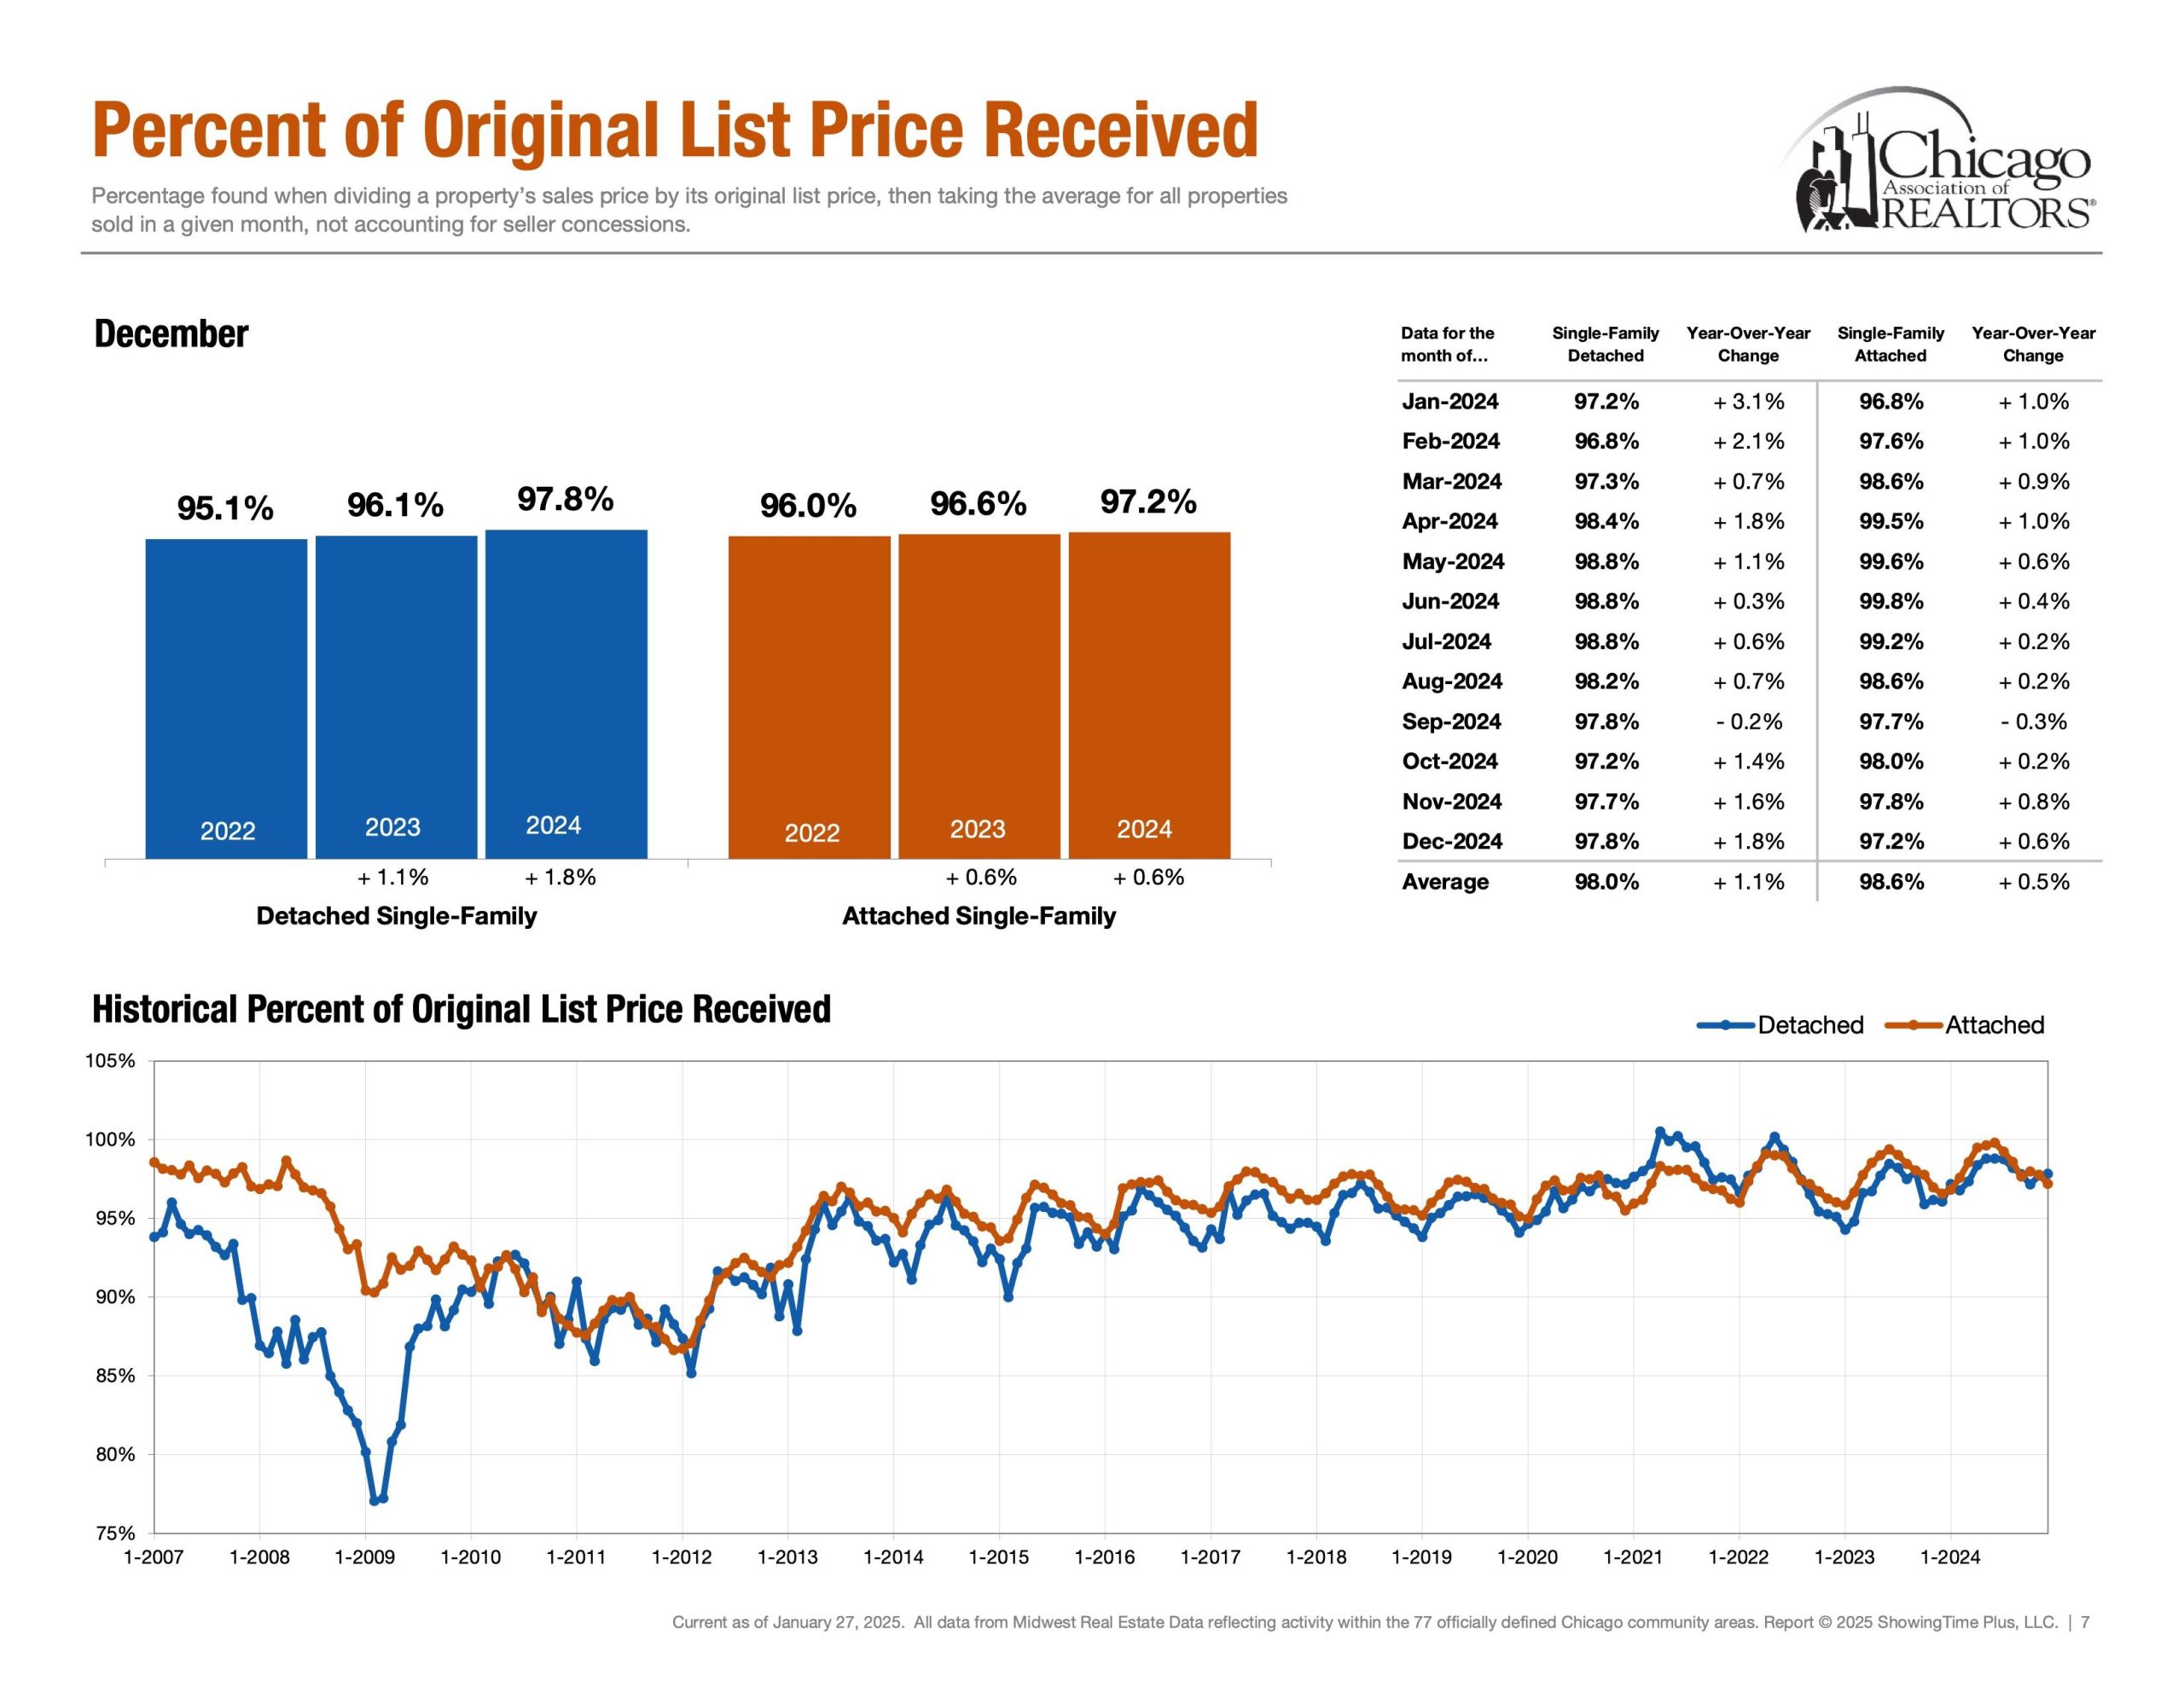
Negotiations | Percentage of Original List Price Received
Detached Single ~ 98% (Rolling 12 Months Avg) & ~ 97.8% (Dec 24′)
Attached Single ~ 98.6% (Rolling 12 Months Avg) & ~ 97.2% (Dec 24′)
Lastly, Percentage of Original List Price Received to Closed Price is a metric that showcases what the average accepted purchase price is relative to the list price. How much below asking price can an offer go while still getting accepted? How much would one have to offer above ask in order to be an above average purchase price?
The End | Have A Great Day!
Please note all of these metrics are along a spectrum as opposed to a specific number. Below is “The Weekly Market Activity Report” which is a research tool reflecting residential real estate activity within the 77 officially defined Chicago community areas provided by the Chicago Association of Realtors®. It is essential to keep in mind that real estate markets can vary across neighborhoods and property types within a city. In conclusion, economic conditions and external factors can influence market trends. Staying updated on these metrics and trends is crucial for making informed decisions.