Facebook
 X
X
 Pinterest
 Copy Link

January 2025 | Week 2
Matthew Litzenberger a third generation Realtor with Coldwell Banker Realty helps buyers and sellers understand Chicago Real Estate Market metrics. Follow along for weekly updates on all things Chicago Real Estate by clicking here.
Introduction
Hello and welcome. This weekly series is aimed to help understand current Chicago Real Estate Market Metrics. While there are many metrics to talk about in the world of real estate, today we are going to look at only four: speed, demand, supply and negotiations. Let’s get started!
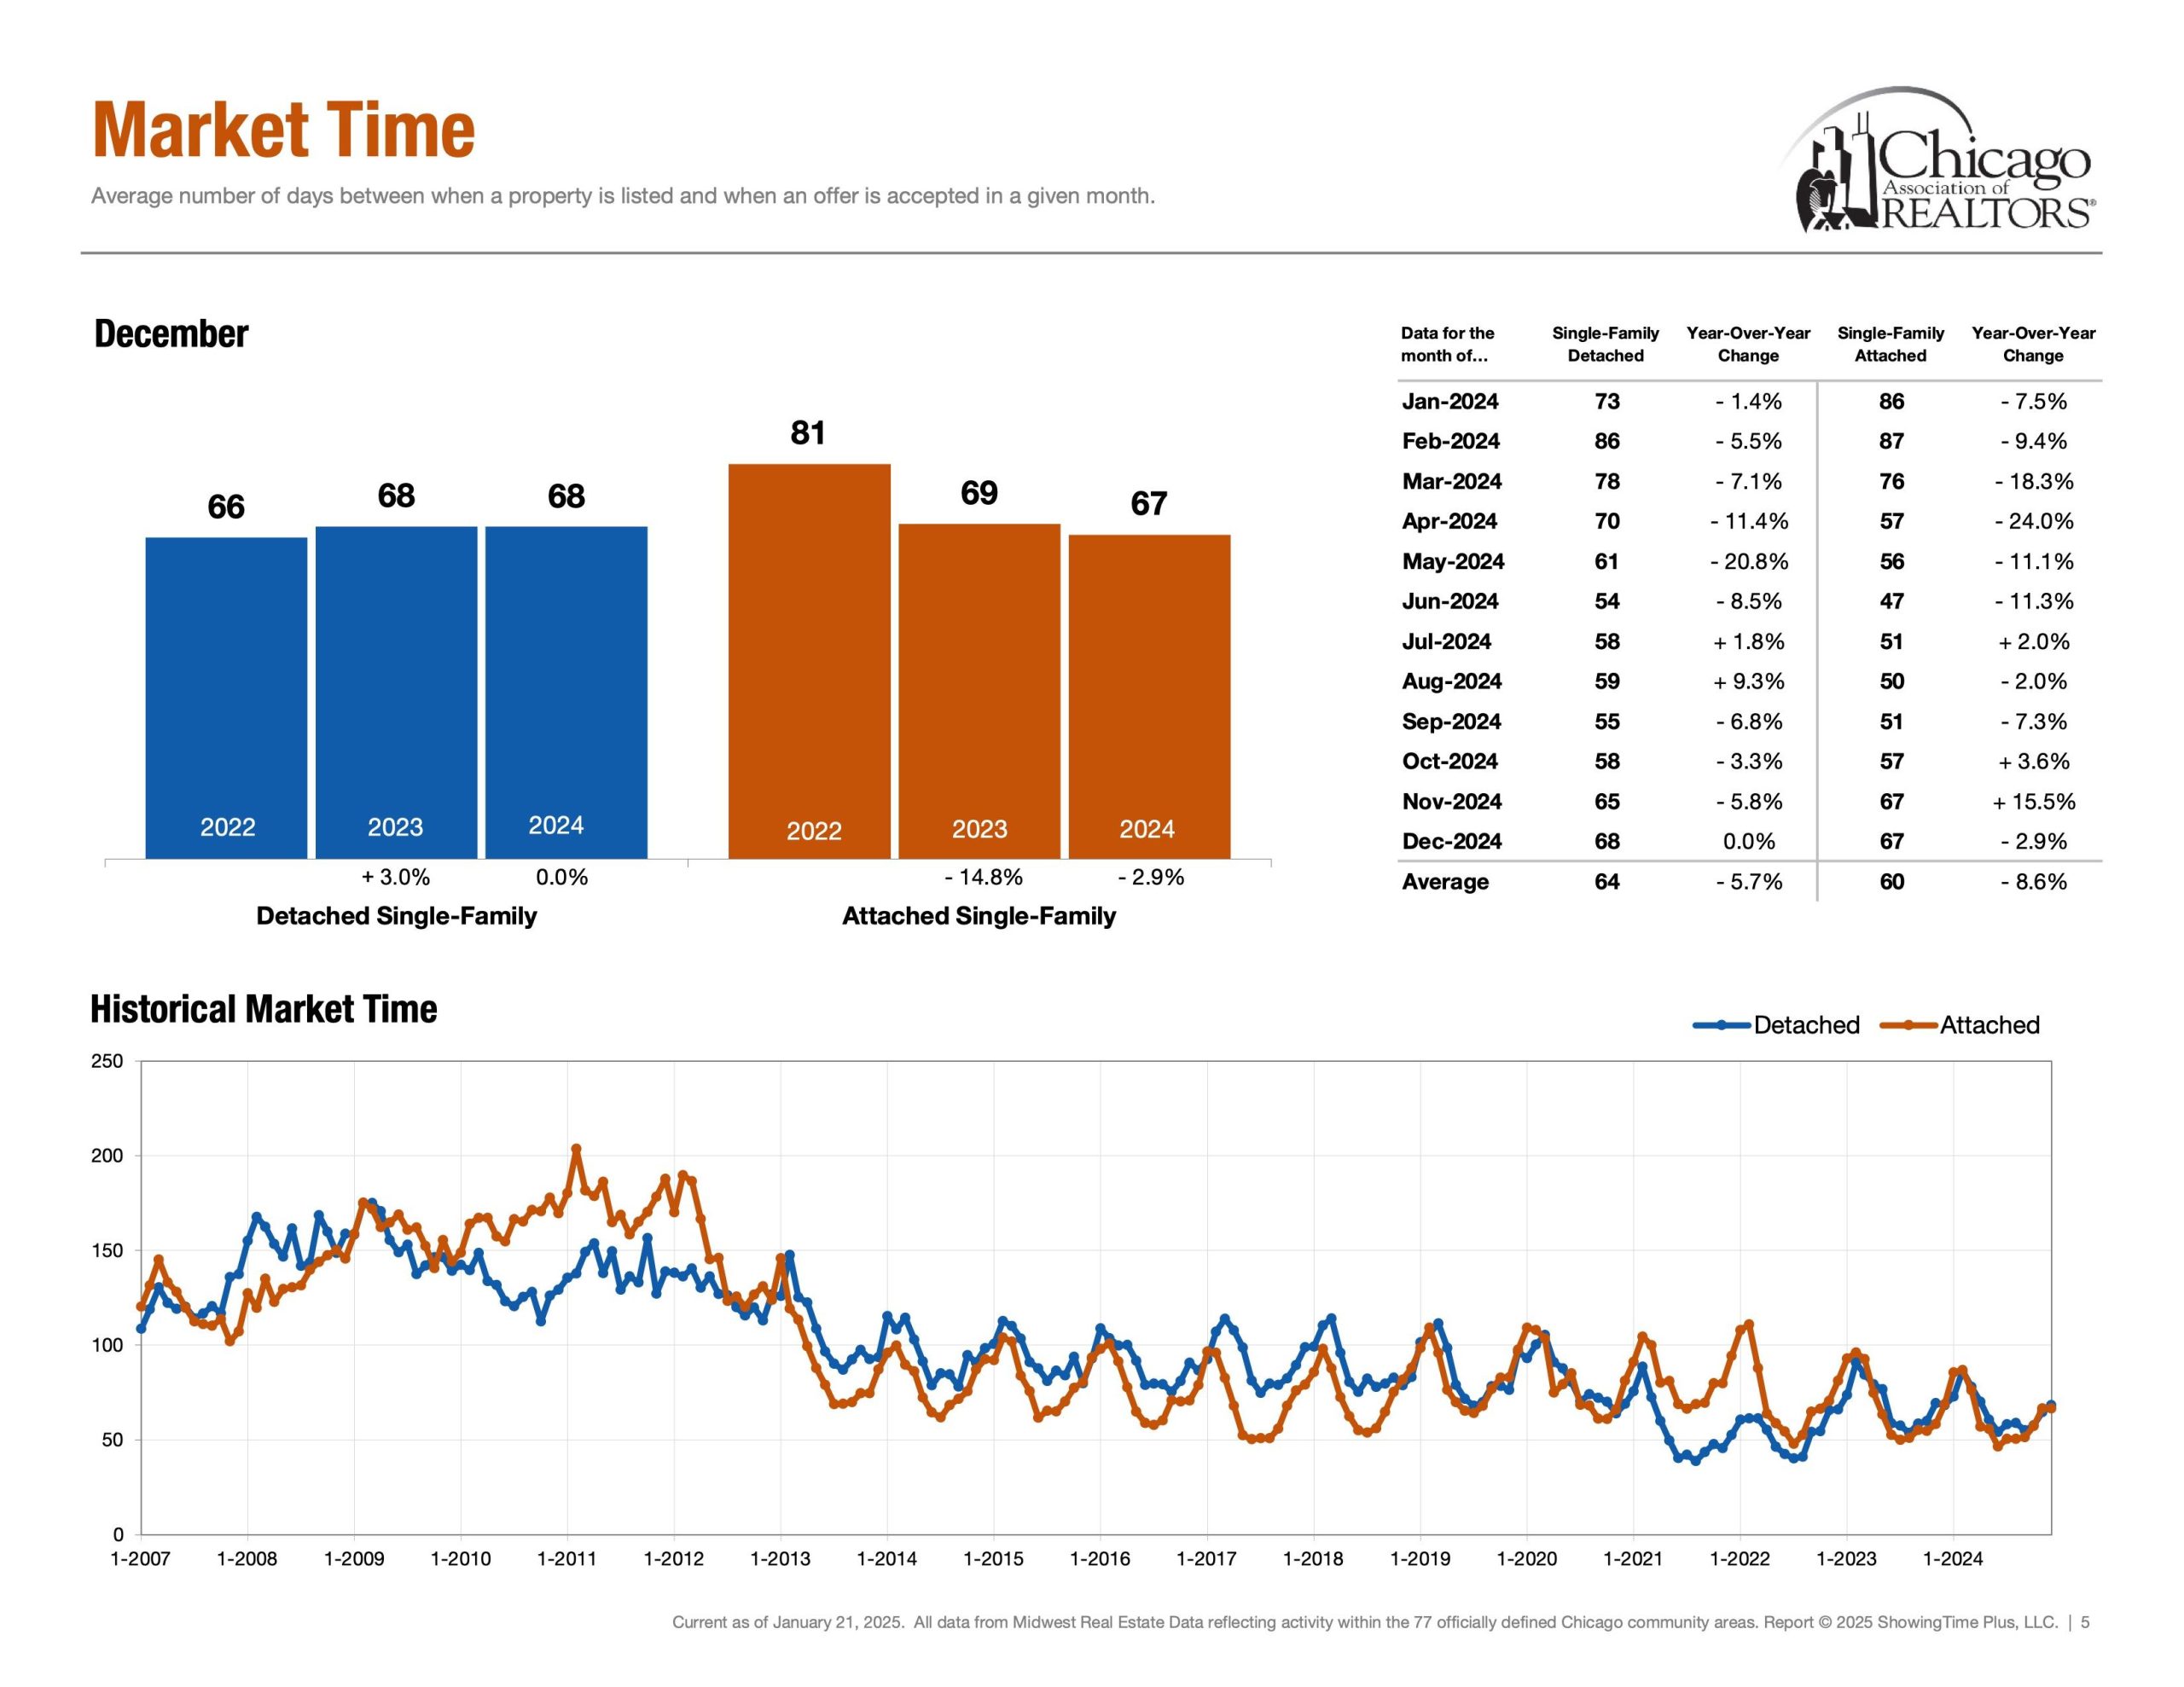
Speed | Healthy Market Time Range
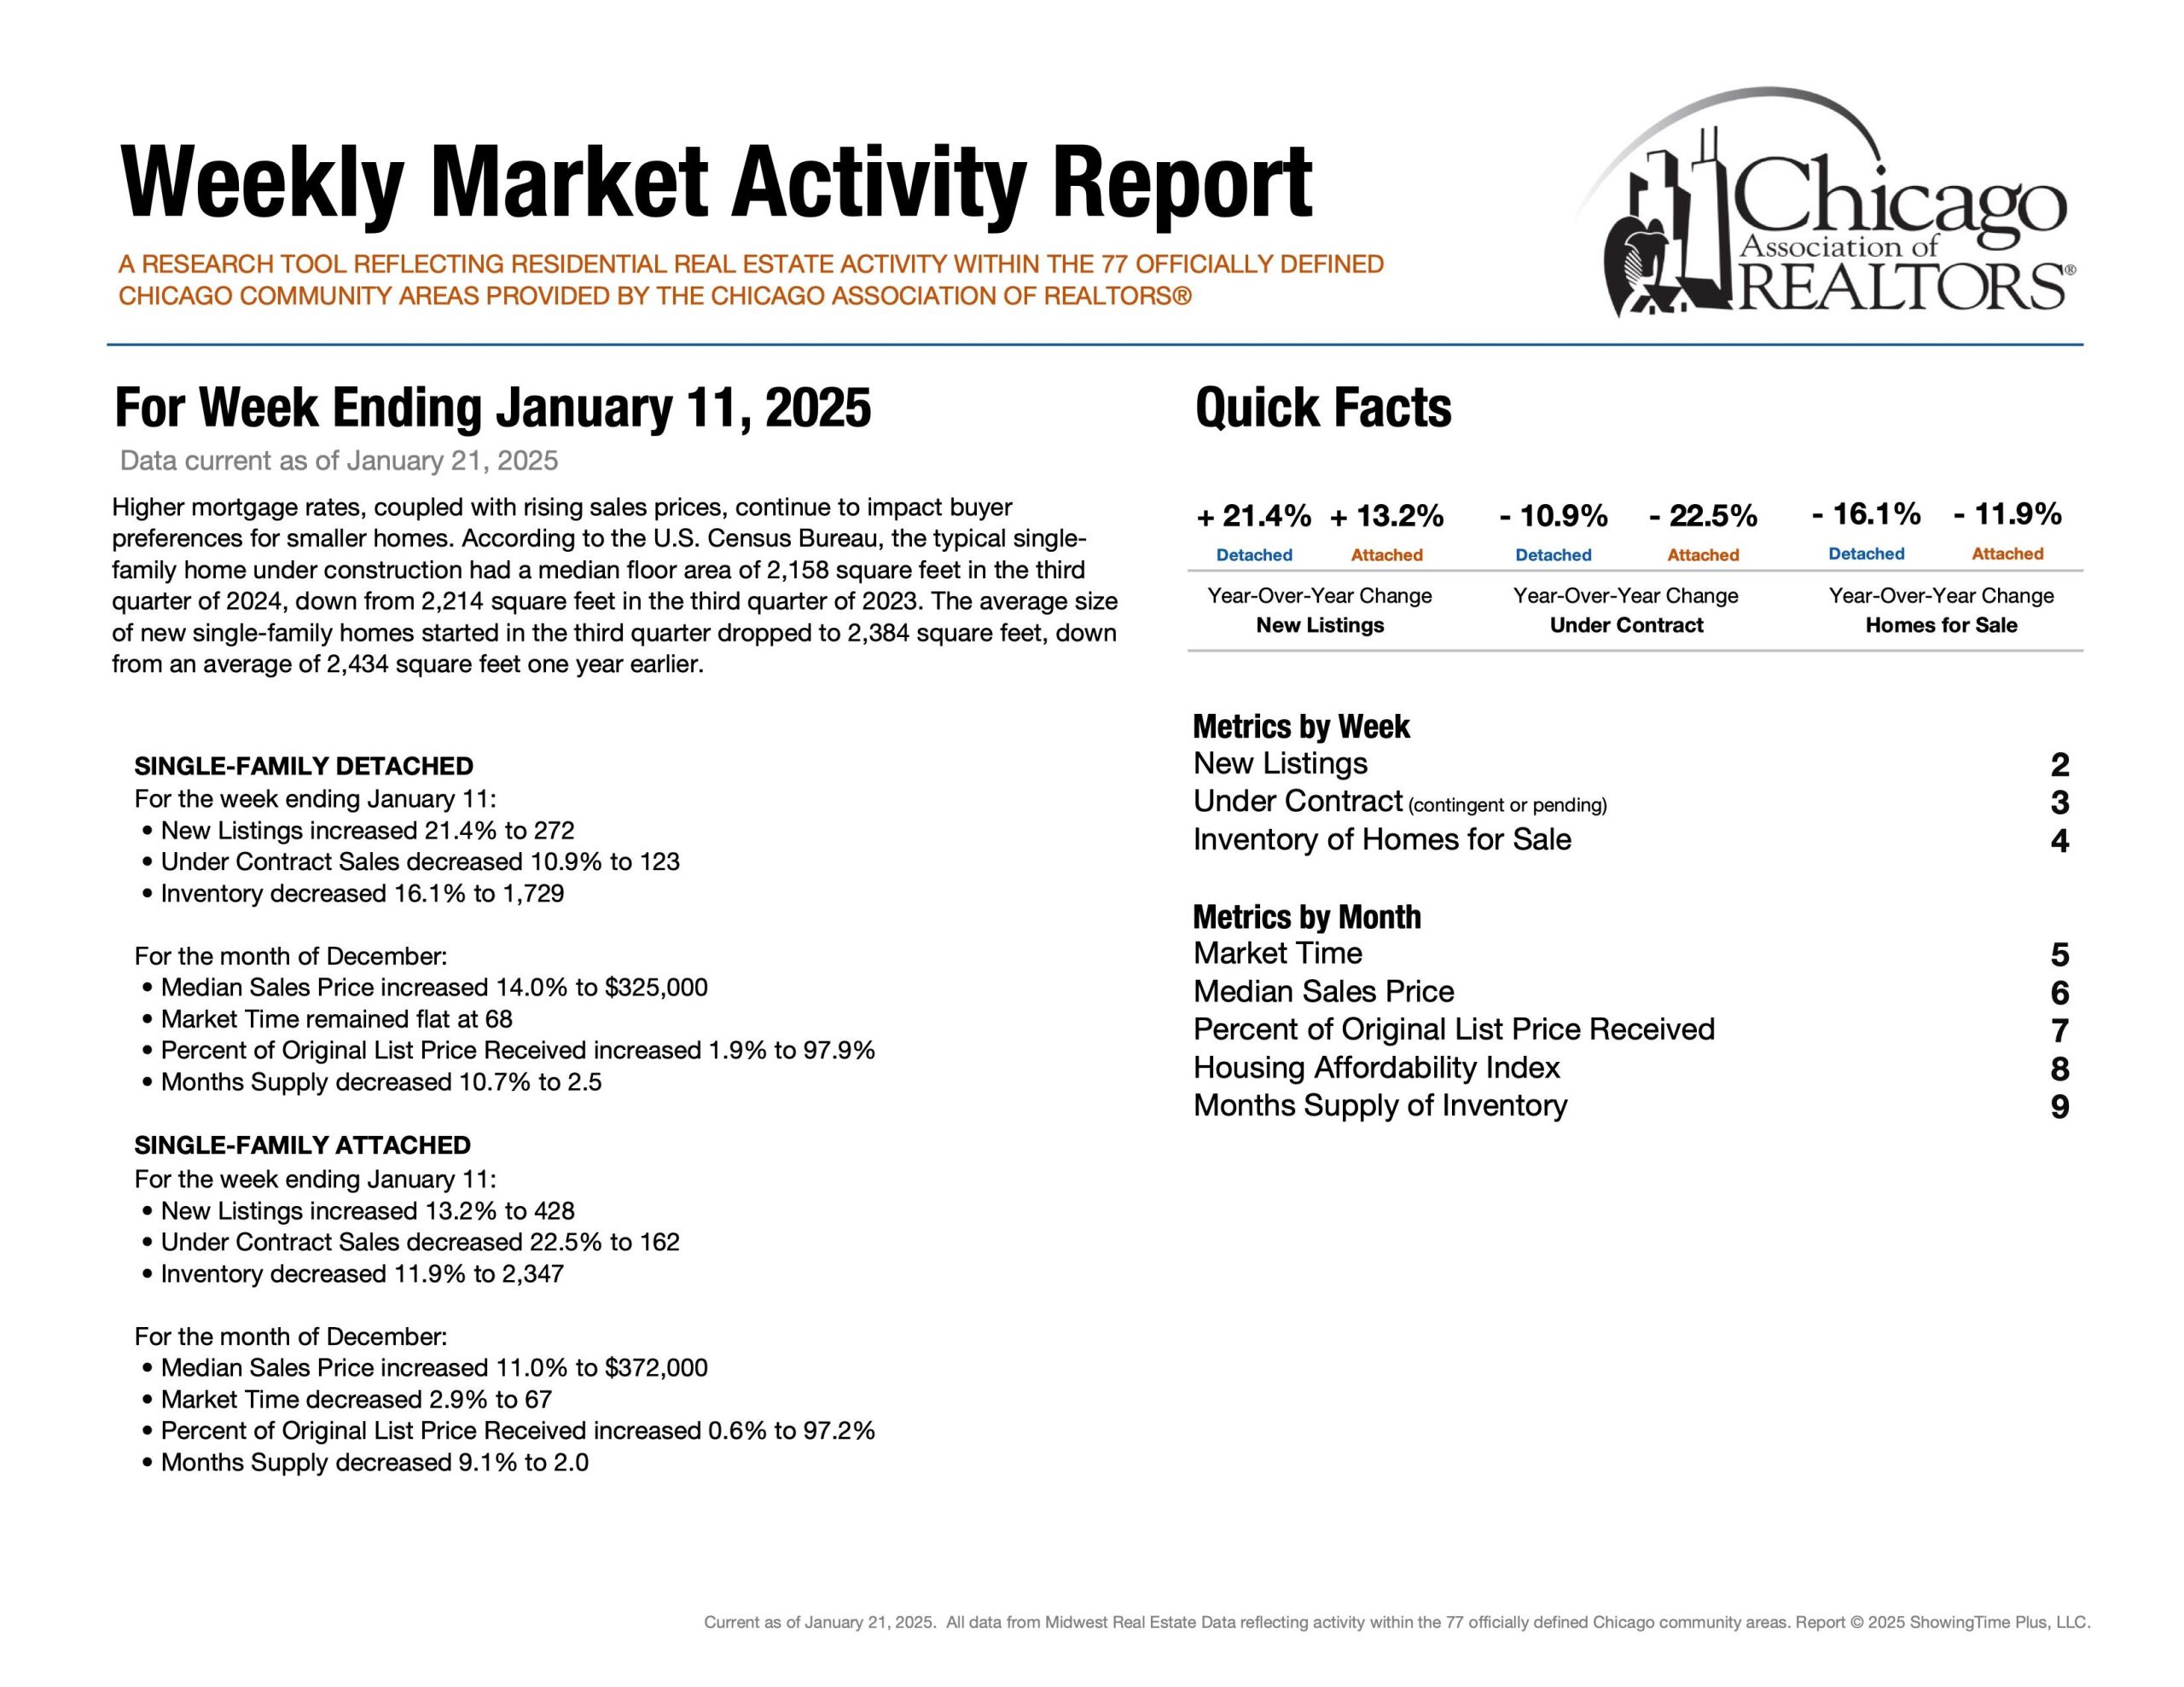
Detached Single ~ 68 Days (Dec 24′)
Attached Single ~ 67 Days (Dec 24′)
First, market time is metric that showcases speed and whether a listing was priced too low, priced properly or priced too high. If a listing surpasses average days on market, it is a check engine light that your listing maybe overpriced. Interestingly, Dec 2024 Year over Year change for Market time was 0.0%, 68 days on Market. Please note that Market Time in our context measures the distance from when a property was listed and when an offer was accepted in a given month.
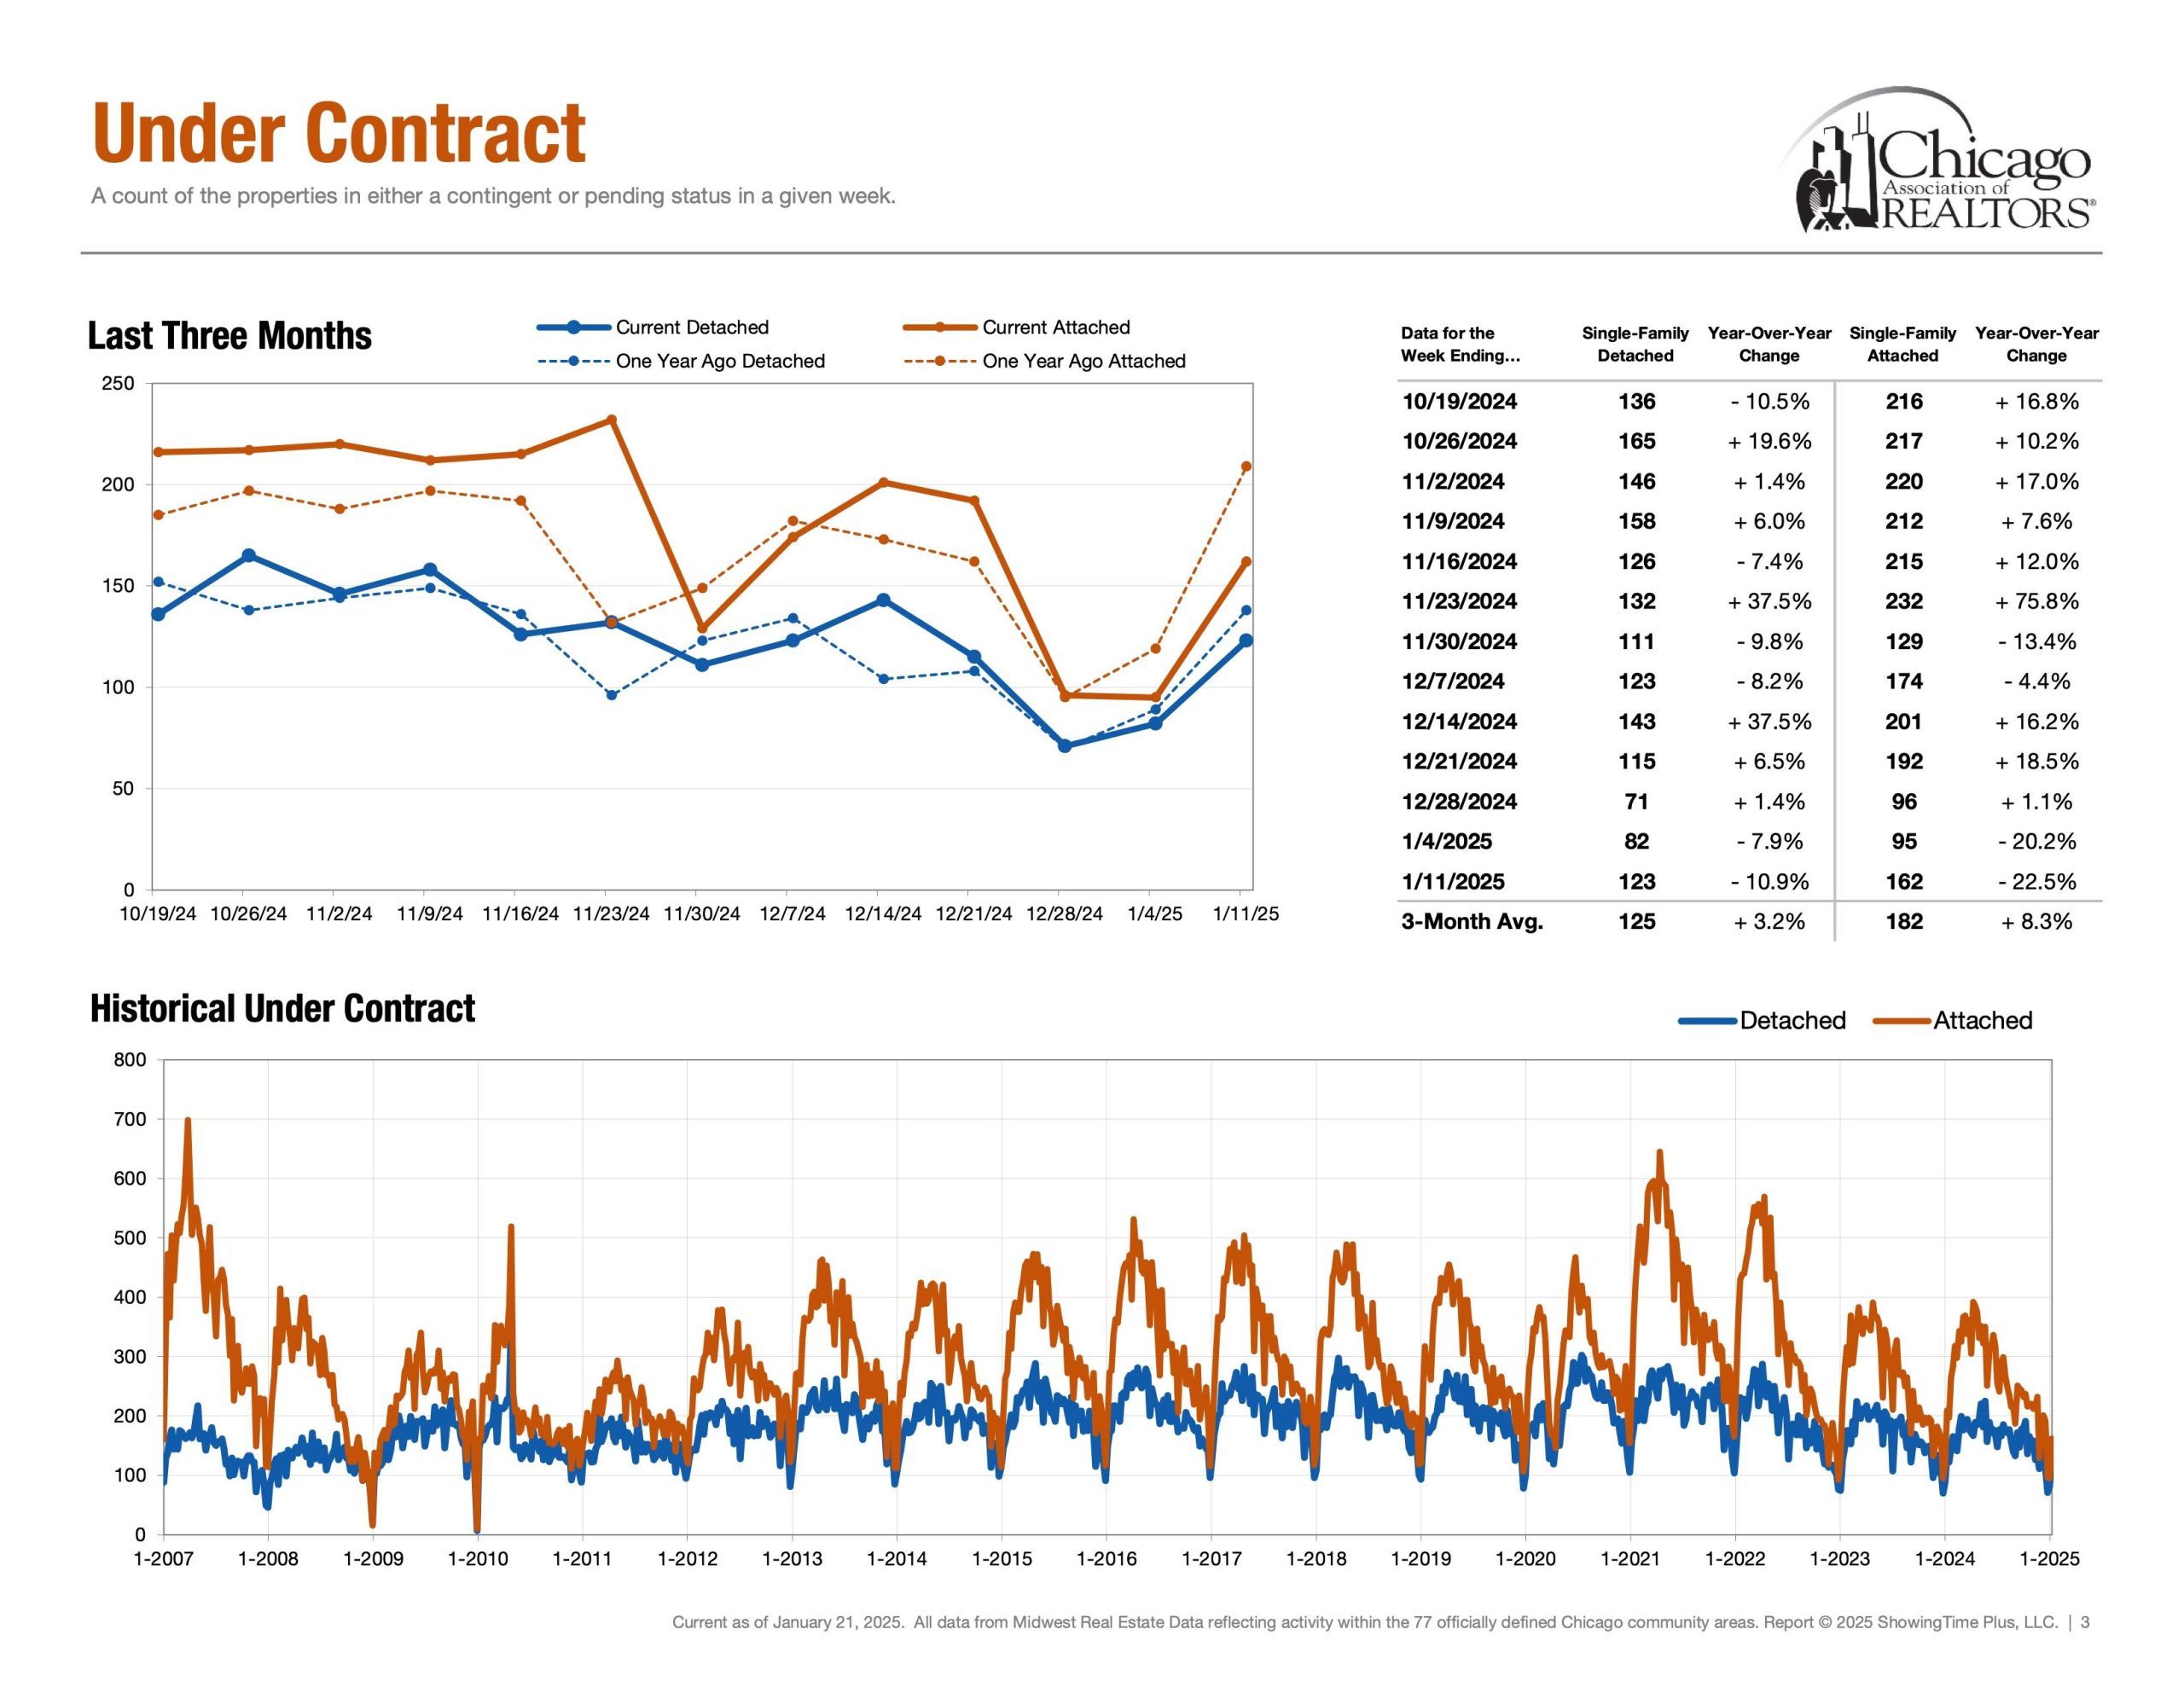
Demand | Under Contract
Detached Single = 123 Properties (Jan 5th – Jan 11th)
Attached Single = 162 Properties (Jan 5th – Jan 11th)
Secondly, under contract helps answer the question, “In our current market, how many buyers are buying?” Showcasing the heartbeat of the real estate market. Interestingly, demand metrics become more insightful when compared and contrasted with supply/inventory metrics. Demand is failing behind last year trends. Detached – 10.9%. Attached – 22.5%.
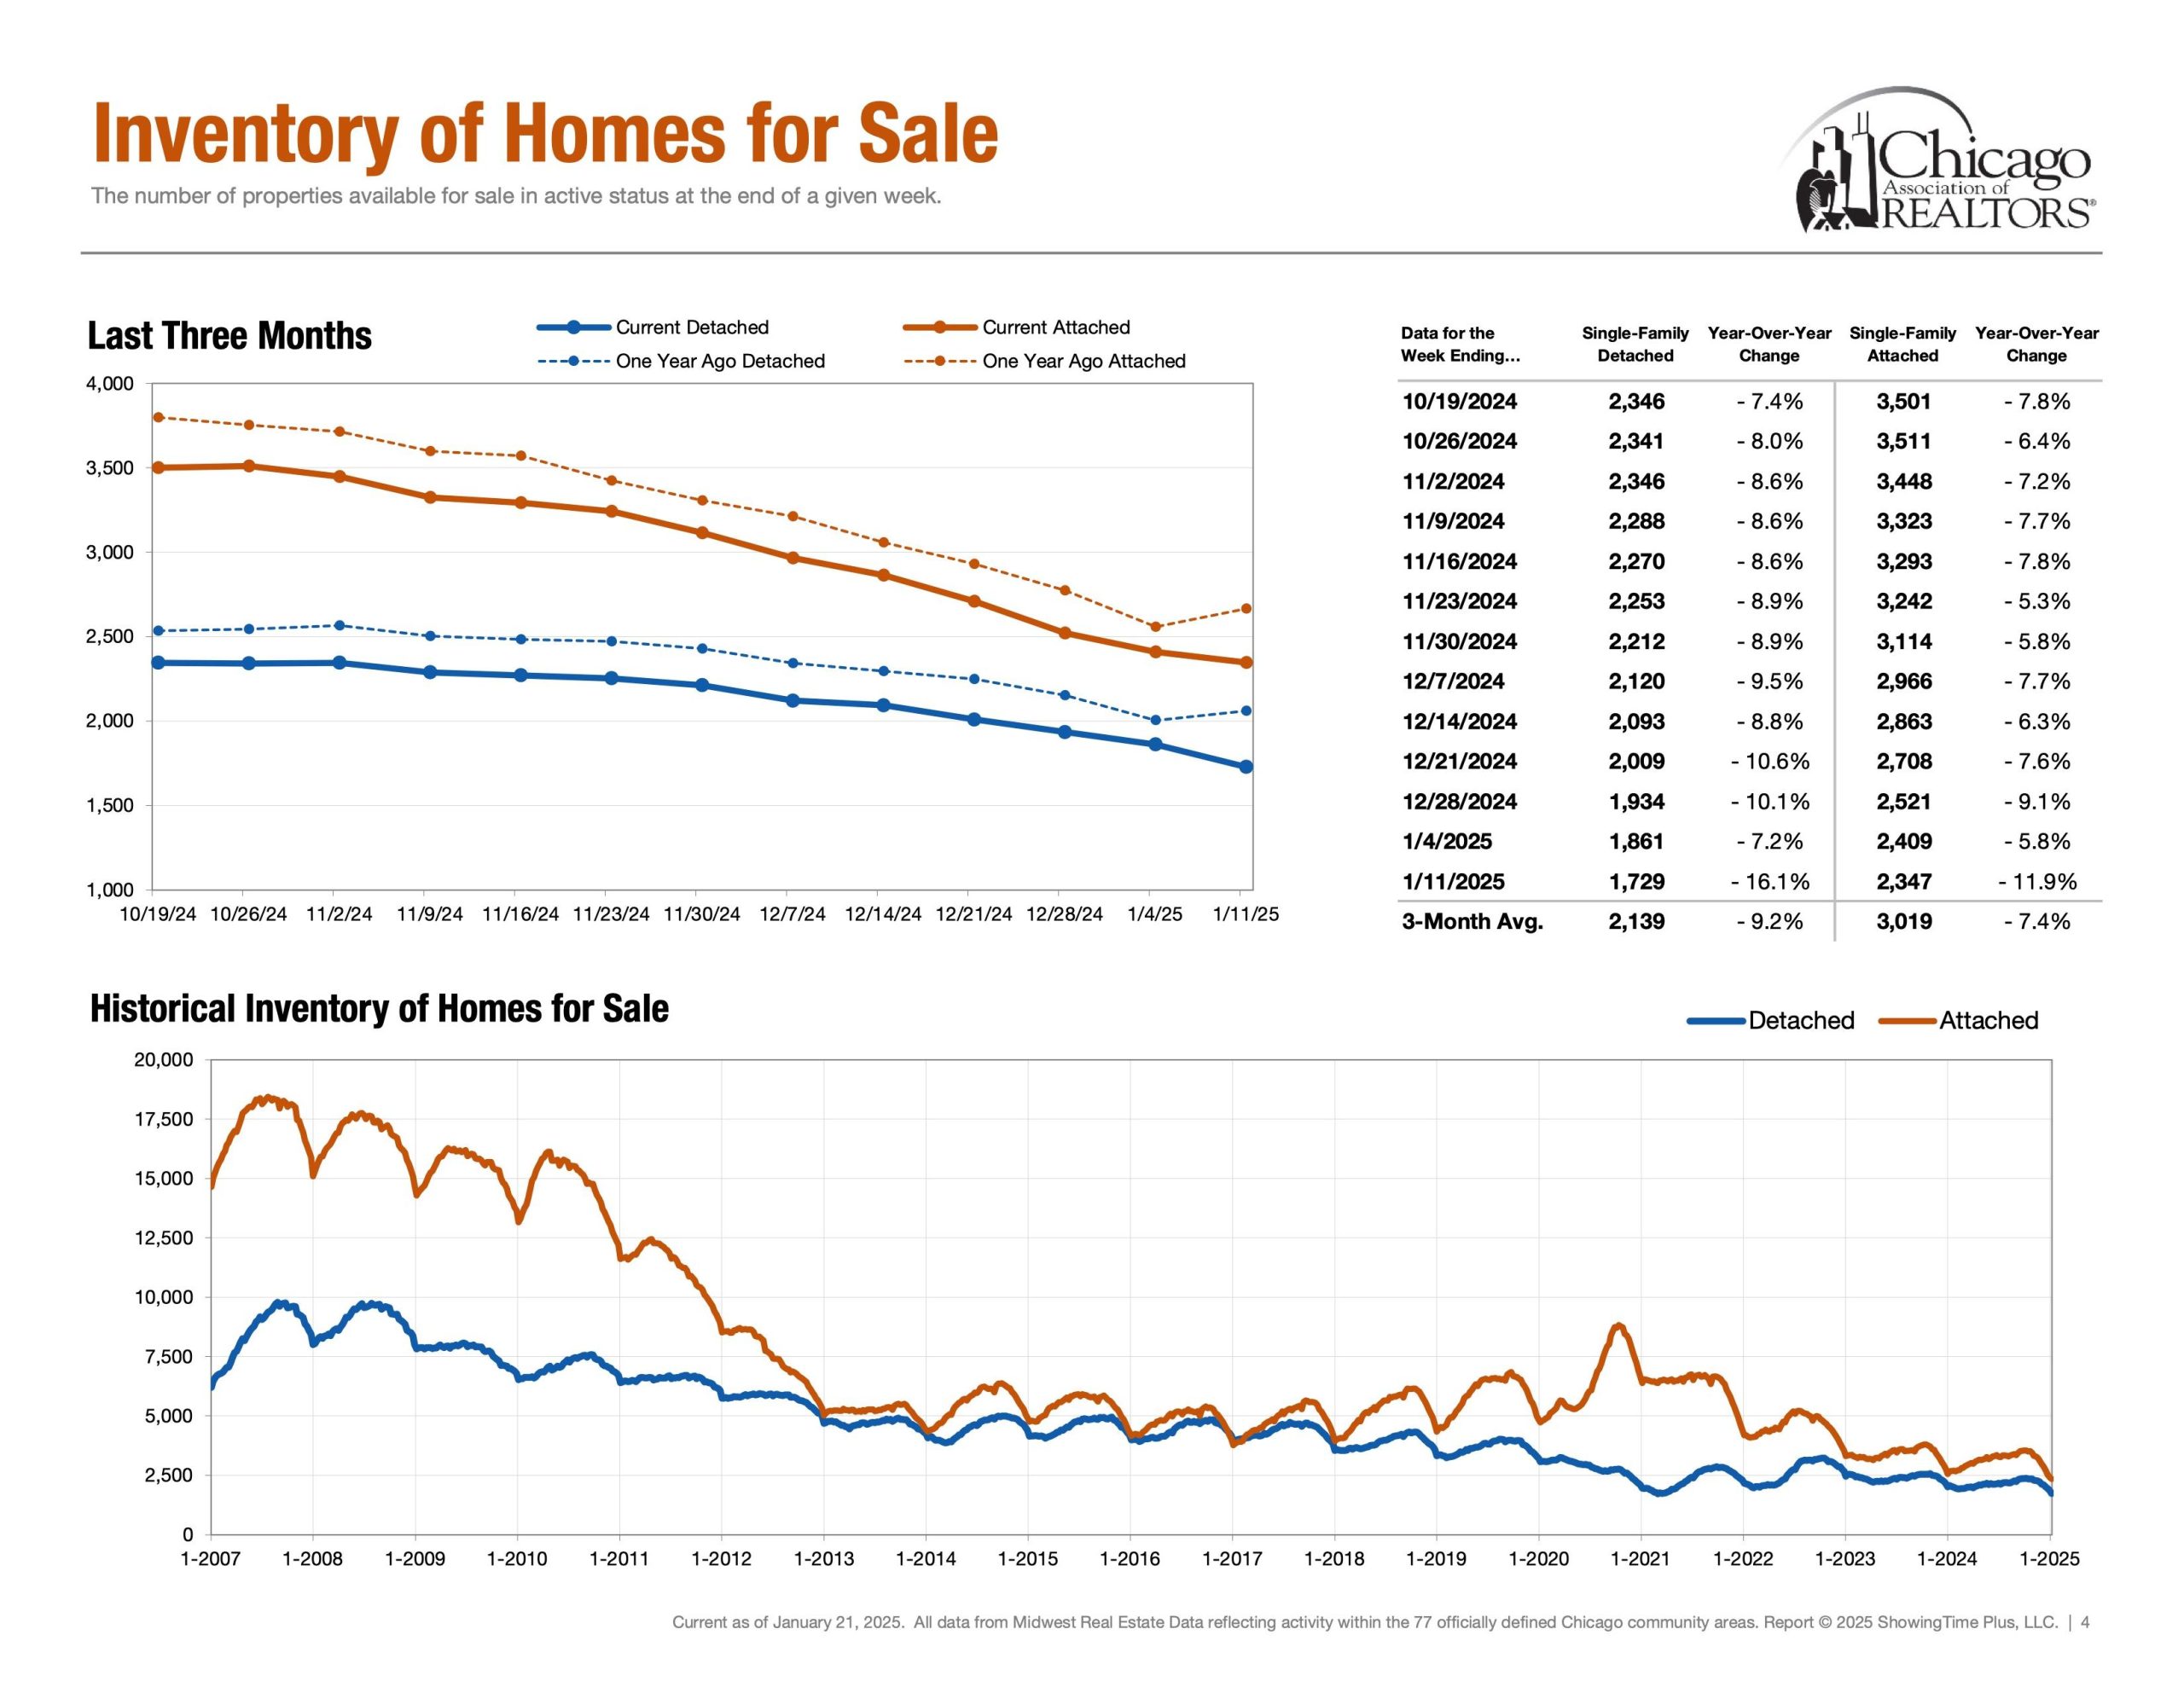
Supply | Inventory of Homes for Sale
Detached Single = 1,729 Properties (Jan 5th – Jan 11th)
Attached Single = 2,347 Properties (Jan 5th – Jan 11th)
Next, probably the metric of the year. Inventory of homes for sale showcases supply and answers the question, “How much inventory is available for buyers and how much competition sellers are up against?” Additionally, Months of Inventory, Homes for Sale, New Listings and Absorption Rate are also other key metrics in the conversation of supply.
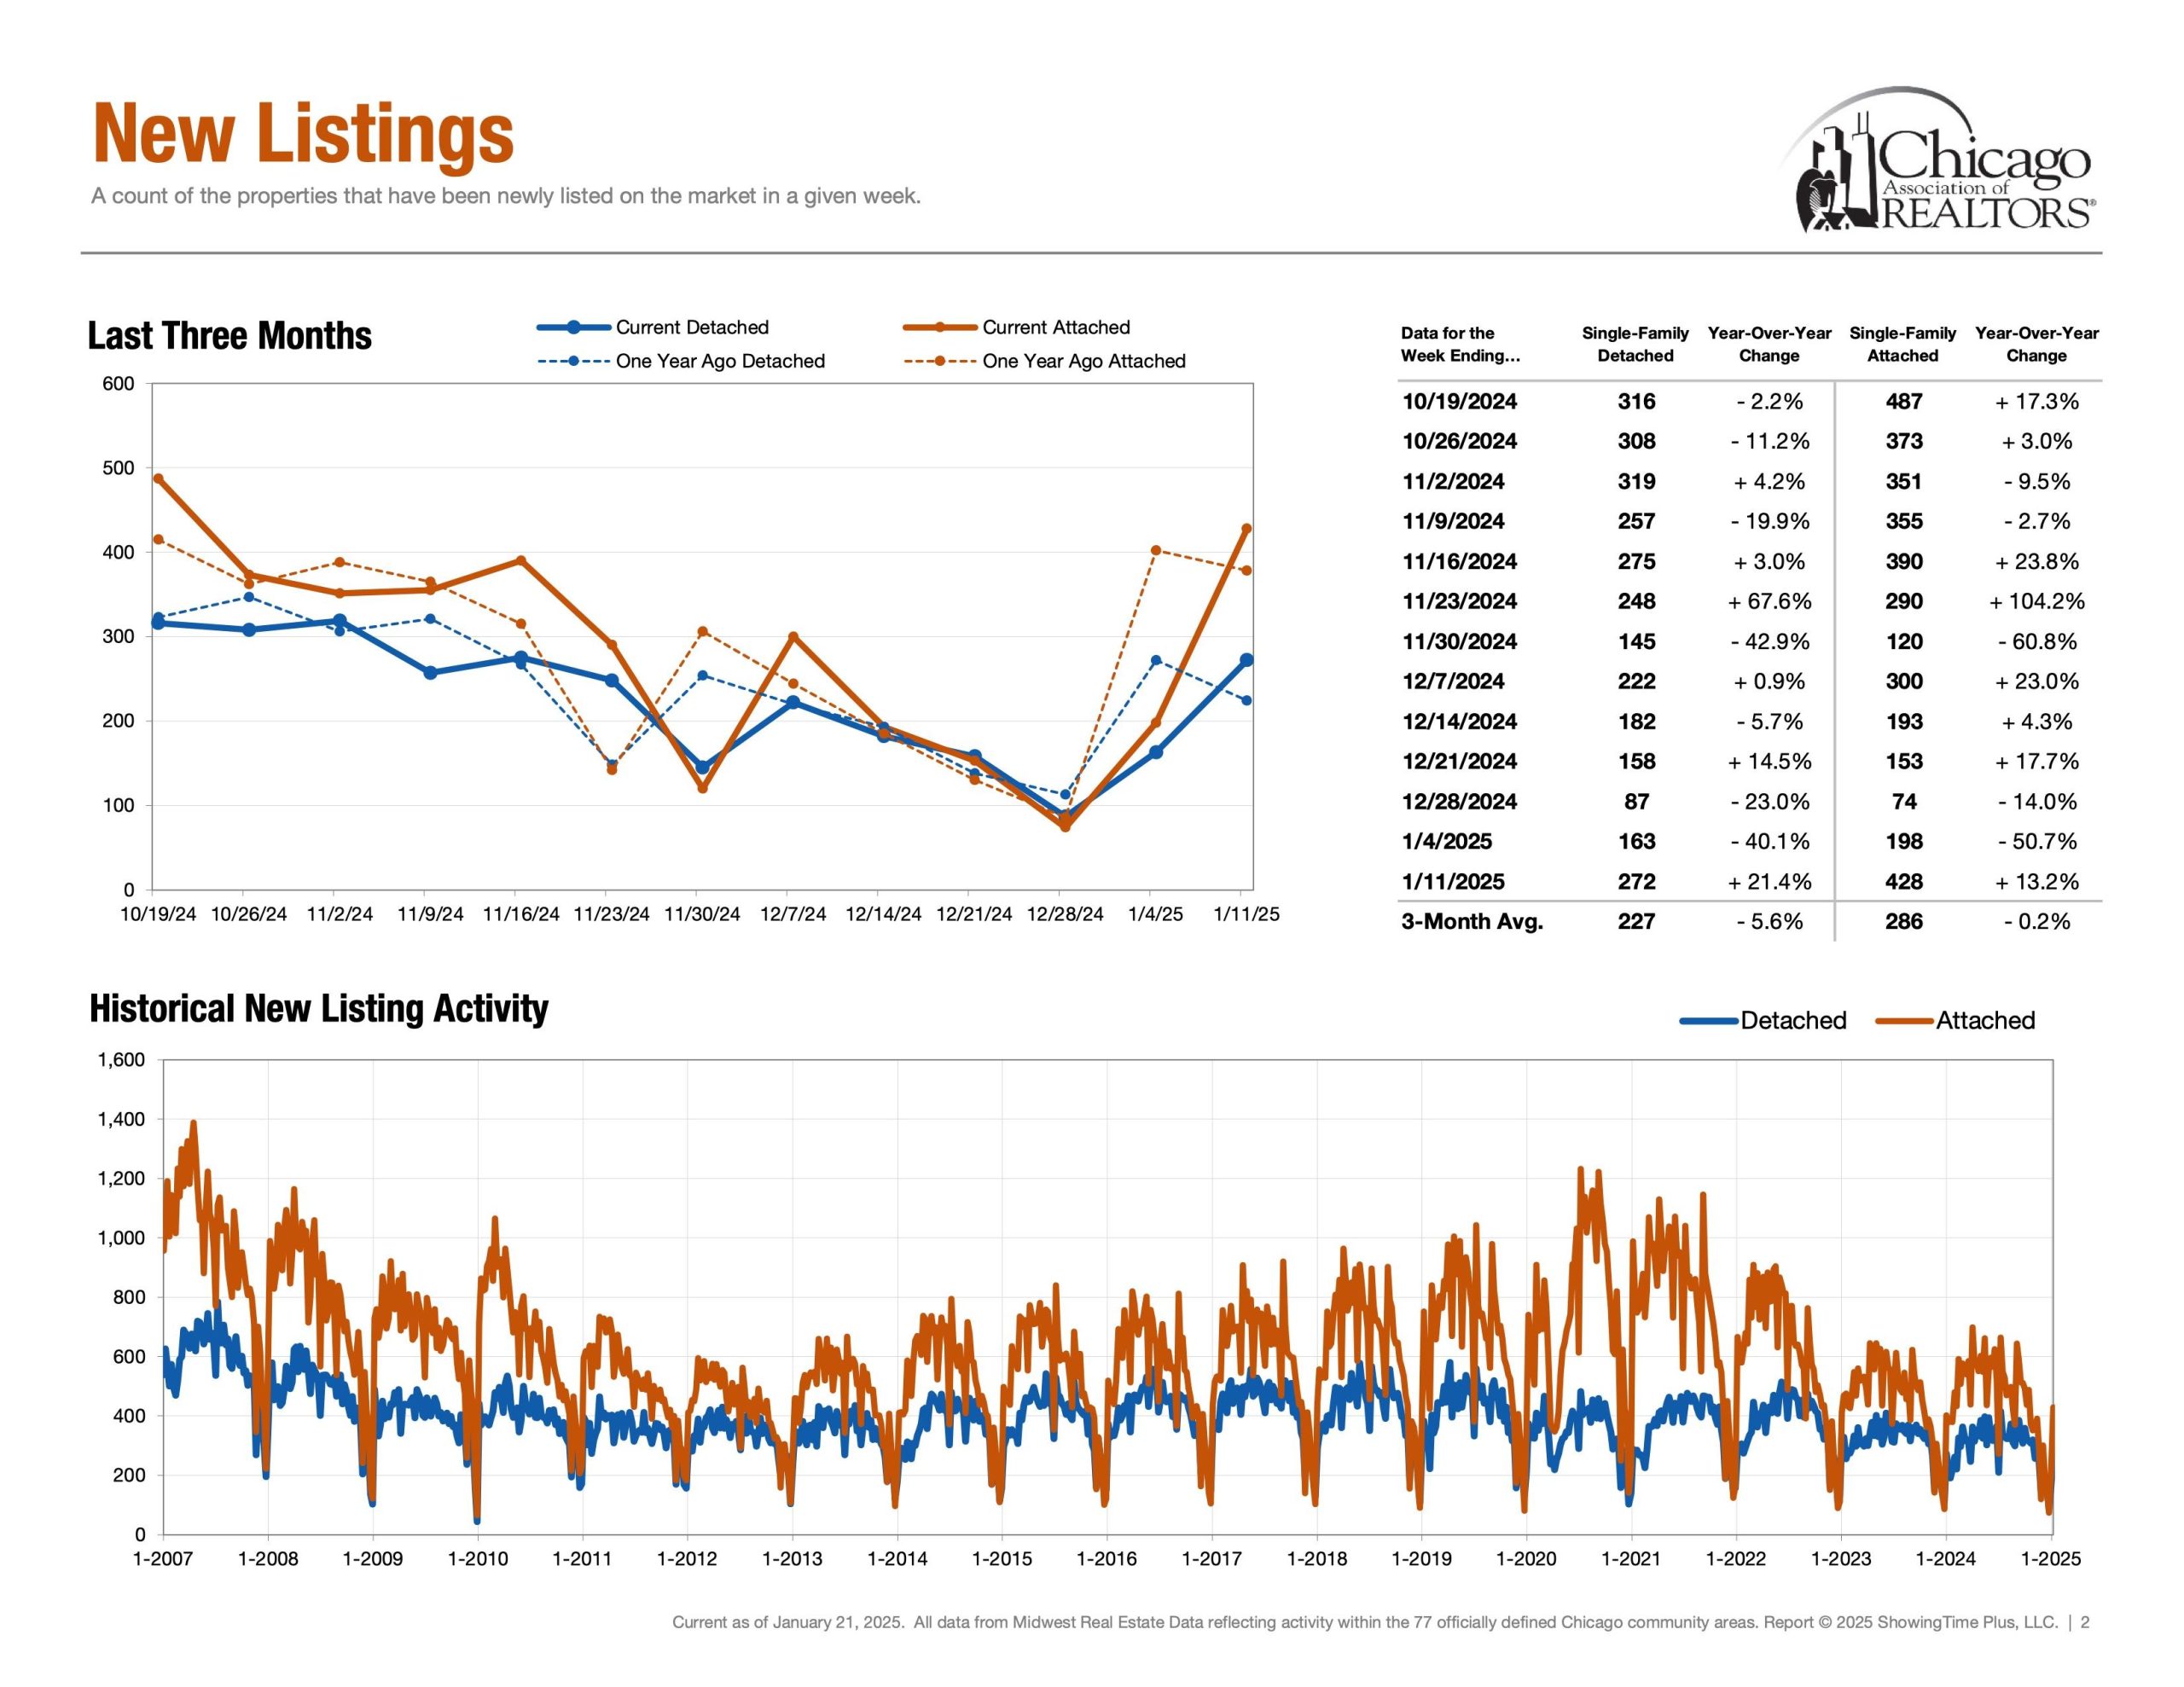
Supply | New Listings
Detached Single = 272 Properties (Jan 5th – Jan 11th)
Attached Single = 428 Properties (Jan 5th – Jan 11th)
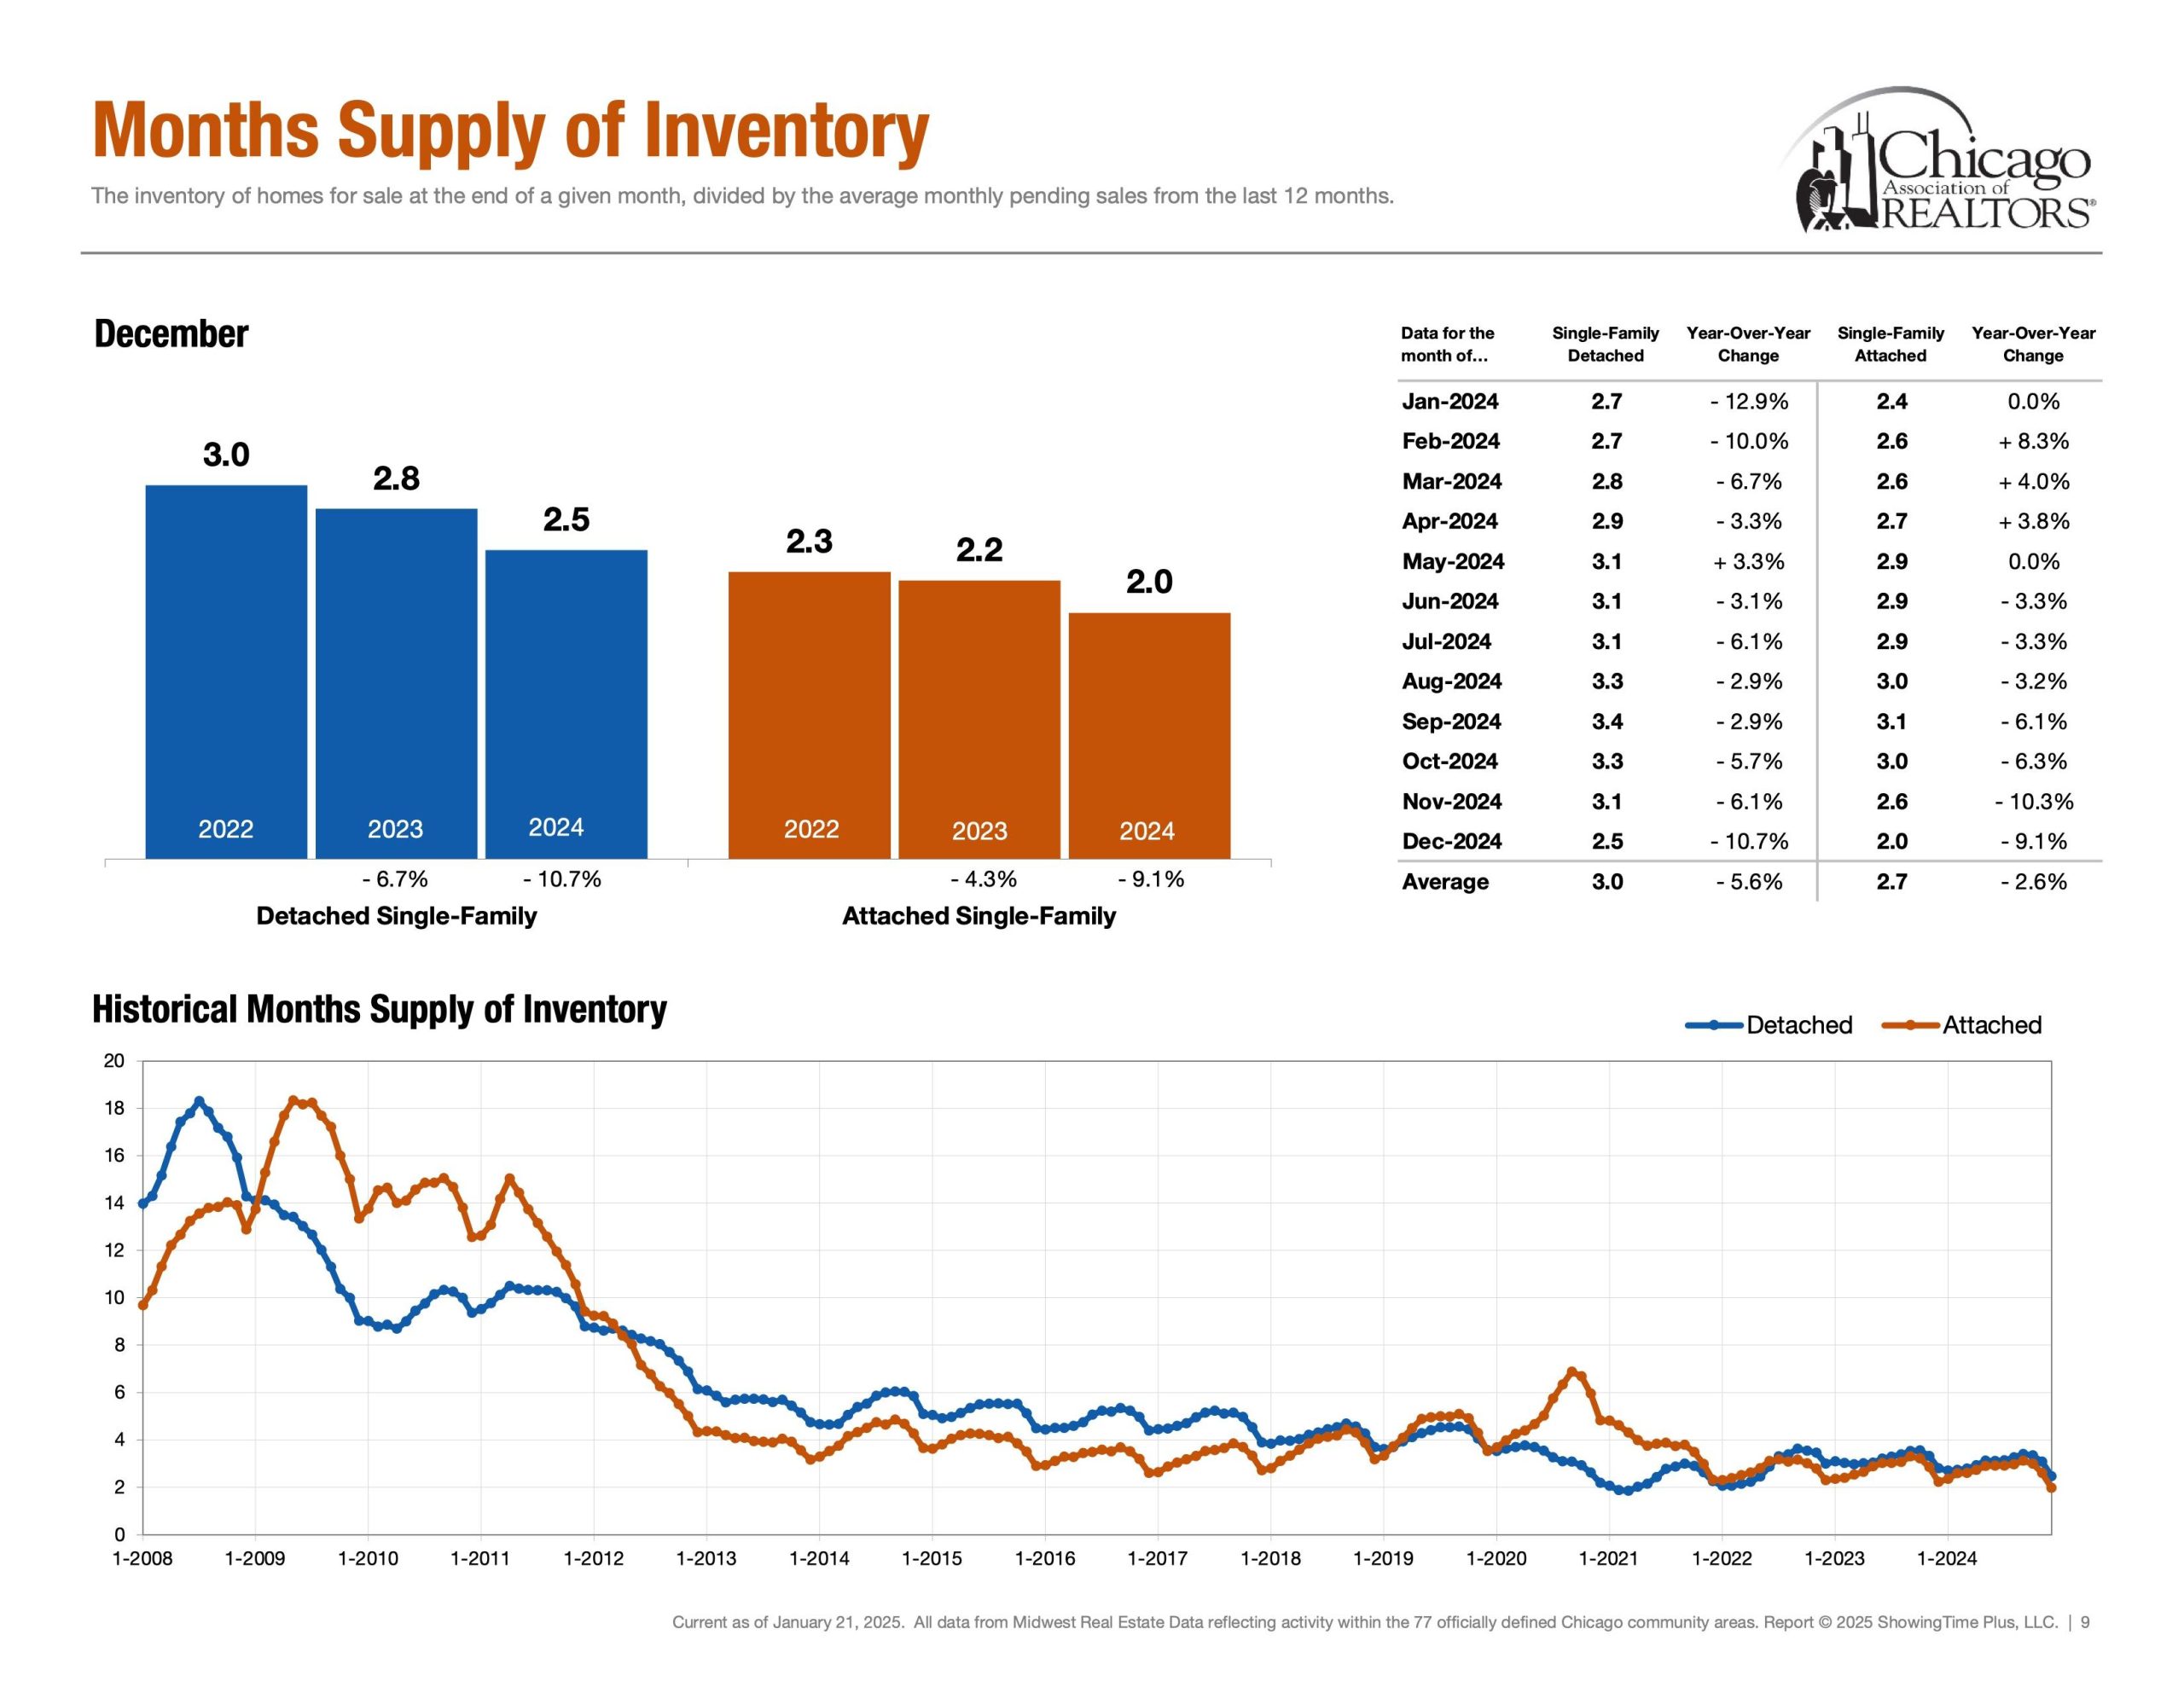
New Listings is a foreshadowing metric and helps visualize when inventory enters the market. With inventory being at historically low levels, (exhibit a: Months Supply of Inventory Chart), the market is in sore need of new inventory. If New Listings fails to grow in 2025 Demand and Under Contract growth will be blunted. Buyers will be running into each other. Multiple offers. More rounds of increase above ask offers. Are these properties even worth the above ask prices? This lack of inventory may start to make buyers nostalgic. Dreaming they could go back in time to offer the advice that America should have never stopped building homes. Try telling that to the those in the initial impact of the American Housing Crisis.
Hard to tell if the lack of inventory was a result of Covid or if we are still feeling the trauma from the housing crisis. The work that lies ahead for America’s Inventory Issue is not easy and yet The vision is clear. New Construction and New Developments will most likely be part of the medication needed to heal, to offer new home buyers an opportunity. Actions speak louder than words. If inventory enters the market to allow buyers opportunity the metric to watch would be sales price. As inventory increases, sales price could cool off. Which will feel like a bad cold to housing equity because headlines in this future forecast alternate universe may read, home values plummet as inventory rises. Or something along those lines. No one can predict the future. I can’t predict the future. And what do I know. These are just my thoughts. In my corner of the internet. High Fives!
But Matthew, says the voice on the other side of the screen? “How can New Construction be built in a City that is already built like Chicago?” Again. The work that lies ahead is not easy and yet the vision is clear. Together we have the opportunity to build a better tomorrow. One day at a time. Brick. By. Brick.
Also, New Listings for 2025 Week 2 are up. Detached 21.4%. Attached 13.2%. However Months Supply of Inventory is down. Detached -16.1%. Attached -11.9%.
New Listings going up is good. Months Supply going down, stings. However, not as much as these below freezing temperatures stung in Chicago this previous week.
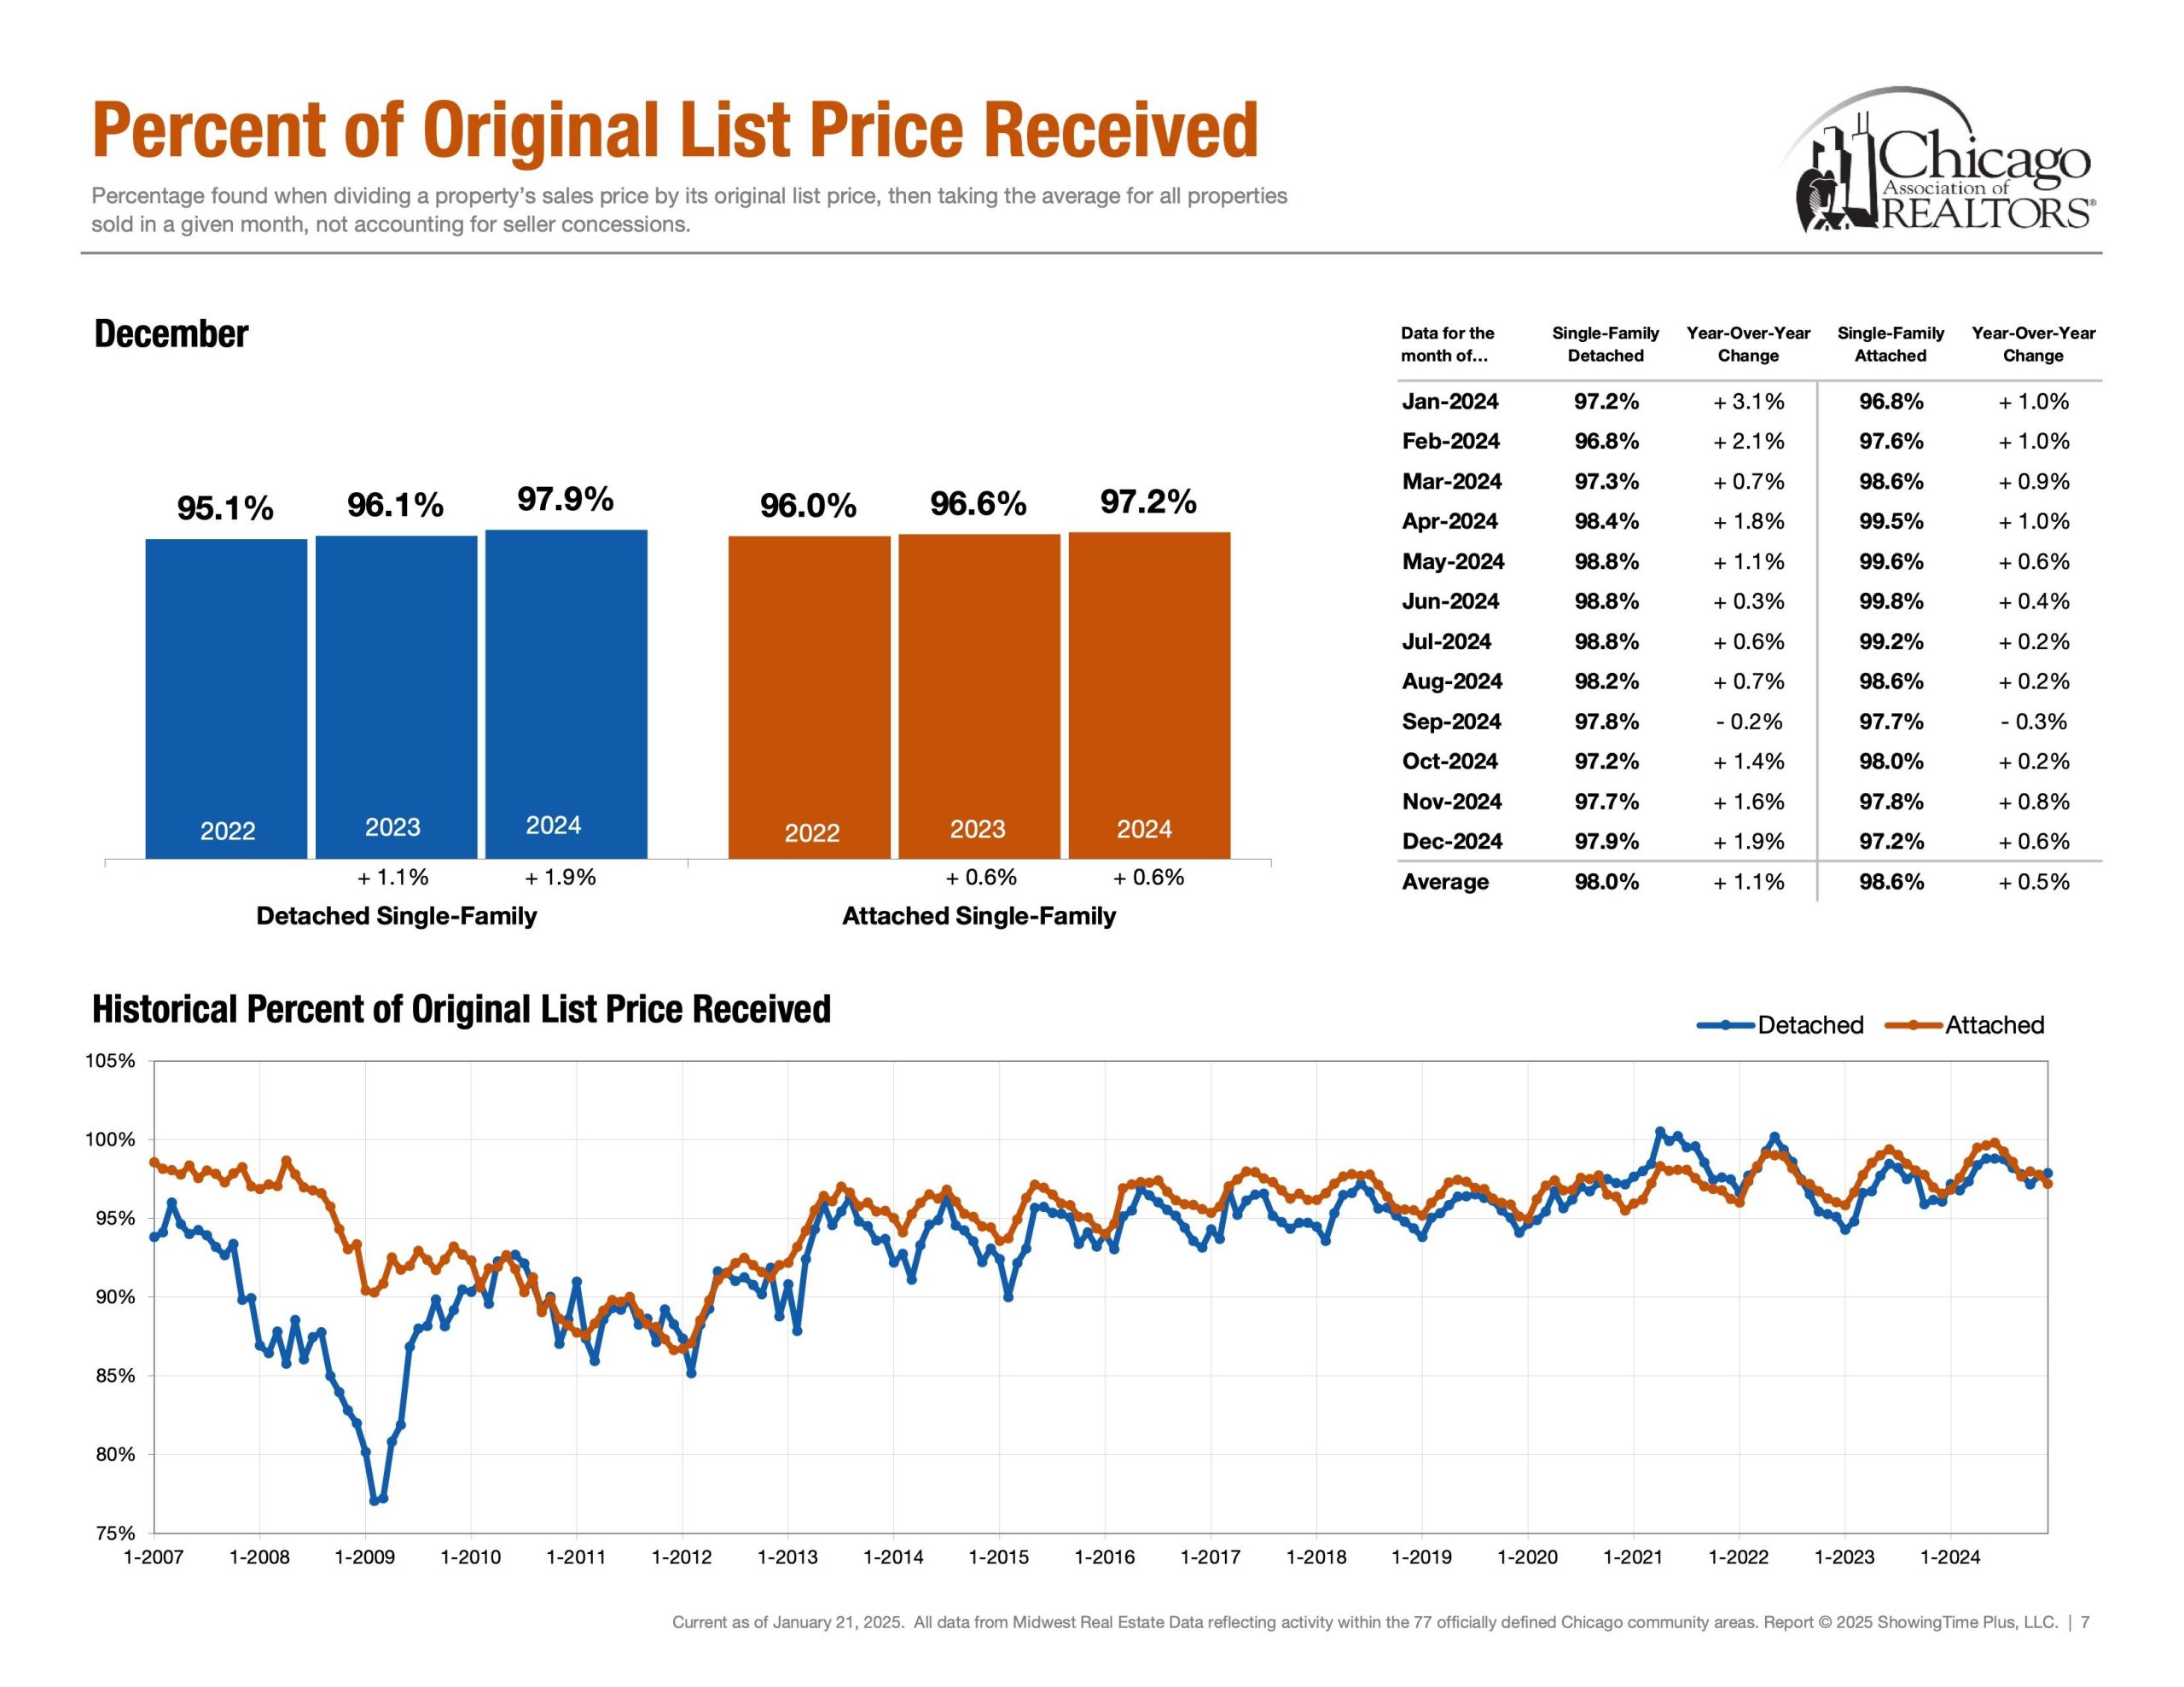
Negotiations | Percentage of Original List Price Received
Detached Single ~ 98% (Rolling 12 Months Avg) & ~ 97.9% (Dec 24′)
Attached Single ~ 98.6% (Rolling 12 Months Avg) & ~ 97.2% (Dec 24′)
Lastly, Percentage of Original List Price Received to Closed Price is a metric that showcases what the average accepted purchase price is relative to the list price. How much below asking price can an offer go while still getting accepted? How much would one have to offer above ask in order to be an above average purchase price?
The End | Have A Great Day!
Please note all of these metrics are along a spectrum as opposed to a specific number. Below is “The Weekly Market Activity Report” which is a research tool reflecting residential real estate activity within the 77 officially defined Chicago community areas provided by the Chicago Association of Realtors®. It is essential to keep in mind that real estate markets can vary across neighborhoods and property types within a city. In conclusion, economic conditions and external factors can influence market trends. Staying updated on these metrics and trends is crucial for making informed decisions.